

Summary
Cytosolic DNA activates cyclic guanosine monophosphate-adenosine monophosphate (cGAMP) synthase (cGAS), an innate immune sensor pivotal in anti-microbial defense, senescence, auto-immunity, and cancer. cGAS is considered to be a sequence-independent DNA sensor with limited access to nuclear DNA because of compartmentalization. However, the nuclear envelope is a dynamic barrier, and cGAS is present in the nucleus. Here, we identify determinants of nuclear cGAS localization and activation. We show that nuclear-localized cGAS synthesizes cGAMP and induces innate immune activation of dendritic cells, although cGAMP levels are 200-fold lower than following transfection with exogenous DNA. Using cGAS ChIP-seq and a GFP-cGAS knockin mouse, we find nuclear cGAS enrichment on centromeric satellite DNA, confirmed by imaging, and to a lesser extent on LINE elements. The non-enzymatic N-terminal domain of cGAS determines nucleo-cytoplasmic localization, enrichment on centromeres, and activation of nuclear-localized cGAS. These results reveal a preferential functional association of nuclear cGAS with centromeres.
Keywords: cGAS, cGAMP, STING, IRF3, centromere, LINE, satellite DNA, dendritic cells, interferon, nuclear envelope
Graphical Abstract
Highlights
-
•
Nuclear-localized cGAS activates a cellular innate immune response
-
•
Nuclear cGAS is 200-fold less active toward self-DNA than exogenous cytosolic DNA
-
•
Nuclear cGAS is enriched on centromeric satellite and LINE DNA repeats
-
•
The non-enzymatic N-terminal of cGAS determines nuclear localization and activity
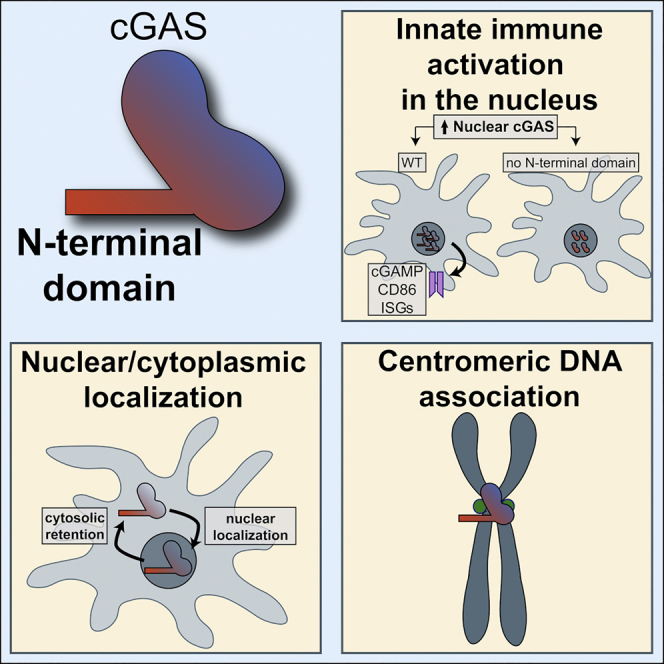
cGAS is a well-established innate immune sensor of cytosolic DNA, but its presence in the nucleus is poorly understood. Gentili et al. find that nuclear cGAS is active and enriched on centromeres and LINE DNA repeats. Nuclear-cytoplasmic distribution, centromere association, and nuclear activation are determined by its non-enzymatic N-terminal domain.
Introduction
DNA is conserved throughout evolution, posing the problem of the distinction of self-DNA from pathogen-associated or damaged self-DNA by the immune system (Schlee and Hartmann, 2016). DNA is normally absent from the cytosol, and the presence of cytosolic DNA activates cyclic guanosine monophosphate (cGMP)-AMP synthase (cGAS). Upon DNA binding, cGAS synthesizes the second messenger 2′3′-cyclic GMP-AMP (cGAMP), which binds to the Stimulator of Interferon Genes (STING), resulting in the activation of nuclear factor κB (NF-κB) and interferon regulatory factor 3 (IRF3), their translocation to the nucleus, activation of a type I interferon (IFN) response, expression of IFN-stimulated genes (ISGs), and activation of dendritic cells (Li et al., 2013b, Wu et al., 2013).
Compartmentalization of DNA in the nucleus and in mitochondria is thought to be essential to avoid self-nucleic acid recognition, and this represents the current dogma for cGAS discrimination of self- versus non-self-DNA (Sun et al., 2013). Accumulation of mitochondrial or nuclear self-DNA in the cytoplasm upon damage activates a cGAS-dependent type I IFN response or senescence (Dou et al., 2017, Glück et al., 2017, Harding et al., 2017, Härtlova et al., 2015, Lan et al., 2014, Mackenzie et al., 2017, Rongvaux et al., 2014, West et al., 2015, Yang et al., 2017). However, cGAS is also required for constitutive (also known as tonic) expression of ISGs, suggesting that a basal level of nucleic acids activates the sensor in the absence of microbial infection or apparent damage (Gough et al., 2012, Schoggins et al., 2014).
While mitochondrial integrity is linked to cell survival and its disruption leads to apoptotic cell death (Tait and Green, 2010), the nuclear envelope (NE) is a dynamic barrier in both cycling or differentiated non-dividing cells. In cycling cells, the nuclear envelope is disassembled and then reassembled during mitosis to ensure DNA segregation in daughter cells after cytokinesis (Güttinger et al., 2009). Nuclear disassembly leaves the nuclear DNA potentially accessible to cytosolic factors. Moreover, the confinement of interphase cells, such as during migration in tissues, leads to repeated nuclear envelope rupture and repair events. During nuclear envelope rupture, overexpressed cGAS binds to the exposed nuclear DNA (Denais et al., 2016, Raab et al., 2016).
Overall, while there is mounting evidence that the cGAS-STING axis can be activated by nuclear DNA released in the cytosol upon damage (Chen et al., 2016, Glück et al., 2017, Harding et al., 2017, Yang et al., 2017), the regulation and consequences of putative cGAS recruitment into the nucleus are poorly understood. We asked how cGAS recruitment to the nucleus is determined and to what extent cGAS could be activated in the nucleus itself.
Results
cGAS has been described as a cytosolic sensor of DNA (Sun et al., 2013), but the localization of the endogenous protein in primary immune cells has not been extensively studied. To exclude interference from the cell cycle, which results in nuclear envelope disassembly, we examined the localization of endogenous cGAS in primary human monocyte-derived dendritic cells (DCs) that are terminally differentiated and in interphase (Ardeshna et al., 2000). Endogenous cGAS protein staining was specific and showed the distribution of the sensor in both the cytoplasm and the nucleus (Figure S1A). The average cGAS intensity was higher in the nucleus than in the cytoplasmic area of the cells (Figure 1A). In the nucleus, cGAS displayed a punctate, perinuclear ring of stronger intensity within the DAPI staining (Figures 1B and S1B). Biochemical fractionation confirmed the presence of cGAS in the nuclear fraction of DCs at steady state (Figures 1C and S1C). Endogenous nuclear cGAS was also present in wild-type (WT) mouse bone marrow-derived DCs and lost in Cgas−/− cells (Figure 1D). Thus, both a cytoplasmic and a nuclear pool of cGAS are present in DCs.
Figure 1.

cGAS Is Present in the Nucleus as a Result of Nuclear Envelope Opening
(A) Quantification of mean endogenous cGAS intensity in the nucleus (N) or in the cytoplasm (C) of post-mitotic human monocyte-derived dendritic cells (DCs) (n > 60 cells for each donor, 3 independent donors combined from 2 independent experiments; red lines represent average and black lines represent SD, 1-way ANOVA with post hoc Tukey test; ∗∗∗∗p < 0.0001).
(B) Top: immunofluorescence staining of endogenous cGAS (red) and DAPI (blue), cGAS staining and (bottom) overlay plots of pixel intensity measured along the yellow line of cGAS (red) and DAPI (blue). For DAPI, refer to Figure S1B. Scale bars, 10 μm.
(C) Nuclear-cytoplasmic fractionation of post-mitotic human DCs and immunoblots for endogenous cGAS (top), tubulin (center), and lamin B1 (bottom). C, cytosolic fraction; N, nuclear fraction. One donor representative of n = 4 donors. See Figure S1C for the other donors.
(D) Nuclear-cytoplasmic fractionation of mouse bone marrow-derived DCs from two wild-type (WT) or two cGAS knockout (Cgas−/−) mice and immunoblot for endogenous cGAS (top), tubulin (center), and lamin B1 (bottom). C, cytosolic fraction; N, nuclear fraction (representative of n = 3 independent mice).
(E) Sequential images of cycling HeLa cell stably expressing histone 2B (H2B)-mCherry (red) and GFP-cGAS (green) before (0 min), at (56–57 min), and after (80 min) nuclear envelope breakdown. Scale bars, 10 μm.
(F) Nuclear-cytoplasmic ratio of mean GFP-cGAS intensities in cells as in (E) (n = 59 cells combined from 2 independent experiments; red line represents mean, error bars represent SDs).
(G) Sequential images of one representative HeLa cell as in (E) with GFP-cGAS in the cytosol before mitosis. Scale bars, 10 μm.
See also Figure S1.
In contrast to endogenous cGAS, GFP-cGAS expressed during interphase localizes mostly to the cytosol of DCs (Raab et al., 2016). Through hematopoietic development, DCs result from a series of mitotic events (Lee et al., 2015). We hypothesized that endogenous nuclear cGAS in interphase could result from the interaction with nuclear DNA during nuclear envelope breakdown that occurred in a previous mitosis. We tracked cGAS localization during the cell cycle using the stable expression of GFP-cGAS in a cycling HeLa cell line. In this stable culture, the ratio of nuclear-cytoplasmic mean GFP-cGAS intensity was >1 for 60% of cells and <1 for 40% of cells (Figures 1E and 1F). To follow the ability of GFP-cGAS to enter the nucleus in mitosis, we tracked cells that contained mostly cytoplasmic cGAS before mitosis (Figures 1E and 1G; Videos S1 and S2). At early metaphase, cGAS started to accumulate at the periphery of the nucleus, coinciding with the onset of nuclear envelope breakdown. After nuclear envelope breakdown and through mitosis, cGAS accumulated on distinctive chromosomes. After cytokinesis, the inherited pool of nuclear cGAS persisted in the nucleus during the next interphase, with a slow decay across several hours, while the cytoplasm, initially devoid of cGAS at the onset of interphase, gradually accumulated cGAS (Figure S1D; Video S3). Deletion of amino acid regions K173-I220 and H390-C405 in cGAS, which contain DNA-binding surfaces (cGAS ΔK173-I220ΔH390-C405), prevented accumulation on chromosomes after nuclear envelope breakdown (Figure S1E; Video S4) (Li et al., 2013a). Therefore, cGAS is expressed as a cytosolic protein in interphase, but nuclear envelope breakdown during the cell cycle renders the DNA available for cGAS binding and recruitment in the nucleus, and this generates daughter cells with a pool of nuclear cGAS that persists during the next interphase.
HeLa cells stably expressing H2B-mCherry (red) and GFP-cGAS (green). One cell is going through mitosis.
HeLa cell expressing GFP-cGAS (green) and H2B-mCherry (red) going through mitosis. Scale bar is 10μm.
HeLa cells stably expressing H2B-mCherry (red) and GFP-cGAS (green). One cell is going through mitosis followed by the next interphase, showing decay of nuclear GFP-cGAS after mitosis. Red indicates nuclear mask. Blue corona indicates cytoplasmic mask.
HeLa cells stably expressing GFP-cGAS ΔK173-I220ΔH390-C405 (green) labeled with siR-DNA (red). Various cells are going through mitosis. Time is hh:mm. Scale bar is 10μm.
DCs demonstrate low levels of co-stimulatory molecule expression CD86 at steady state (Gentili et al., 2015), suggesting that endogenous nuclear cGAS is not sufficient to activate innate immunity despite an excess of DNA. We aimed to test whether increased levels of nuclear cGAS could lead to the innate activation of DCs. DNA damage was recently proposed to induce the nuclear translocation of cGAS (Liu et al., 2018). We expressed GFP-cGAS and the DNA damage reporter mCherry-53BP11224-1716 (Raab et al., 2016) in DCs. Etoposide induced nuclear 53BP1 foci, indicating DNA damage, but GFP-cGAS did not translocate in the nucleus of DCs (Figures S1F and S1G). To enforce the nuclear localization of cGAS, we transduced DCs with a GFP control lentivector or with lentivectors coding for GFP-cGAS or GFP-cGAS fused to a nuclear localization signal (NLS) (GFP-NLS-cGAS). We previously showed that cytomegalovirus (CMV)-driven GFP-cGAS-coding lentivectors induce CD86 in the absence of vector expression in DCs due to cGAS expression and activation in lentivector-producing cells. This leads to cGAMP packaging in viral particles and transfer to DCs, which activates STING and interferes with efficient cGAS expression (Gentili et al., 2015). To limit cGAS expression in lentivector-producing cells, we developed a lentiviral vector in which the expression of the insert is driven by an inverted human leukocyte antigen-DR isotype α (HLA-DRα) promoter (Figure 2A). We next efficiently transduced DCs using Vpx to overcome SAMHD1 restriction (Hrecka et al., 2011, Laguette et al., 2011) (Figure S2A). When transduced with GFP-NLS-cGAS, DCs showed exclusive nuclear localization of the sensor, while GFP-cGAS transduction was mainly cytosolic (Figure 2B). Monocyte-derived DCs are in G0 phase and do not cycle; hence, the cytoplasmic localization of cGAS is consistent with the lack of mitosis in these cells, in contrast to cycling HeLa cells (Figure 1E). We measured the induction of the co-stimulatory molecule CD86, a marker of innate immune activation in DCs. DCs transduced in the absence of Vpx did not express GFP and did not upregulate CD86, indicating that no significant cGAMP transfer from lentivector-producing cells was occurring (Figures 2C, 2D, and S2A). DCs transduced with GFP-NLS-cGAS in the presence of Vpx upregulated CD86 compared to a control vector (Figures 2C and 2D). CD86 upregulation was higher for NLS-GFP-cGAS than for GFP-cGAS, despite similar transduction levels (Figures 2D and S2A). We conclude that with the inverted HLA-DRα promoter system, cGAMP transfer by viral particles is not implicated and that NLS-cGAS expression from the lentivector in the transduced DCs induces the CD86 activation marker.
Figure 2.

Nuclear-Localized cGAS Activates an Innate Immune Response in DCs
(A) Schematic representation of the lentivector insert with GFP under the control of an inverted HLA-DRα promoter. Arrows represent transcription direction from the LTRs in transfected 293FT cells and from the inverted HLA-DRα promoter in transduced DCs.
(B) Confocal microscopy of DCs transduced with GFP (top), GFP-cGAS (center), or GFP-NLS-cGAS (bottom) lentivectors under the control of the inverted HLA-DRα promoter. GFP (green), DAPI (blue). One representative field from 1 donor of n = 2 donors. Scale bars, 10 μm.
(C) GFP and CD86 expression in DCs after transduction with lentivectors encoding for GFP, GFP-cGAS, or GFP-NLS-cGAS, in the presence or in absence of Vpx. Representative of n = 9 donors in 4 independent experiments.
(D) CD86 expression in DCs transduced as in (C); n = 9 donors of 4 independent experiments. One-way ANOVA with post hoc Tukey test.
(E) Schematic representation as in (A) of the lentivector insert with GFP under the control of the SFFV promoter.
(F) GFP and CD86 expression in DCs after transduction with GFP-NLS (control [CTR]) or GFP-NLS-cGAS lentivectors in pTRIP-SFFV, in the presence or in absence of Vpx. Representative of n = 4 donors in 2 independent experiments.
(G) GFP and SIGLEC1 expression in DCs stably transduced as in (F). Representative of n = 4 donors in 2 independent experiments.
(H) CD86 expression in DCs transduced as in (F); n = 4 donors in 2 independent experiments. One-way ANOVA with post hoc Tukey test.
(I) SIGLEC1 expression in DCs transduced as in (F) in the presence or absence of Vpx; n = 4 donors of 2 independent experiments. One-way ANOVA with post hoc Tukey test.
(J) CD86 expression in dose titration of GFP-NLS or GFP-NLS-cGAS lentivectors in pTRIP-SFFV, within GFP+ (green) and GFP− (black) DC populations. Solid lines represent means, light-colored limits represent SEMs; n = 4 donors in 2 independent experiments. One-way ANOVA with post hoc Tukey test.
(K) SIGLEC1 expression of cells transduced as in (J).
(L) Expression of MX1, CXCL10, IFIT1, and OAS1 relative to ACTB, in DCs transduced with GFP-NLS or GFP-NLS-cGAS lentivectors; n = 6 donors combined from 2 independent experiments. One-way ANOVA with post hoc Sidak test on log-transformed data.
∗p < 0.05, ∗∗p < 0.01, ∗∗∗p < 0.001, ∗∗∗∗p < 0.0001, ns, non-significant. See also Figure S2.
Activation of DCs by GFP-NLS-cGAS driven by inverted HLA-DRα remained limited. To determine whether further increasing the expression of GFP-NLS-cGAS in DCs could reveal a full activated state, we tested the spleen focus forming virus (SFFV) promoter (Figure 2E). SFFV-driven lentivectors efficiently transduced DCs with Vpx (Figures S2B and S2C). In transduced DCs, expression of GFP-NLS-cGAS with Vpx induced CD86 and the ISG SIGLEC1 (Figures 2F–2I, S2D, and S2E). CD86 upregulation was restricted to the GFP+ fraction of DCs transduced with GFP-NLS-cGAS (Figure 2J), while SIGLEC1 was also induced in GFP− cells in the same well, which indicated the production of soluble type I IFN as a result of GFP-NLS-cGAS expression (Figure 2K). CD86 and SIGLEC1 induction by GFP-NLS-cGAS expression in DCs required an intact catalytic site in cGAS, which is indicative of the enzymatic activation of cGAS in the nucleus (Figures S2F–S2H). The ISGs MX1, CXCL10, IFIT1, and OAS1 were also upregulated by GFP-NLS-cGAS (Figure 2L). To further validate that increasing levels of nuclear cGAS lead to innate immune activation, we performed dose titrations of the lentivectors driven by either promoter and plotted CD86 over the mean fluorescence intensity (MFI) of GFP (Figures S2I and S2J). CD86 expression was correlated with the GFP-NLS-cGAS expression level independently of the type of promoter used. These results indicate that increasing the nuclear cGAS level in DCs results in innate immune activation.
To estimate the activity of nuclear cGAS, we reconstituted 293FT cells that are devoid of endogenous cGAS (Gentili et al., 2015). Similar to HeLa cells, stable transduction of cGAS in cycling cGAS-deficient 293FT cells resulted through mitosis in a mixture of cells with either mostly cytoplasmic cGAS, mostly nuclear cGAS, or both (Figures 3A and S3A). We also reconstituted 293FT with NLS-cGAS, which showed exclusive nuclear localization of the sensor (Figures 3A and S3A). We measured cellular cGAMP production using a bioassay (Woodward et al., 2010) (Figure S3B). Despite the absence of transfected exogenous DNA, cGAMP was produced endogenously in both stable cGAS- and NLS-cGAS-expressing cells, as measured by cGAMP bioassay (Figures 3B and 3D) or cGAMP ELISA (Figure 3E). The level of cGAMP produced was similar between cGAS and NLS-cGAS, suggesting that the bulk of cGAMP production by stable cGAS expression was the result of the nuclear pool and not the cytoplasmic pool of the protein. Further supplementing cells with exogenous DNA by the transfection of herring testis DNA (HT-DNA) increased cGAMP production in cGAS- and NLS-cGAS-expressing cells by 235- and 500-fold, respectively (Figures 3C and 3D). Diploid human cells contain 7 pg of nuclear DNA per cell, while the maximum amount of transfected HT-DNA was 2.5 pg per cell. Therefore, the amount of nuclear DNA exceeded the amount of HT-DNA and was not the limiting factor for cGAS activation. We next measured cGAMP concentration in nuclear and cytoplasmic fractions of non-cycling DCs after the expression of GFP-cGAS or GFP-NLS-cGAS (Figure 2B). While the amount of cytosolic cGAMP was similar for GFP-cGAS and GFP-NLS-cGAS, nuclear cGAMP was more abundant for GFP-NLS-cGAS than GFP-cGAS (Figures 3F and 3G). We concluded that nuclear-localized cGAS is enzymatically active and limited by at least 200-fold compared to its activity in the response to transfected DNA.
Figure 3.

Nuclear Localization of cGAS Results in Limited cGAMP Production
(A) Immunofluorescence staining of DAPI (blue) and cGAS (red) in cycling 293FT cells stably transduced with control (empty vector [EV]) (top), cGAS (center), or NLS-cGAS (bottom) lentivectors in pTRIP-CMV. Scale bars, 10 μm.
(B) cGAMP quantification by cGAMP bioassay in extracts of cells described in (A). Means and SEMs of n = 3 independent experiments. Dilutions are 3-fold.
(C) cGAMP quantification in extracts of described in (A) that were stimulated overnight with 1 μg/mL HT-DNA. cGAMP was quantified as in (B). Means and SEMs of n = 3 independent experiments. Dilutions are 3-fold.
(D) cGAMP quantification relative to a cGAMP synthetic standard based on effective concentration 50 (EC50) of the cGAMP bioassay curves. Means and SEMs of n = 3 independent experiments. One-sample t test.
(E) cGAMP concentrations in cells as in (A) measured by cGAMP ELISA. Means and SEMs of n = 3 independent experiments. Gray dashed line indicates lower limit of detection; bar shows geometric mean. One-way ANOVA with post hoc Tukey test on log-transformed data.
(F) Expression of GFP-FLAG-cGAS, GFP-NLS-FLAG-cGAS, tubulin, calnexin, and lamin A/C in nuclear (N) and cytoplasmic (C) fractions of DCs transduced with the GFP-NLS or corresponding cGAS lentivectors with the SFFV promoter (representative of n = 5 independent donors). Reduced material for GFP-FLAG-cGAS samples was associated with activation-induced cell death.
(G) cGAMP concentrations in cytoplasmic and nuclear fractions of DCs as in (F), measured by cGAMP ELISA. Gray dashed line indicates lower limit of detection. Means and SEMs of n = 5 independent donors. Bar shows geometric mean. One-way ANOVA with post hoc Tukey test on log-transformed data.
∗p < 0.05, ∗∗p < 0.001, ns, not significant. See also Figure S3.
Next, we asked whether the nuclear entry of cGAS through mechanical nuclear envelope ruptures (Raab et al., 2016), rather than NLS, could similarly lead to the activation of the sensor. We used a microfabricated cell confiner to control the extent of nuclear envelope rupture events in cells (Figure 4A) (Le Berre et al., 2014, Raab et al., 2016). We also generated a reporter cell line to simultaneously visualize nuclear envelope rupture and STING-induced IRF3 nuclear translocation at the single-cell level by live video microscopy (Figure 4B). We used HeLa cells that express a functional endogenous cGAS (Gentili et al., 2015) to activate the STING reporter in response to DNA and monitored nuclear envelope ruptures by assessing the localization of a catalytically inactive cGAS (Raab et al., 2016). At steady state, cGAS localized in both the nucleus and the cytoplasm of HeLa cells, while GFP-IRF3 was exclusively cytosolic (Figure 4C; Video S5). Upon HT-DNA transfection, cGAS localized to the transfected DNA and IRF3 translocated to the nucleus, confirming the functionality of the single-cell assay (Figure 4C; Video S5). Confinement at a 3-μm height induced multiple nuclear envelope rupture events that increased with time, as revealed by cGAS accumulation on the nuclear DNA (Video S6). Despite multiple nuclear envelope ruptures that recruited cytoplasmic cGAS in the nucleus for 16 h (Raab et al., 2016), no GFP-IRF3 translocation event was observed (Figures 4D and 4E; Video S6). In contrast, when cells were confined and simultaneously transfected with HT-DNA, IRF3 nuclear translocation was rescued, thus excluding the possibilities that cell confinement interfered with the signaling pathway or that endogenous cGAS protein was in limiting amounts (Figures 4D, 4F, and 4G; Videos S7 and S8). Moreover, catalytically inactive GFP-NLS-cGAS did not inhibit the innate immune activation of DCs in response to HIV-1 or HIV-2 infection, a process that requires nuclear cGAS (Lahaye et al., 2018), or to HT-DNA (Figures 4H and 4I). Thus, catalytically inactive cGAS was not likely to compete with endogenous cGAS following nuclear envelope rupture. We conclude that in contrast to the NLS-mediated entry of overexpressed cGAS, the entry of endogenous cGAS through mechanical nuclear envelope rupture is not sufficient to activate STING.
Figure 4.

Confinement-Induced Nuclear Envelope Rupture Does Not Activate the cGAS-STING-IRF3 Axis
(A) Scheme of the cell confiner.
(B) Immunoblot of cGAS, STING, and vinculin in HeLa cells and HeLa cells transduced with mCherry-cGAS E225A/D227A, BFP-2A-STING, and GFP-IRF3 (HeLa STING).
(C) Sequential images of HeLa STING transfected with 4 μg/mL HT-DNA. Transfection was performed at time = 0 min. Binding of mCherry-cGAS E225A/D227A to the transfected DNA is shown at time = 100 min and accumulates over time. Formation of GFP-IRF3 foci and vesicles in the cytoplasm are shown at time = 150 min. GFP-IRF3 translocation peaked at time = 165 min. One representative cell for n = 2 independent experiments. Scale bars, 10 μm.
(D) Quantification of cells showing GFP-IRF3 nuclear translocation after confinement, confinement and transfection with HT-DNA, or only transfection with HT-DNA. Cycling HeLa cells, which express endogenous cGAS, were stably transduced as in (B) One-way ANOVA with post hoc Tukey test; ns, not significant; ∗∗∗∗p < 0.0001; data pooled from 3 independent experiments.
(E) Sequential images of HeLa cells stably transduced as in (B) immediately after confinement at 3 μm (time = 0 min; left) and after 6 h, 45 min from confinement (time = 345 min; right). Arrows indicate cells with NE ruptures as shown by bright mCherry-cGAS E225A/D227A foci in the nucleus. One representative field. Scale bars, 10 μm.
(F) Sequential images of HeLa cells stably transduced as in (B) subjected to 3 μm confinement and transfected with 4 μg/mL HT-DNA immediately after confinement at 3 μm (time = 0 min; left) and after 6 h, 45 min from confinement (time = 345 min; right). Arrows indicate cells with mCherry-cGAS spots in the cytoplasm and with consequent translocation of GFP-IRF3 in the nucleus. One representative field. Scale bars, 10 μm.
(G) Sequential images of HeLa STING cells transfected with 4 μg/mL HT-DNA, after transfection (time = 0 min), and 345 minutes later. For quantification in (D), only cells with bright GFP-IRF3 foci in the cytoplasm were quantified to exclude cells in which GFP-IRF3 translocate due to cGAMP transfer via gap junctions. Scale bars, 10 μm.
(H) Expression of GFP-NLS, GFP-FLAG-cGAS E225A/D227A (∗), GFP-NLS-FLAG-cGAS E225A/D227A (∗∗), endogenous cGAS (ˆ), and actin in DCs transduced with the corresponding lentivectors (representative of 2 independent donors).
(I) Expression of BFP, CD86, and SIGLEC1 in DCs as in (H) 48 h after infection with BFP-reporter HIV-1 and HIV-2 viruses and 24 h after transfection with HT-DNA or cGAMP (n = 2 independent donors).
HeLa cells expressing BFP2A-STING (not shown), GFP-IRF3 (green) and mCherry-cGAS E225A/D227A labeled with siR-DNA and transfected with 4μg/ml of HT-DNA. Transfection has been performed at time = 0 min. Scale bar is 10μm.
HeLa cells expressing BFP2A-STING (not shown), GFP-IRF3 (green) and mCherry-cGAS E225A/D227A confined at 3μm height. The cells were confined and the movie was started after compression. Foci of mCherry-cGAS at the nucleus identify NE ruptures. NE rupture events increase during time. Rapid flashes of GFP-IRF3 in and out of the nucleus correspond to events of NE rupture. Scale bar is 10μm.
HeLa cells expressing BFP2A-STING (not shown), GFP-IRF3 (green) and mCherry-cGAS E225A/D227A confined at 3μm height and transfected with 4μg/ml of HT-DNA. Rapid flashes of GFP-IRF3 in and out of the nucleus correspond to events of NE rupture. Cells with GFP-IRF3 translocation show bright GFP foci in the cytoplasm, followed by nuclear translocation. Scale bar is 10μm.
HeLa cells expressing BFP2A-STING (not shown), GFP-IRF3 (green) and mCherry-cGAS E225A/D227A transfected with 4μg/ml of HT-DNA. Cells were transfected and the movie was started. Cells with GFP-IRF3 translocation show bright GFP foci in the cytoplasm, followed by nuclear translocation. Scale bar is 10μm.
We noted that NLS-cGAS was distributed throughout the nucleus, while entry through nuclear envelope rupture produced small and peripheral-localized foci of nuclear cGAS. We next asked whether innate immune activation by overexpressed NLS-cGAS in the nucleus resulted from an association with spatially localized, specific DNA elements. While the cGAS enzymatic domain has been shown to bind DNA in a sequence-independent manner, we noticed that the GFP-NLS-cGAS signal in DCs showed patterns of GFP enrichment (Figure 5A). To understand whether NLS-cGAS could associate with specific chromatin regions, we performed chromatin immunoprecipitation sequencing (ChIP-seq) analysis on DCs transduced with GFP-NLS-cGAS using GFP-trap on the nuclear fraction (Figure 5B). cGAS peaks were distributed along all of the chromosomes and were preferentially located on a subset of annotated genomic elements (Figure S4A). To determine the enrichment of cGAS on genomic features, we computed the fraction of peaks falling within a given genomic element compared to the expected fraction based on the genomic coverage. cGAS peaks were mostly enriched on the satellite repeat class (Figure 5C), mainly on the ALR/α-satellites family within this class, and to a lesser extent on long interspersed nuclear elements (LINEs). α-Satellites are the main components of centromeres. cGAS peaks were broadly distributed across the genome, but peaks in close proximity between at least two donors were enriched on centromeres (Figure 5D). We computed peaks of CENP-A, the centromeric histone H3 variant, from previously reported ChIP-seq datasets of endogenous CENP-A, which maps to centromeres and pericentromeric heterochromatin (PHC) (Lacoste et al., 2014) (Figure 5D). cGAS peaks were associated with CENP-A peaks, as determined by the odds ratio statistic (Figure 5E). Pericentromeric heterochromatin is enriched in the histone 3 lysine 9 trimethylation (H3K9me3) mark (Müller and Almouzni, 2017). cGAS peaks were also associated with H3K9me3 peaks from the Encyclopedia of DNA Elements (ENCODE) database (Figure 5E). In contrast, cGAS peaks were not associated with the peaks of the histone 3 lysine 27 acetylation (H3K27Ac) mark of open chromatin (Figure 5E). To assert that centromeric DNA resulted from cGAS, we performed ChIP-seq of GFP-NLS-cGAS in two donors, using GFP-NLS as a control. cGAS-specific peaks were broadly distributed across the genome and were enriched on centromeres (Figure S4B). Centromeres are bound by CENP-B, which assembles on a 17-bp DNA consensus sequence within α-satellites, NTTCGNNNNANNCGGGN, called the CENP-B box (Muro et al., 1992). cGAS-specific peaks were enriched in the CENP-B box consensus sequence, but not in telomeric sequence TTAGGG repeats (Figure 5F). De novo motif enrichment analysis for cGAS-specific peaks revealed an enrichment in AATGG and CCATT sequences (Figure S4C), which was confirmed by enrichment analysis (Figure 5F). (AATGG)n ⋅ (CCATT)n repeat is a characteristic motif of satellite III DNA that is present at centromeres (Grady et al., 1992). cGAS-specific enrichment on satellite was also assessed directly from the sequencing reads. A global read enrichment of the satellite class was not detected in GFP-NLS-cGAS ChIP over input. We reasoned that cGAS may be associated with a subset of specific satellite occurrences. We compared the reads abundance of GFP-NLS-cGAS over GFP-NLS (to exclude any non-cGAS-specific binding) on individual annotated repeat elements in the genome. To account for the differences in the number of individual repeat elements between classes, we sorted the elements by enrichment and computed the fraction of occurrences within rank bins within each class. cGAS-specific enrichment scores could be detected in the repeat classes satellite, long terminal repeat (LTR), LINE, and simple_repeat, and the satellite class ranked the highest (Figure 5G). To confirm cGAS enrichment on centromeres, we transduced DCs with GFP-NLS and GFP-NLS-cGAS and analyzed GFP intensity surrounding CENP-B protein foci (Figure S4D) relative to randomly selected nuclear foci. GFP-NLS-cGAS was significantly enriched at CENP-B foci as compared to free GFP-NLS (Figures 5H–5K). Therefore, NLS-cGAS in the nucleus of DCs is preferentially associated with centromeric DNA.
Figure 5.

Nuclear cGAS Associated with Centromeric Satellite DNA
(A) 3D projection of the nucleus of a DC expressing GFP-NLS-cGAS (green).
(B) Experimental scheme for ChIP-seq of GFP-NLS-cGAS stably transduced in DCs.
(C) Annotation of the filtered peaks of the ChIP-seq on GFP-NLS-cGAS. Elements with <10 peaks are grayed out (1 donor representative of 3 independent donors).
(D) Circular plot showing the distribution of GFP-NLS-cGAS and of CENP-A peaks and localization of CENP-B box (consensus sequence) on the hg38 genome. The cGAS track represents the fold change (chip over input) of selected filtered peaks (162 regions) from the 3 donors. The CENP-A track represents the density of CENP-A intersection peaks (5,977 regions) computed on windows of size 107 across the genome. The CENP-B box track reports on the x axis the genomic position of the region (occurrence of CENP-B box consensus sequence) and on the y axis the minimal distance (log10 transformed) of the region to its two neighboring regions.
(E) Association of GFP-NLS-cGAS peaks with public H3K27Ac peaks from GM12878 cells, H3K9me3 peaks from peripheral blood mononuclear cells (PBMCs), and endogenous CENP-A peaks from HeLa S3 cells. Filtered GFP-NLS-cGAS peaks for donor 1 are used (404 peaks, 1,545,600 bp) (representative of 3 independent donors).
(F) Sequence enrichment in cGAS-specific peaks from GFP-NLS-cGAS ChIP-seq over GFP-NLS ChIP-seq filtered peaks (intersection of peaks from two independent donors). Three motifs were assessed: satellite III DNA motif repeats, [GGAAT]n > 3; CENP-B box consensus sequence, NTTCGNNNNANNCGGGN; and telomeric repeats, [TTAGGG]n > 1.
(G) cGAS-specific read enrichment on repeats. A repeat occurrence is considered if the read count per million (cpm) is ≥2 in any sample. Repeats are grouped into n = 10 bins according to the ChIP read enrichment over GFP-NLS. For each repeat class R, the fraction of occurrences within the first i bins, corresponding to the top (100/i)% ranks, is shown as a gradient from white to black. Only repeat classes with at least 10 read occurrences in the genome and that pass the cpm cutoff are considered and sorted from left to right by decreasing number of occurrences in the top 50% (1 donor representative of n = 2 independent donors).
(H) DC stably transduced with GFP-NLS lentivector in pTRIP-SFFV and stained for CENP-B. (Left) Z-projection of CENP-B (white) with nuclear mask (yellow) and (right) orthogonal projections (single confocal plane) of CENP-B (red) and GFP-NLS (green). Scale bar, 2 μm.
(I) Quantification of GFP intensity in CENP-B foci or random regions in the nucleus, normalized over mean nuclear GFP intensity, in cells transduced as in (H); n ≥ 140 foci or random regions in 7 independent cells. Each dot represents a single CENP-B focus. Means and SDs are represented. One donor representative of n = 4 donors in 2 independent experiments. Student’s t test.
(J) DC stably transduced with GFP-NLS-cGAS lentivector in pTRIP-SFFV and stained for CENP-B, shown as in (H). Scale bar, 2 μm.
(K) Quantification of GFP-NLS-cGAS intensity in CENP-B foci or random regions in the nucleus as in (I).
(L) CD86 and IFN-λ1 expression by DCs transfected with synthetic DNA repeats coding for the AATGG satellite motif, the corresponding shuffled sequence, or HT-DNA at the indicated DNA concentrations (solid lines, means; dotted lines, SEMs; independent donors: n = 9 for CD86, n = 7 for IFN-λ1; 2-way ANOVA with Tukey test on log-transformed data for IFN-λ1).
∗∗p < 0.01, ∗∗∗p < 0.001, ∗∗∗∗p < 0.0001. See also Figure S4.
cGAS is activated by DNA in a length-dependent manner (Andreeva et al., 2017, Luecke et al., 2017). To determine whether satellite DNA could preferentially activate cGAS, we transfected DCs with satellite III DNA AATGG repeats or shuffled sequences of increasing length. While innate immune activation of DCs was similar for both sequences with 12-repeat double-stranded DNA (dsDNA) (60 nt), a preferential response to the AATGG motif was detected with shortening of the repeats (Figures 5L and S4E). With the shortest 4-repeat dsDNA (20 nt), CD86, IFN-λ1, IFN-β, and IP-10 expression was significantly increased for the AATGG sequence compared to the shuffled sequence, and a similar trend was observed for SIGLEC1 expression. This suggests that cGAS may be preferentially activated by satellite DNA repeats of smaller length.
cGAS protein contains one positively charged N-terminal domain and two positively charged regions in the C-terminal catalytic domain that can interact with DNA (Sun et al., 2013, Tao et al., 2017). We wondered whether the centromeric association of cGAS was determined in the protein sequence. The C-terminal catalytic domain 161–522 of cGAS is sufficient to recapitulate DNA binding in a sequence-independent manner and in DNA-dependent cGAMP enzymatic activity (Civril et al., 2013, Sun et al., 2013). However, the function of the N-terminal domain 1–212 that also binds to DNA is not fully understood (Du and Chen, 2018, Sun et al., 2013, Tao et al., 2017). To understand whether the N-terminal domain could be a functional determinant in cGAS, we expressed the truncated domains in non-cycling human DCs. To our surprise, GFP-cGAS 161–522 showed spontaneous accumulation in the nucleus (Figure 6A), while GFP-cGAS 1–212 showed a cytosolic localization. We next examined the intracellular localization of the isolated domain 1–160. In contrast to GFP-cGAS 1–212, GFP-cGAS 1–160 spontaneously accumulated in the nucleus (Figure 6B), similar to GFP-NLS (Figure 2B). Thus, amino acids 161–212 in GFP-cGAS 1–212 are essential for cytosolic retention. We conclude that cGAS expressed in interphase is actively retained in the cytosol by domain 1–212, which counteracts two nuclear-localizing activities in domains 1–161 and 161–522.
Figure 6.

cGAS N-Terminal Domain Determines α-Satellites’ Association, Cytosolic Retention, and Activation in the Nucleus
(A) (Left) Schematics of cGAS deletions and (right) confocal microscopy of DCs transduced with human full-length catalytically inactive cGAS, the N-terminal part of cGAS (cGAS 1–212), or the C-terminal part (cGAS 161–522) fused to GFP in pTRIP-SFFV. GFP channel is shown in black on white. One representative donor of n = 4 donors in 2 independent experiments. Scale bars, 10 μm.
(B) (Left) Schematics of cGAS deletions and (right) confocal microscopy of DCs transduced with human full-length catalytically inactive cGAS or cGAS 1–160 in pTRIP-SFFV. GFP channel is shown in black on white. One representative donor of n = 4 donors in 2 independent experiments. Scale bars, 10 μm.
(C) GFP, CD86, and SIGLEC1 expression in DCs after transduction with a GFP-NLS, GFP-NLS-cGAS, GFP-cGAS 161–522, or GFP-NLS-cGAS 161–522 lentivector in pTRIP-SFFV in the presence or absence of Vpx. One representative donor of n = 6 donors in 3 independent experiments.
(D) CD86 and SIGLEC1 expression in DCs transduced as in (D); n = 6 donors in 3 independent experiments. One-way ANOVA with post hoc Tukey test.
(E) Confocal microscopy of Cgas−/− mouse bone marrow-derived DCs transduced with GFP-NLS, GFP-cGAS, GFP-NLS-cGAS, GFP-cGAS 1–160, or GFP-cGAS 161–522 in pTRIP-SFFV lentivectors. GFP channel is shown in black on white. One representative mouse of n = 2. Scale bars, 10 μm.
(F) Expression of Ifit1 in Cgas−/− mouse bone marrow-derived DCs transduced with GFP, GFP-NLS, GFP-cGAS, GFP-NLS-cGAS, GFP-cGAS 1–160, or GFP-cGAS 161–522 in pTRIP-SFFV lentivectors, untreated or treated with reverse transcriptase inhibitors (AZT + NVP) or transfected with cGAMP; n = 4 mice combined from 2 independent experiments. Bars represent geometric means. One-way ANOVA with Sidak test on log-transformed data.
(G) Quantification of GFP intensity in CENP-B foci in the nucleus, normalized over mean nuclear GFP intensity, in DCs transduced with GFP-NLS or the indicated GFP-cGAS lentivectors, in pTRIP-SFFV; n ≥ 140 foci per construct were quantified in 7 or 8 independent cells per construct. Each dot represents a single CENP-B focus. Means and SDs are represented. One representative donor of n = 4 donors in 2 independent experiments. One-way ANOVA with post hoc Tukey test.
∗∗∗p < 0.001, ∗∗∗∗p < 0.0001, ns, non-significant. See also Figure S5.
Activation of DCs was lost upon the deletion of domain 1–160 in cGAS, despite its nuclear localization and an intact catalytic site (Figures 6C, 6D, and S5A) and its response to transfected cytosolic DNA in a STING-dependent reporter assay (Figures S5B and S5C). Adding the NLS to GFP-cGAS 161–522 did not rescue DC activation, indicating that it was not due to suboptimal accumulation in the nucleus (Figures 6C, 6D, and S5A). Human DCs express endogenous cGAS. To confirm the results in the absence of endogenous cGAS, we transduced Cgas−/− mouse bone marrow-derived DCs with GFP, GFP-NLS, GFP-cGAS, GFP-NLS-cGAS, GFP-cGAS 1–160, or GFP-cGAS 161–522 lentivectors (Figure S5D). GFP-cGAS was transduced at low levels and localized in the cytoplasm (Figures 6E and S5D). GFP-NLS-cGAS and GFP-cGAS 1–160 were localized in the nucleus, with some detection in the cytoplasm, and GFP-cGAS 161–522 was exclusively detected in the nucleus (Figure 6E). Only GFP-cGAS and GFP-NLS-cGAS induced the upregulation of the mouse ISGs Ifit1, Ifit2, and Oas1 (Figures 6F and S5E). ISG induction by GFP-NLS-cGAS was lost in the presence of reverse transcriptase inhibitors that inhibited lentiviral transduction, showing that it resulted from vector expression and excluding an effect due to cGAMP transfer. In contrast, ISG induction by GFP-cGAS was maintained with the inhibitors, which is indicative of ISG induction resulting from cGAMP transfer by the lentivector. We hypothesized that domain 1–160 may determine the association of nuclear cGAS with centromeres. cGAS 161–522 had a reduced association of cGAS with CENP-B foci (Figures 6G and S5F), despite its nuclear localization and irrespective of an ectopic NLS. Catalytic mutations in full-length NLS-cGAS had no impact on the association with CENP-B foci. These results show that once cGAS is in the nucleus, the N-terminal domain 1–160 is required for association with centromeric DNA and activation of the sensor.
Finally, we sought to determine whether centromere association also applied to endogenous cGAS. First, we stained endogenous cGAS on metaphase spread chromosomes in a cycling human cell line. CENP proteins remained associated with centromeres in cycling cells (Dunleavy et al., 2005). Staining of endogenous cGAS revealed dispersed cGAS foci across chromosomes, including telomeres and centromeres (Figure 7A). On centromeres, cGAS foci were enriched between pairs of CENP-A and anti-centromere antibodies (ACAs, a mix of CENP-A/B/C) foci (Figures 7A and 7B), where centromeric DNA is located and stained also by ACAs (Dunleavy et al., 2005). cGAS was detectable on all of the centromeres examined, but the intensity of cGAS staining was variable between centromeres (Figure 7C). Second, we examined the DNA associated with endogenous cGAS in the nucleus. Bone marrow-derived macrophages have a constitutive (or tonic) expression of ISG expression that requires cGAS (Schoggins et al., 2014). Similar to macrophages, we found that Ifit1, Ifit2, and Oas1a were less expressed in bone marrow-derived DCs derived from Cgas−/− mice when compared to WTs that have a pool of nuclear cGAS (Figures 1D and 7D). To identify the DNA associated with endogenous nuclear cGAS in DCs, we generated a GFP-cGAS knockin mouse (CgasKI/KI) and performed ChIP-seq on CgasKI/KI bone marrow-derived DCs (Figures 7E and 7F). Endogenous cGAS peaks computed on the mouse genome were mostly enriched on satellite sequences and, to a lesser extent, on LINE elements (Figure 7G). Satellites were the most enriched category of genomic features in both human DCs overexpressing GFP-NLS-cGAS and mouse DCs expressing endogenous GFP-cGAS (Figure 7H). In contrast to human centromeres, mouse centromeres are telocentric and poorly mapped in the reference genome. In particular, minor satellites, which constitute mouse centromeres, are not annotated on mm10. We mapped the reads that failed to map to the mouse genome to a database of repetitive DNA (Figure 7I). Endogenous GFP-cGAS reads were again enriched on satellite DNA, and in particular mostly enriched on minor satellites (SATMINs) that are found on centromeres, as compared to major satellites (GSAT_MMs) that are found on pericentromeres (Kipling et al., 1991) (Figure 7I). We conclude that endogenous cGAS in the nucleus is preferentially associated with centromeric satellite DNA.
Figure 7.

Endogenous cGAS Associates with Centromeres
(A) Representative immunofluorescence images of a metaphase spread of cycling U2OS cells showing endogenous cGAS enrichment at the inner centromere. CENP-A marks the centromere position. Yellow arrows point to cGAS localization at an inner centromere. Scale bar, 5 μm.
(B) Top left: magnification of a centromere as in (A) showing cGAS enrichment between two CENP-A foci. Top right: schematic of the expected CENP-A and ACA localization at the inner kinetochore and at the inner kinetochore and centromere, respectively. Bottom: normalized mean of the fluorescence intensity scan lines of ACA, CENP-A, and cGAS along the centromeres. Error bars represent the SEMs of 36 centromeres in 1 cell (representative of 2 independent experiments).
(C) Heatmaps of ACA, CENP-A, and cGAS intensities for individual chromosomes as in (B) after distance normalization (n = 22 chromosomes, representative of 2 independent experiments).
(D) Baseline expression of the indicated ISGs (Ifit1, Ifit2, Oas1a) in bone marrow-derived DCs from Cgas−/− mice or WT littermates. Bars represent means and error bars are SEMs. Each dot represents an individual mouse; n = 6 mice per genotype combined from 3 experiments; 1-way ANOVA with post hoc Tukey test; ∗∗∗∗p < 0.0001.
(E) Overview of the GFP-cGAS knockin locus.
(F) Experimental scheme for ChIP-seq of GFP-cGAS mouse DCs from GFP-cGASKI/KI mice.
(G) Annotation of the significant peaks of the ChIP-seq on CgasKI/KI mice DCs over input. Elements with <10 peaks are grayed out.
(H) Annotation of the significant peaks of endogenous GFP-cGAS over input in mouse DCs (peak intersection of replicates 1 and 2) compared to significant peaks of overexpressed GFP-NLS-cGAS over input in human DCs (donor 1). Elements with <10 peaks are not included.
(I) ChIP-seq read enrichment on repeats; CgasKI/KI over input in mouse DCs. SATMIN, mouse minor satellite DNA; GSAT_MM, mouse γ-satellite repetitive sequence; IMPB_01, consensus of repeated region of mouse chromosome 6; SQR1_MM, SQR2_MM, SQR4_MM, mouse simple repetitive DNA (sqr family); ZP3AR, satellite from Muridae.
(J) Working model of cGAS expression in the cytoplasm in interphase, followed by localization to the nucleus as a result of mitosis.
Discussion
We find that the nuclear pool of cGAS is preferentially associated with centromeric DNA. We provided four distinct pieces of evidence that support this finding. First, ChIP-seq of NLS-GFP-cGAS in human DCs demonstrated a specific enrichment on satellite DNA, using either input DNA or NLS-GFP as controls. Second, the immunofluorescence of NLS-GFP-cGAS showed a specific overlap with CENP-B foci. Third, endogenous cGAS was directly observed on the centromeres of metaphase chromosomes. Fourth, ChIP-seq of endogenous murine GFP-cGAS showed that the association is conserved in mice.
We also show that the N-terminal domain of cGAS, which is dispensable for the catalytic activity of the recombinant protein and the response to transfected DNA, demonstrates distinct activities according to cGAS localization. When cGAS is cytosolic in interphase, N-terminal domain 1–212 encodes a dominant cytosolic retention activity. When this domain is disrupted in the isolated cGAS fragments 1–160 and 161–522, the presence of nuclear-localization signals is revealed in both fragments. Of note, domain 1–212 does not contain the recently described phospho-Y215 that was suggested to retain cGAS in the cytosol (Liu et al., 2018). When cGAS is nuclear, domain 1–161 is required for association with centromeric DNA and for innate immune activation by the nuclear-localized sensor. The N-terminal domain of cGAS also enhances the enzymatic activity of the sensor in response to short DNA by promoting liquid phase separation (Du and Chen, 2018). Whether this enhancement is functionally linked to subcellular localization remains to be determined. The N-terminal domain of cGAS is also highly variable between species (Wu et al., 2014). The lack of conservation of the N-terminal domain of cGAS could correspond to a functional adaptation for centromeric DNA sequences that are rapidly evolving in eukaryotes (Henikoff et al., 2001). Hence, cGAS could have been tuned by evolution to limit activation by self-DNA in the nucleus at steady state, presumably to minimize the risk of auto-inflammation and auto-immunity, while maintaining responsiveness to DNA in the cytosol or to specific nuclear DNA features such as centromeres via its N-terminal. In accordance with this hypothesis, we find that transfected four-repeat satellite DNA fragments induce a stronger cellular innate immune activation compared to shuffled sequence, and this difference is lost with increasing numbers of repeats. Since purified cGAS is not active in response to short synthetic dsDNA fragments (Andreeva et al., 2017), cellular factors to be defined may favor the response to short satellite DNA repeats. In addition, we detected dispersed cGAS ChIP-seq peaks and cGAS foci along chromosomes, an enrichment on LINE elements, and a significant association of human cGAS with H3K9me3, a mark that is not directly associated with CENP-A (Lacoste et al., 2014). We also observed the association of endogenous cGAS with telomeres of chromosomes from metaphase spread, which may be the result of the preferential association of cGAS with perinuclear chromatin in prometaphase (Figure 1G). We did not detect any enrichment of telomeric DNA repeats in cGAS peaks by ChIP-seq of non-cycling DCs, but telomere sequences are missing in the reference genome. These findings require further study, and we speculate that additional types of chromosomal DNA contribute to the regulation of nuclear cGAS activity. We recently showed that DNA in the form of purified cellular nucleosomes is a poor substrate for the enzymatic activation of cGAS (Lahaye et al., 2018). It will be important to develop assays to determine the contribution of DNA sequences and chromatin proteins in regulating cGAS enzymatic activity for centromeric and non-centromeric DNA.
Recent studies have reported that in addition to its localization in the cytosol (Sun et al., 2013), endogenous cGAS is present in the nucleus of primary cells, immortalized cell lines, or cancer cells (Dou et al., 2017, Lahaye et al., 2018, Mackenzie et al., 2017, Orzalli et al., 2015, Xia et al., 2018). We find that cGAS accumulates in the cytoplasm during interphase and that its nuclear localization can result from nuclear breakdown in mitosis or nuclear envelope rupture in interphase (Figure 7J), which is in agreement with other studies (Denais et al., 2016, Dou et al., 2017, Harding et al., 2017, Mackenzie et al., 2017, Raab et al., 2016, Yang et al., 2017). The cellular damage that produces cytoplasmic DNA fragments or micronuclei results in cytoplasmic foci with a dense accumulation of cGAS, which may overshadow the localization of the remaining cGAS pool in control cells (Dou et al., 2017, Glück et al., 2017, Harding et al., 2017, Mackenzie et al., 2017). Since monocyte-derived DCs do not divide, our results indicate that endogenous cGAS is maintained in the nucleus for several days. This could result from a sustained retention of endogenous cGAS in the nucleus, or alternatively from the replenishment of nuclear cGAS during interphase. The half-life of nuclear cGAS may also vary as a function of cell culture conditions (Yang et al., 2017).
We find that nuclear-localized cGAS functionally upregulates cellular innate immune responses. Given that GFP-NLS-cGAS protein and the majority of cellular DNA are present in the nucleus over the cytosol, our data support the notion that nuclear cGAS produces cGAMP in the nucleus, although this conclusion remains limited by the use of an endpoint assay. The diffusion or transport of nuclear cGAMP through nuclear pores would result in the activation of STING, which is exclusively cytoplasmic in DCs and macrophages (Lahaye et al., 2018). In the case of GFP-cGAS in DCs, cGAMP was more abundant in the cytosolic fraction, raising the interesting possibility that cGAMP does not freely move across the nuclear pores. Alternatively, we do not exclude that a fraction of cytosolic cGAMP detected in the experiment originated from cGAMP contained in the lentiviral particles that were used for DC transduction.
Our data show that nuclear cGAS activity is restrained by at least four mechanisms. First, overexpressing nuclear-localized cGAS activates innate immunity in DCs, suggesting that the endogenous level of expression of the sensor in DCs is tuned to avoid spontaneous activation. Second, we estimated that nuclear cGAS is at least 200-fold less active toward endogenous nuclear DNA as compared to exogenous DNA transfection. This suggests that enzymatic activation in the nucleus is limited by a yet-to-be-elucidated mechanism. A recent report showed that Zn2+ concentration regulates cGAS activity (Du and Chen, 2018). Free Zn2+ is not available in the nucleus because it is bound to proteins (Lu et al., 2016), possibly limiting cGAS activity in the nucleus. The circular RNA cia-cGAS was also recently reported to inhibit nuclear cGAS activity in long-term hematopoietic stem cells (Xia et al., 2018). Although cia-cGAS is not expressed in other immune cells, including DCs, it remains possible that another circular RNA inhibits nuclear cGAS in DCs. Third, the N-terminal domain of cGAS is crucial to retain the sensor in the cytosol until a nuclear envelope rupture or nuclear envelope breakdown occurs. Fourth, where cGAS interacts with nuclear DNA appears to determine cGAS activation: while cGAS is activated after nuclear entry resulting from mitosis or association with a nuclear-localization signal when the sensor is overexpressed, we could not detect endogenous cGAS activation after entry through interphasic nuclear envelope rupture events. In bone marrow-derived DCs, our results do not allow us to determine whether it is the nuclear pool of endogenous cGAS, which we show is associated with self-DNA, or the cytosolic pool of endogenous cGAS, whose association with DNA is unknown, that is responsible for tonic ISG expression, but the vast excess of nuclear DNA over cytosolic DNA at steady state favors the former hypothesis.
Our work provides a basis to determine to what extent the roles of cGAS in anti-microbial defense, anti-tumoral immunity, auto-immunity, senescence, and DNA damage response, currently attributed to activation by cytosolic DNA (Chen et al., 2016, Glück et al., 2017, Harding et al., 2017, Yang et al., 2017), implicate the nuclear pool of cGAS. In addition, nuclear cGAS may be endowed with nuclear-specific functions that future work may unveil.
STAR★Methods
Key Resources Table
| REAGENT or RESOURCE | SOURCE | IDENTIFIER |
|---|---|---|
| Antibodies | ||
| CD86 (Clone IT2.2) | Thermo Fisher Scientific | Cat#12-0869-42, |
| RRID: AB_10732345 | ||
| SIGLEC1 (Clone 7-239) | Miltenyi Biotec | Cat# 130-098-645, |
| RRID: AB_265554 | ||
| CD11c (Clone N418) | eBioscience | Cat# 25-0114-82 |
| RRID: AB_469590 | ||
| CD11b (Clone M1/70) | eBioscience | Cat# 45-0112-82 |
| RRID: AB_953558 | ||
| Actin (Clone C4) | Millipore | Cat# MAB1501, |
| RRID: AB_2223041 | ||
| Vinculin (Clone hVIN-1) | SIGMA | Cat# V9264, |
| RRID: AB_10603627 | ||
| Tubulin (Clone DM1A) | eBioscience | Cat# 14-4502-82, |
| RRID: AB_1210456 | ||
| Lamin A/C (Clone H-110) | Santa Cruz Biotechnology | Cat# sc-20681, |
| RRID: AB_648154 | ||
| Lamin B1 (Polyclonal) | abcam | Cat# ab16048, |
| RRID: AB_443298 | ||
| STING/TMEM173 (Clone 723505) | R&D Systems | Cat# MAB7169 |
| RRID: AB_10971940 | ||
| Sting (Clone D2P2F) | Cell Signaling Technology | Cat# 13647, |
| RRID: AB_2732796 | ||
| cGAS (Clone D1D3G) | Cell Signaling Technology | Cat# 15102, |
| RRID: AB_2732795 | ||
| cGAS (Clone D3O8O) - Mouse Specific | Cell Signaling Technology | Cat# 31659 |
| Calnexin | Enzo Life Science | Cat# ADI-SPA-860-F, |
| RRID: AB_11178981 | ||
| GFP Antibody Dylight 488 Conjugated Pre-Adsorbed (Polyclonal) | Rockland | Cat# 600-141-215 |
| RRID: AB_1961516 | ||
| CENP-B (Clone C-10) | Santa Cruz Biotechnology | Cat# sc-376392 |
| RRID: AB_11151020 | ||
| CENP-A (Clone 3-19) | Enzo | Cat# ADI-KAM-CC006-E |
| RRID: AB_2038993 | ||
| ACA | Antibodies Incorporated | Cat# 15-234-0001 |
| RRID: AB_2687472 | ||
| Normal Rabbit IgG Isotype | Thermo Fisher Scientific | Cat# 10500C |
| RRID: AB_2532981 | ||
| F(ab’)2-Goat α-Rabbit IgG (H+L) Alexa-647 | Thermo Fisher Scientific | Cat# A-21246 |
| RRID: AB_2535814 | ||
| F(ab’)2-Goat anti-Mouse IgG (H+L) Cross-Adsorbed Secondary Antibody, Alexa Fluor, 555 | Thermo Fisher Scientific | Cat# A-21425 |
| RRID: AB_2535846 | ||
| Peroxidase AffiniPure Goat Anti-Rabbit IgG (H+L) | Jackson Immunoresearch | Cat# 111-035-144 |
| RRID: AB_2307391 | ||
| Peroxidase AffiniPure Goat Anti-Mouse IgG (H+L) | Jackson Immunoresearch | Cat# 115-035-003 |
| RRID: AB_10015289 | ||
| AffiniPure Goat Anti-Mouse IgG, Fcγ fragment specific | Jackson Immunoresearch | Cat# 115-005-008 |
| RRID: AB_2338449 | ||
| Donkey anti-goat IgG-HRP |
Santa Cruz Biotechnology |
Cat# sc-2020 |
| RRID: AB_631728 | ||
| Bacterial and Virus Strains | ||
| NL4-3 ΔvifΔvprΔvpuΔenvΔnef encoding GFP in nef | Manel et al., 2010 | HIV-1 GFP-reporter virus |
| ROD9 ΔenvΔnef encoding GFP in nef | Manel et al., 2010 | HIV-2 GFP-reporter virus |
| Biological Samples | ||
| Human Healthy blood donors for primary PBMCs and MDDCs | This manuscript | N/A |
| Bone Marrow from mice for BMDCs | This manuscript | N/A |
| Chemicals, Peptides, and Recombinant Proteins | ||
| Human IL-4 | Miltenyi Biotec | Cat# 130-093-922 |
| Human GM-CSF | Miltenyi Biotec | Cat# 130-093-867 |
| 2′3′cGAMP | Invivogen | Cat# tlrl-nacga23-02 |
| CAS: 1441190-66-4 | ||
| HT-DNA – Deoxyribonucleic acid sodium salt from herring testes | SIGMA | Cat# D6898 |
| CAS: 438545-06-3 | ||
| TransIT®-293 Transfection Reagent | Euromedex | Cat# MIR2706 |
| Invitrogen Lipofectamine 2000 Transfection Reagent | Thermo Fisher Scientific | Cat# 10696153 |
| Human IFN-alpha2a | Immunotools | Cat# 11343506 |
| Puromycin | Invivogen | Cat# ant-pr-1 |
| CAS: 58-58-2 | ||
| Protamine sulfate salt from salmon | SIGMA | Cat# P4020-1G |
| CAS: 53597-25-4 | ||
| Fetal bovine serum | Thermo Fisher Scientific | Cat# 10270-106 |
| Penicillin-Streptomycin | Thermo Fisher Scientific | Cat# 15140122 |
| PMA – Phorbol 12-myristate 13-acetate | SIGMA | Cat# P8139 |
| Ficoll-Paque PLUS | Dutscher | Cat# 17-1440-03 |
| Gentamicin (50mg/ml) | Thermo Fisher Scientific | Cat# 15750037 |
| HEPES (1M) | Thermo Fisher Scientific | Cat# 15630080 |
| DMEM, high glucose, GlutaMAX supplement | Thermo Fisher Scientific | Cat# 61965026 |
| RPMI 1640 Medium, GlutaMAX supplement | Thermo Fisher Scientific | Cat# 61870010 |
| IMDM | Lonza | Cat# 12-722F |
| cOmplete, EDTA-free, Protease inhibitor cocktails tablets | Roche | Cat# 11873580001 |
| Azidothymidine | SIGMA | Cat# A2169; |
| CAS: 30516-87-1; AZT | ||
| Nevirapine | SIGMA | Cat# SML0097; |
| CAS: 129618-40-2; NVP | ||
| SUPERSCRIPT III | Thermo Fisher Scientific | Cat# 18080044 |
| RNase A | Thermo Fisher Scientific | Cat# EN0531 |
| Poly-L-lysine solution | Sigma Aldrich | Cat# P8920-100ML |
| Saponin from quillaja bark | Sigma Aldrich | S7900-100G |
| Goat serum | Sigma Aldrich | Cat# G9023-10ML |
| Fluoromont G with DAPI | eBioscience | Cat# 00-4959-52 |
| Passive Lysis Buffer | Promega | Cat# E1941 |
| SiR-DNA | Tebu-Bio | Cat# SC007 |
| Etoposide |
SIGMA |
Cat# E1383-100MG |
| CAS: 33419-42-0 | ||
| Critical Commercial Assays | ||
| Purelink HiPure Plasmid Midiprep Kit | Thermo Fisher Scientific | Cat# K210015 |
| Nucleospin Gel and PCR Clean-Up kit | Macherey-Nagel | Cat# 740609.50 |
| CD14 MicroBead human | Milteny Biotec | Cat# 130-050-201 |
| LS columns | Milteny Biotec | Cat# 130-042-401 |
| Human IP-10 Flex Set | BD | Cat# 558280 |
| LEGENDplex Human Type 1/2/3 IFN Panel (5-plex) | Ozyme | Cat# BLE740396B |
| NucleoSpin RNA | Macherey-Nagel | Cat# 740955.50 |
| LightCycler480 SYBR Green I Master | Roche | Cat# 4887352001 |
| GFP-Trap®_MA | Chromotek | Cat# gtma-20 |
| Binding Control Magnetic Agarose Beads | Chromotek | Cat# bmab-20 |
| Qubit dsDNA HS Assay Kit | Thermo Fisher Scientific | Cat# Q32854 |
| SPRIselect | Beckman Coulter | B23318 |
| 2′3′-cGAMP ELISA kit | Interchim | Cat# 501700 |
| Deposited Data | ||
| Raw and analyzed data | This manuscript | NCBI GEO: GSE125475 |
| WT MNase input (replicate 1); Homo sapiens; ChIP-Seq | Lacoste et al., 2014 | NCBI SRA: SRR633612 |
| WT MNase input (replicate 2); Homo sapiens; ChIP-Seq | Lacoste et al., 2014 | NCBI SRA: SRR633613 |
| WT CenH3 ChIP-seq (replicate 1); Homo sapiens; ChIP-Seq | Lacoste et al., 2014 | NCBI SRA: SRR633614 |
| WT CenH3 ChIP-seq (replicate 2); Homo sapiens; ChIP-Seq | Lacoste et al., 2014 | NCBI SRA: SRR633615 |
| Peaks for H3K27ac in GM12878 cells | ENCODE consortium | NCBI GEO: GSE29611 |
| Peaks for H3K9me3 in PBMC | ENCODE consortium | NCBI GEO: GSE31755 |
| RepeatMasker annotation of hg38 – version rm405, db20140131 | ISB | http://www.repeatmasker.org/genomes/hg38/RepeatMasker-rm405-db20140131 |
| RepBase version 20140131 – mouse-specific repeats | GIRI | https://www.girinst.org/repbase/ |
| Number of unique 50-mers in hg38 | BioCore, NTNU | https://github.com/biocore-ntnu/epic/blob/master/epic/scripts/effective_sizes/hg38_50.txt |
| Experimental Models: Cell Lines | ||
| 293FT | Thermo Fisher Scientific | Cat# R70007 |
| RRID: CVCL_6911 | ||
| HeLa | Laboratory of Dan Littman, New York University | N/A |
| RRID: CVCL_0030 | ||
| HeLa H2B-mCherry | Laboratory of Mathieu Piel, IPGG Paris | N/A |
| THP-1 | ATCC | Cat# TIB-202 |
| RRID: CVCL_0006 | ||
| HL116 | Laboratory of Dan Littman, New York University | N/A |
| RRID: CVCL_RW47 | ||
| U2OS |
Laboratory of David L. Spector. |
N/A |
| RRID: CVCL_0042 | ||
| Experimental Models: Organisms/Strains | ||
| C57BL/6J | Jackson Laboratory | Stock# 000664 |
| C57BL/6N | Jackson Laboratory | Stock# 005304 |
| C57BL/6J-Mb21d1tm1d(EUCOMM)Hmgu | Jackson Laboratory | Stock# 026554 |
| C57BL/6N-Mb21d1tm1Ciphe | This manuscript | N/A |
| Oligonucleotides | ||
| See Table S1 | N/A | |
| Recombinant DNA | ||
| pCMV-VSVG | Manel et al., 2010 | N/A |
| psPAX2 | Manel et al., 2010 | N/A |
| pSIV3+ | Manel et al., 2010 | N/A |
| pTRIP-CMV-Puro-2A | Gentili et al., 2015 | N/A |
| pTRIP-SFFV-EGFP-NLS | Raab et al., 2016 | N/A |
| pTRIP-SFFV-mTagBFP2-2A | Cerboni et al., 2017 | N/A |
| pFlap-DeltaU3-HLADRα-GFP | Theravectys | N/A |
| pFLAP-DeltaU3-HLADRα-inverted GFP | This manuscript | N/A |
| pTRIP-CMV-EGFP | This manuscript | N/A |
| pMSCV-Hygro | Clontech | Cat# 634401 |
| pTRIP-CMV-Puro-2A-cGAS | Gentili et al., 2015 | N/A |
| pTRIP-CMV-EGFP-FLAG-cGAS | Raab et al., 2016 | N/A |
| pTRIP-CMV-EGFP-FLAG-cGAS ΔK173-I220ΔH390-405 | This manuscript | N/A |
| pTRIP-SFFV-EGFP-FLAG-cGAS | This manuscript | N/A |
| pTRIP-SFFV-EGFP-NLS-FLAG-cGAS | This manuscript | N/A |
| pFLAP-DeltaU3-HLA-DRα-inverted GFP-FLAG-cGAS | This manuscript | N/A |
| pFLAP-DeltaU3-HLA-DRα-inverted GFP-NLS-FLAG-cGAS | This manuscript | N/A |
| pTRIP-CMV-EGFP-FLAG-cGAS E225A/D227A | Raab et al., 2016 | N/A |
| pTRIP-CMV-mCherry-FLAG-cGAS E225A/D227A | This manuscript | N/A |
| pTRIP-SFFV-EGFP-FLAG-cGAS E225A/D227A | Raab et al., 2016 | N/A |
| pTRIP-SFFV-EGFP-NLS-FLAG-cGAS E225A/D227A | This manuscript | N/A |
| pFLAP-DeltaU3-HLA-DRα-inverted GFP-FLAG-cGAS E225A/D227A | This manuscript | N/A |
| pTRIP-SFFV-EGFP-cGAS 1-212 | This manuscript | N/A |
| pTRIP-SFFV-EGFP-cGAS 1-160 | This manuscript | N/A |
| pTRIP-SFFV-EGFP-cGAS 161-522 | This manuscript | N/A |
| pTRIP-SFFV-EGFP-cGAS 161-522 E225A/D227A | This manuscript | N/A |
| pTRIP-SFFV-EGFP-NLS-cGAS 161-522 | This manuscript | N/A |
| pTRIP-SFFV-mTagBFP2-2A-STING | Cerboni et al., 2017 | N/A |
| pTRIP-CMV-EGFP-IRF3 | This manuscript | N/A |
| pMSCV-Hygro-STING | Gentili et al., 2015 | N/A |
| pTRIP-CMV-mCherry-53BP1 | This manuscript | N/A |
| Software and Algorithms | ||
| GraphPad Prism 7 | GraphPad | https://www.graphpad.com/ |
| Fiji | ImageJ | https://fiji.sc/ |
| FlowJo | Tree Star | https://www.flowjo.com |
| LEGENDplex Software – Version 8.0 | LEGENDplex | http://www.vigenetech.com/LEGENDplex7.htm |
| FCAP Array – Version 3.0.14.1993 | BD | http://www.bdbiosciences.com/us/applications/research/bead-based-immunoassays/analysis-software/fcap-array-software-v30/p/652099 |
| Image Lab software – Version 5.2.1 | BioRad | http://www.bio-rad.com/fr-fr/product/image-lab-software?ID=KRE6P5E8Z |
| MARS Data Analysis Software – Version 3.32 | BMG Labtech | https://www.bmglabtech.com/microplate-reader-software/ |
| Bowtie2 – version 2.2.9 | DOI: 10.1038/nmeth.1923 | http://bowtie-bio.sourceforge.net/bowtie2/ |
| Picard – version 1 | Broad Institute | https://broadinstitute.github.io/picard/ |
| SAMtools – version 1.3 | DOI:10.1093/bioinformatics/btp352 | http://samtools.sourceforge.net/ |
| BEDtools – version 2.27.1 | DOI:10.1093/bioinformatics/btq033 | https://bedtools.readthedocs.io/en/latest/ |
| GEMTools – version 1.7.1 | DOI:10.1038/nmeth.2221 | https://github.com/gemtools/gemtools |
| SICER – version 1.1 | DOI:10.1093/bioinformatics/btp340 | https://home.gwu.edu/∼wpeng/Software.htm |
| Bowtie – version 1.2 | DOI:10.1186/gb-2009-10-3-r25 | http://bowtie-bio.sourceforge.net/ |
| SeqPrep – version 1.2 | SeqPrep github repository | https://github.com/jstjohn/SeqPrep |
| HOMER – version 4.9 | DOI:10.1016/j.molcel.2010.05.004 | http://homer.ucsd.edu/homer/ |
| RSAT | DOI:10.1093/nar/gky317 | http://rsat.sb-roscoff.fr/ |
| Other | ||
Contact for Reagent and Resource Sharing
Further information and requests for reagents may be directed to and will be fulfilled by the Lead Contact, Nicolas Manel (nicolas.manel@curie.fr).
Experimental Model and Subject Details
Human subjects
Healthy individuals from Paris area donate venous blood to be used for research. Gender identity and age from anonymous healthy donors was not available. According to the 2016 activity report of EFS (French Blood Establishment), half of donors are under 40 years old, and consist of 52% females and 48% males. The use of EFS blood samples from anonymous donor was approved by the Institut National de la Santé et de la Recherche Médicale committee. EFS provides informed consent to blood donors.
Human Cell Lines
Cell lines are described in the Key Resources Table. Female cell lines included 293FT, HeLa and U2OS cells. Male cell lines included HL116, THP-1. Cell lines validation were performed by STR and POWERPLEX 16HS analysis for 293FT and HeLa cell lines. 293FT and HeLa cells were cultured in DMEM with Glutamax supplemented with 10% FBS (GIBCO) and Penicillin-Streptomicin (PenStrep; GIBCO). HeLa cells expressing H2B-mCherry were a kind gift of Matthieu Piel’s lab and were previously described (Raab et al., 2016). THP-1 cells were cultured in RPMI medium with Glutamax (GIBCO), 10% FBS (GIBCO) and PenStrep (GIBCO). HL-116 cells were cultured in DMEM medium with Glutamax (GIBCO), 10% FBS (GIBCO), PenStrep (GIBCO) supplemented with 1% HAT (GIBCO). U2OS cells were cultured in DMEM containing 10% tetracycline-free fetal bovine serum (Pan Biotech), 100 U/ml penicillin, 100 U/ml streptomycin, and 2 mM L-glutamine. Number of experimental replicates are indicated in the respective figure legends.
Primary Human Cells
CD14+ monocytes were isolated from peripheral adult human blood as previously described (Lahaye et al., 2013). Monocytes were cultured and differentiated in DCs (MDDCs) in RPMI medium with Glutamax, 10% FBS (GIBCO), PenStrep (GIBCO), 50μg/ml Gentamicin (GIBCO) and 0.01M HEPES (GIBCO) in presence of recombinant human 10ng/ml GM-CSF (Miltenyi) and 50ng/ml IL-4 (Miltenyi). Number of donors and experimental replicates are indicated in the respective figure legends.
Mice
All animal procedures were in accordance with the guidelines and regulations of the French Veterinary Department in an accredited animal facility. The animal protocol was approved by the Animal Ethical Committee of Paris Centre (C2EA-59). C57BL/6J-Mb21d1tm1d(EUCOMM)Hmgu (Cgas−/−) and C57BL/6J and C57BL/6N strains were obtained from The Jackson Laboratory. The GFP-cGAS knock-in is C57BL/6N-Mb21d1tm1Ciphe (GFP-cGASKI/KI) generated at the Centre d’Immunophénomique, Marseille, France. Age of mice used in experiments was 6-8 weeks (Cgas−/−) and 8-9 months (CgasKI/KI). Mice used in experiments were females. All mice in each experiment were littermates.
Mouse Bone Marrow Isolation and DCs Differentiation
Mouse bone marrow derived DCs were differentiated from bone marrow isolated from mouse tibiae. 20 million cells were seeded in gamma-irradiated heavy 14 cm dishes (Greiner Bio-One) in 20ml of BMDCs (bone marrow-derived DCs) medium composed by IMDM, 10% FBS, PenStrep (GIBCO), 50μM β-mercaptonethanol (GIBCO), and granulocyte-macrophage colony stimulating factor (50 ng/mL)-containing supernatant obtained from transfected J558 cells. Cells were split at day 4 and day 7 and harvested at day 10. At day 4 the supernatant was recovered, and the adherent cell were recovered by incubating the dishes in 6ml of PBS (GIBCO) containing 5mM EDTA (GIBCO). Cells were counted and reseeded in BMDCs medium at a concentration of 0.5 million cells per ml, 20ml per 14cm dish. At day 7 the culture supernatant was gently discarded and the cells were recovered by incubating the dishes in 6ml of PBS containing 5mM EDTA (GIBCO). Cells were counted and reseeded in BMDCs medium at a concentration of 0.5 million cells per ml, 20ml per 14cm dish. At day 10, the culture supernatant was gently discarded and semi-adherent cells were recovered by extensive flushing of the dishes with 10ml of pre-warmed BMDCs medium. The cells were counted and used for further applications. Number of mice and experimental replicates are indicated in the respective figure legend.
Method Details
Constructs
The plasmids pSIV3+, psPAX2, pCMV-VSV-G, pTRIP-CMV, pTRIP-SFFV were previously described (Gentili et al., 2015, Lahaye et al., 2013, Raab et al., 2016). pFlap-DeltaU3-HLA-DRα-GFP was obtained from Theravectys. The promoter HLA-DRα and the EGFP sequence were cloned in reverse orientation by PCR and digestion to obtain the backbone pFLAP-DeltaU3-HLA-DRα-inverted GFP. GFP-NLS was previously described (Raab et al., 2016). mTagBFP2 sequence was generated synthetically and was previously described (Gentili et al., 2015). mCherry was cloned by PCR from mCherry-BP1-2 pLPC-Puro, kind gift of Matthieu Piel’s lab. Human cGAS WT open reading frame was amplified by PCR from cDNA prepared from MDDCs. Human cGAS E225A/D227A was obtained by overlapping PCR mutagenesis. Human NLS-cGAS or NLS-cGAS E225A/D227A was obtained by addition of the SV40 NLS sequence (PKKKRKVEDP) at the N-terminal of cGAS by overlapping PCR. cGAS 1-212, 1-160, 161-522, 161-522 E225A/D227A, NLS-161-522, 22-522 E225A/D227A, 62-522 E225A/D227A, 94-522 E225A/D227A, 122-522 E225A/D227A were obtained by overlapping PCR. FLAG sequence (MDYKDDDDK) was added by overlapping PCR. cGAS ΔK173-I220ΔH390-405 was generated by deleting amino-acid regions K173-I220 and H390-C405 by overlapping PCR and was previously described (Gentili et al., 2015). Human cGAS WT or ΔK173-I220ΔH390-405 was cloned in pTRIP-CMV-Puro-2A or pTRIP-CMV or pTRIP-SFFV or pFLAP-DeltaU3-HLA-DRα-GFP inverted and in frame with EGFP to obtain pTRIP-CMV-Puro-2A-cGAS or pTRIP-CMV-EGFP-FLAG-cGAS or pTRIP-CMV-EGFP-FLAG-cGAS ΔK173-I220ΔH390-405 or pTRIP-SFFV-EGFP-FLAG-cGAS or pFLAP-DeltaU3-HLA-DRα-inverted GFP-FLAG-cGAS. Human cGAS E225A/D227A was cloned in pTRIP-CMV or pTRIP-SFFV or pFLAP-DeltaU3-HLA-DRα-GFP inverted in frame with EGFP or mCherry to obtain pTRIP-CMV-EGFP-FLAG-cGAS E225A/D227A or pTRIP-CMV-mCherry-FLAG-cGAS E225A/D227A or pTRIP-SFFV-EGFP-FLAG-cGAS E225A/D227A or pFLAP-DeltaU3-HLA-DRα-inverted GFP-FLAG-cGAS. Human NLS-cGAS or NLS-cGAS E225A/D227A were cloned in pTRIP-CMV-Puro-2A or pTRIP-SFFV or pFLAP-DeltaU3-HLA-DRα-inverted GFP in frame with EGFP to obtain pTRIP-CMV-Puro-2A-NLS-cGAS or pTRIP-SFFV-EGFP-NLS-FLAG-cGAS or pTRIP-SFFV-EGFP-NLS-FLAG-cGAS E225A/D227A or pFLAP-DeltaU3-HLA-DRα-inverted-GFP-NLS-FLAG-cGAS E225A/D227A. cGAS 1-160, 1-212, 161-522, 161-522 E225A/D227A, NLS-161-522, were cloned in pTRIP-SFFV in frame with EGFP. Human STING WT open reading frame was amplified by PCR from IMAGE clone 5762441 and the H232 residue was mutated to R232 by overlapping PCR mutagenesis and was previously described (Jeremiah et al., 2014). Human STING WT was cloned in pTRIP-SFFV-mTagBFP2-2A and was previously described (Cerboni et al., 2017). Human IRF3 WT open reading frame was amplified by PCR from plasmid obtained from David Levy and cloned in pTRIP-CMV in frame with EGFP. Human STING WT was cloned in pMSCV-Hygro (Clontech) to obtain pMSCV-Hygro-STING and was previously described (Gentili et al., 2015). pTRIP-CMV-mCherry-53BP1 (amino acids 1224-1716 for isoform 1) was cloned from mCherry-BP1-2 pLPC-Puro (AddGene #19835). The HIV-1 GFP-reporter virus was NL4-3 ΔvifΔvprΔvpuΔenvΔnef encoding GFP in nef and the HIV-2 GFP-reporter virus was ROD9 ΔenvΔnef encoding GFP in nef (Manel et al., 2010).
Lentiviral particles production in 293FT cells, transductions and infections
Lentiviral particles were produced as previously described from 293FT cells (Gentili et al., 2015). Briefly, lentiviral particles were produced by transfecting 1 μg of psPAX2 and 0.4 μg of pCMV-VSV-G together with 1.6 μg of a lentiviral vector plasmid per well of a 6-well plate. SIV-VLPs were produced by transfecting 2.6μg of pSIV3+ and 0.4μg of pCMV-VSV-G. HIV-1 and HIV-2 GFP-reporter viruses were produced by transfecting 2.6μg of HIV DNA and 0.4 μg of CMV-VSVG. Medium was changed after 12-14h to 3ml per well of RPMI medium with Glutamax, 10% FBS (GIBCO), PenStrep (GIBCO), 50μg/ml Gentamicin (GIBCO) and 0.01M HEPES (GIBCO). The supernatant was harvested 30-32h after medium changed and filtered over 0.45μm filters. Lentiviral particles were used fresh for transduction. HIV reporter viral supernatants were stored at −80°C.
For 293FT cells transduced with pTRIP-CMV-Puro-2A, pTRIP-CMV-Puro-2A-cGAS, pTRIP-CMV-NLS-FLAG-cGAS, 0.5 million cells were plated in a well of a 6w plate and transduced with 2ml of freshly produced lentivirus in presence of 8μg/ml of protamine (SIGMA). Cells were selected for one week with 2μg/ml of Puromycin (Invivogen). For HeLa cells transduced with pTRIP-SFFV-mTagBFP2-2A-STING WT, pTRIP-CMV-GFP-IRF3 and pTRIP-CMV-mCherry-FLAG-cGAS E225A/D227A, 0.5 million cells were plated in a well of a 6w plate and transduced with 1ml of each freshly produced lentivirus in presence of 8μg/ml of protamine. For HeLa cells expressing GFP-FLAG cGAS and GFP-FLAG-cGAS ΔK173-I220ΔH390-405, 0.5 million cells were plated in a well of a 6w plate and transduced with 2ml of either pTRIP-CMV-EGFP-FLAG-cGAS or pTRIP-CMV-EGFP-FLAG-cGAS ΔK173-I220ΔH390-405 freshly produced lentivirus in presence of 8μg/ml of protamine.
For human monocytes transduction 50,000 monocytes per well were seeded in each well of a 96 well plate in 100μl of medium and transduced with 100μl of freshly produced virus in presence or absence of 50μl of SIV-VLPs with protamine at 8μg/ml. For experiments with pFLAP-DeltaU3-HLA-DRα-inverted GFP vectors, plates were spinoculated at 1,200 g for 2 hours at 25°C. Cells were analyzed on a FACSVerse cytometer 4 days after transduction. For ChIP-seq experiments and microscopy experiments, 2 million monocytes per well were seeded in a 6 well plate and transduced with 2ml of freshly produced lentiviral particles and 2ml of SIV-VLPs in presence of 8μg/ml of protamine.
For MDDCs infected by HIV reporter viruses, 3 million monocytes per well were seeded in a 6 well plate and transduced with 3ml of freshly produced lentiviral particles and 3ml of SIV-VLPs in presence of 8μg/ml of protamine. Four days after transduction and MDDCs differentiation, cells were harvested, counted and resuspended in fresh media at a concentration of 1 to 0.5 million per ml with 8μg/ml protamine, GM-CSF and IL-4, and 100 μL was aliquoted in round-bottomed 96-well plates. For infection, 100 μL of media or dilutions of viral supernatants were added.
For BMDCs transduction, at day 4 of BMDCs differentiation, the supernatant and adherent cells were recovered, 50,000 cells per well were seeded in each well of a 96 U-bottom well plate in 100μl of medium and transduced with 100μl of freshly produced virus with protamine at 8μg/ml, in presence or absence of 25 μM Azidothymidine (AZT) with 10 μM Nevirapine (NVP). Plates were spinoculated at 1,200 g for 2 hours at 25°C. Cells were analyzed 3 days after transduction in order to estimate the rate of transduction (%GFP+ cells) in CD11c+CD11b+ cells (approximately 90% of the cells).
Stimulation of MDDCs
Differentiated MDDCs were harvested, counted and resuspended in fresh media at a concentration of 0.5 million per ml and 100 μL was aliquoted in round-bottomed 96-well plates. MDDCs were stimulated by transfected 100 μL of dilutions of 2′3′-cGAMP (Invivogen), HT-DNA (Sigma) or synthetic DNA repeats coding for AATGG satellite motif or shuffled sequence, delivered with Lipofectamine 2000 (Thermo Fisher Scientific). 48 hours after stimulation, cell-surface staining of CD86 and SIGLEC1 were performed. Synthetic dsDNA fragments were obtained from Eurogentec using two steps of purifications (Reverse Phase HPLC (RP-HPLC) and Sephadex G-25) and annealed (sequences are listed in Key Resources Table).
Immunofluorescence
293FT cell lines were grown overnight on a 12mm coverslip. MDDCs, transduced MDDCs or transduced BMDCs were adhered on a 12mm coverslip coated with 0.01% (w/v) Poly-Lysine (SIGMA) for 30 minutes in an incubator for MDDCs or overnight for BMDCs. Cells were fixed with 1ml of PFA 2% (Electron Microscopy Sciences) and PHEM Buffer (2X PHEM buffer: 18.14 g PIPES (Euromedex), 6.5 g HEPES (Euromedex), 3.8 g EGTA (Euromedex), 0.99 g MgSO4 (Carlo Erba Reagenti), for 500 mL in water, pH adjusted to 7.0 with 10M KOH (VWR)) for 20 minutes in an incubator at 37°C. Coverslips were washed 3 times with 1ml of PBS (GIBCO) and quenched with 0.1M Glycine (Life Technologies) for 10 minutes at room temperature (RT). Coverslips were then blocked with 10% goat serum (SIGMA) in PBS (GIBCO), 0.2% (w/v) BSA (Euromedex), 0.05% (w/v) Saponin from quillaja bark (SIGMA) for 30 minutes at RT. Cells were stained with rabbit monoclonal antibody α-cGAS (D1D3G) (CST) at 1:200 (CST Lot #1 – concentration: 17μg/ml) or with Normal Rabbit IgG Isotype control (Thermo Fisher Scientific) at corresponding dilution to the primary antibody, or with a mouse monoclonal antibody α-CENP-B (C-10) (Santa Cruz) at 1:50 in PBS (GIBCO), 0.2% (w/v) BSA (Euromedex), 0.05% (w/v) Saponin from quillaja bark (SIGMA) in presence of 10% goat serum (SIGMA) overnight at 4°C in a humid chamber. Coverslips were then washed 5 times every 3 minutes with PBS (GIBCO), 0.2% (w/v) BSA (Euromedex), 0.05% (w/v) Saponin from quillaja bark (SIGMA) and stained with F(ab’)2-Goat α-Rabbit IgG (H+L) Alexa-647 (Thermo Fisher Scientific) for cGAS or F(ab’)2-Goat anti-Mouse IgG (H+L) Cross-Adsorbed Secondary Antibody, Alexa Fluor 555 (Thermo Fisher Scientific) for CENP-B, for 2 hours at RT in the dark in PBS, BSA, Saponin. Coverslips were then washed 4 times every 3 minutes with PBS (GIBCO), 0.2% (w/v) BSA (Euromedex), 0.05% (w/v) Saponin from quillaja bark (SIGMA), washed an additional time with DNase/RNase free water (GIBCO) and mounted on slides with DAPI Fluoromont G (eBioscience). Mounted coverslips were dried for 1 to 2h at 37°C. For transduced MDDCs or BMDCs expressing GFP fused constructs, coverslips were directly mounted after fixation and wash. Images were acquired with a Leica DmI8 inverted microscope equipped with an SP8 confocal unit using either a 40X (1.35NA) or 63X (1.4NA) objective.
Unfixed chromosome spreads
U2OS cells were grown at 80% confluency on coverslips and treated with colcemid for 2h. Cells were incubated with hypotonic medium (60% medium, 40% water) for 3 min at 37°C and then centrifuged at 1500rpm for 10min. Cells were blocked in KCM buffer (120mM KCl, 20mM NaCl, 10mM Tris-HCl pH = 7.7, 0.1% Triton X-100, 0.5 mM EDTA) + 1% BSA for 30 min. Incubations with primary antibodies were conducted in blocking buffer for 1 hour at room temperature using the following antibodies: CENP-A (1:1000; ADI-KAM-CC006-E, Enzo), cGAS (1:200; #15102, CST), ACA (1:500; 15-235-0001, Antibodies Incorporated). Samples were washed in KCM three times and then incubated with the respective secondary antibody (1:500) in blocking buffer for 45 min. Cells were washed in KCM three times and then fixed in 4% formaldehyde for 10 min prior to DAPI staining and slide mounting. Images were acquired on a Fluorescent microscope DeltaVision Core system (Applied Precision) with 100x Olympus UPlanSApo 100 oil-immersion objective (NA 1.4), 250W Xenon light source equipped with a Photometrics CoolSNAP_HQ2 Camera. 4μm Zstacks were acquired (Z step size: 0.2μm).
Nuclear-Cytoplasmic fractionation
2 million MDDCs at day 4 or day 5 post-differentiation or mouse bone marrow derived DCs at day 10 post-differentiation were collected, washed with 1ml of PBS, and processed according to two different fractionation protocols.
Human donor #1, #2 and mouse DCs: Fractionation procotol A. Cells were lysed with 100μl of Lysis Buffer 1 (LB1) (50mM Tris pH 8.0, 2.5mM EDTA pH 8.0 (Invitrogen), 0.1% NP40 (Euromedex), 10% Glycerol (v/v) (Pharmacia Biotech)) for 5 minutes on ice in presence of cOmplete EDTA free Protease inhibitor cocktail (Roche). Nuclei were pelleted by centrifuging for 5 minutes at 400 g at 4°C. The recovered supernatant represented the cytosolic fraction and were stored on ice. Nuclei were lysed in 100μl of Lysis Buffer X (LBX) (50mM Tris pH 8.0, 2.5mM EDTA pH 8.0 (Invitrogen), 0.25% SDS (Euromedex)) in presence of cOmplete EDTA free Protease inhibitor cocktail (Roche). The lysates were sonicated for 20 minutes at 4°C in a Sonorex Digitec (model DT100) ultrasonic bath (Bandelin). Both fractions were cleared by centrifugation at 16,000 g for 10 minutes at 4°C. The supernatant from both fractions was recovered and stored at −20°C until western blotting.
Human donor #3, #4: Fractionation protocol B. Cells were resuspended in 400μl of cold Cytoplasmic Lysis (CL) buffer (10mM HEPES pH 7.9 (Invitrogen), 10mM KCl, 1.5mM MgCl2, 1mM NaVO4, 50mM NaF) in presence of cOmplete EDTA free Protease inhibitor cocktail (Roche) and centrifuged at 300 g for 4 minutes at 4°C. The supernatant was discarded and cells were resuspended in 40μl of cold CL buffer (10mM HEPES pH 7.9 (Invitrogen), 10mM KCl, 1.5mM MgCl2, 1mM NaVO4, 50mM NaF) in presence of cOmplete EDTA free Protease inhibitor cocktail (Roche) by gentle flicking for 15 minutes on ice. Cytoplasm was lysed by adding 2.5μl of 10% NP40 (Euromedex) and gently flicking. Nuclei were pelleted at 16,000 g for 5 minutes at 4°C. The supernatant containing the cytoplasmic fraction was recovered and frozen at −20°C until western blotting. Nuclei were lysed in 40μl of Nuclear Lysis (NL) buffer (420mM NaCl, 20mM HEPES pH 7.9 (Invitrogen), 1.5mM MgCl2, 0.2mM EDTA (Invitrogen), 250μl Glycerol (Pharmacia Biotech), 1mM NaVO4, 50mM NaF) in presence of cOmplete EDTA free Protease inhibitor cocktail (Roche) on ice for 15 minutes by gentle flicking. Nuclear lysates were vortexed and sonicated for 20 minutes at 4°C in a Sonorex Digitec (model DT100) ultrasonic bath (Bandelin). Nuclear lysate was cleared by centrifugation at 16,000 g for 5 minutes at 4°C and the supernatant was stored at −20°C until western blotting.
Western blotting
1 million cells were lysed in 100μl of LBX in presence of cOmplete EDTA free Protease inhibitor cocktail (Roche). The lysates were sonicated for 20 minutes at 4°C in a Sonorex Digitec (model DT100) ultrasonic bath (Bandelin) and cleared by centrifugation at 16,000 g for 10 minutes at 4°C. The supernatant was stored at −20°C until blotting. 6X Laemmli buffer (12% SDS (v/v) (Euromedex), 58% Glycerol (v/v) (Pharmacia Biotech), 375mM Tris HCl pH 6.8, 30% β-mercaptoethanol (v/v) (Pharmacia Biotech), 0.0012% Bromophenol Blue Before (w/v) (Pharmacia Biotech)) was added to samples to a final concentration of 1X prior to gel run. Samples were boiled at 95°C for 20 minutes on a thermoblock, immediately chilled on ice and centrifuged at 16,000 g for 5 minutes. 15-40μl of samples were resolved on 4%–20% SDS-PAGE gels (Biorad) and transferred on nitrocellulose membrane (Biorad). Membranes were saturated and proteins were blotted with antibodies (listed in Key Resources Table) in 5% non-fat dry milk, PBS, 0.1% Tween buffer. ECL signal was recorded on a ChemiDoc Touch Biorad Imager. Data was analyzed with Image Lab (Biorad).
Live microscopy
0.15-0.25 million HeLa cells were plated in FluoroDish (World Precision Instruments) one day before live imaging. One hour prior to imaging, cells were stained with 1μM of SiR-DNA (Tebu Bio). HeLa cells expressing H2B-mCherry and GFP-cGAS were acquired using an Inverted Spinning Disk Confocal Roper/Nikon equipped with a 100X objective (1.4NA) and an EMCCD 512x512 QuantEM (pixel size:16 μm) Photometrics. HeLa cells expressing GFP-cGAS ΔK173-I220ΔH390-405 were acquired with a Leica DmI8 inverted microscope equipped with an SP8 confocal unit using a 20X (0.75NA) objective. Microscopes were equipped with an on-stage incubation chamber which maintained the temperature at 37°C and CO2 concentration at 5% at all times.
Image processing and analysis
Images were processed and analyzed with ImageJ Fiji.
cGAS Nuclear-Cytoplasmic ratio quantification
A mask of all nuclei was obtained by thresholding the DAPI channel image and individual nuclei were detected using “analyze particles” function. For each nucleus, we first measured the mean GFP-cGAS intensity or the mean endogenous cGAS intensity inside the nucleus. The region of interest corresponding to the nucleus was enlarged by a 1.2 factor to compute the mean cytoplasmic GFP-cGAS or endogenous cGAS intensity at the periphery of the nucleus. A cytoplasmic mask was obtained by thresholding on the GFP-cGAS or endogenous cGAS signal and was used to correct the enlarged nuclear mask. For endogenous cGAS, the average pixel intensity for the nuclear and the peri-nuclear masks were plotted. For GFP-cGAS we defined an enrichment factor as the ratio between the mean nuclear GFP intensity and the cytoplasmic one.
GFP-IRF3 translocation in HeLa
Percentage of cells with GFP-IRF3 nuclear translocation was quantified manually. Cells showing persistent GFP-IRF3 nuclear signal were considered as positive. Bursts of nuclear GFP due to nuclear envelope ruptures were not considered as positive events, as GFP-IRF3 was rapidly excluded from the nucleus. For cells transfected with HT-DNA, to avoid overestimation of translocation events due to cGAMP transfer via gap junctions, only cells showing bright foci of cytoplasmic GFP-IRF3 were considered as positive. The appearance of such cytoplasmic bright foci always correlated with translocation of GFP-IRF3.
GFP enrichment on CENP-B foci or random regions
DCs were stained as described in the section “Immunofluorescence.” ZStacks were acquired with a Leica DmI8 inverted microscope equipped with an SP8 confocal unit using a 63X (1.4NA) objective. Images were oversampled (pixel size of 0.037μm and 0.15μm Zstep) and deconvoluted using Huygens Essentials software (Scientific Volume Imaging). Measurement of GFP enrichment at CENP-B foci was performed on the 3D deconvoluted stacks using a homemade macro. For each acquired nucleus, a threshold on the α-CENPB channel was applied and the XYZ positions of each CENP-B focus were measured using the 3D Object Counter plugin. The mean GFP intensity was measured in a sphere of 0.2μm radius around each CENP-B focus position. The mean GFP intensities in CENP-B foci were then normalized by the nuclear mean GFP intensity, measured from a 3D mask of the nucleus obtained using the DAPI channel. The same analysis was performed on 20 randomly generated positions in each nucleus.
cGAMP bioassay
cGAMP bioassay was previously described (Gentili et al., 2015). 0.8 million 293FT cells per well per cell line were plated in a 6 well plate. One plate for each cell line was either untreated or stimulated with 1μg/ml HT-DNA (SIGMA) transfected with Lipofectamine 2000 (Thermo Fisher Scientific) (1μg HT-DNA:1μl Lipofectamine). Cells were harvested 16-20h after wash with PBS (GIBCO), pelleted and frozen at −80°C until extraction. Cell pellets were thawed and lysed in 500μl of MeOH/H2O (80/20, v/v) and subjected to 5 freeze/thaw cycles in liquid nitrogen. The lysates were then centrifuged at 16,000 g at 4°C for 20 minutes. The recovered supernatants were subjected to speed vacuum drying in Savant DNA Speed Vac DNA 110 at 65°C for 2 hours. The pellets were resuspended in 30μl of RNase-DNase free water (GIBCO). 24 hours prior to the assay, 100,000 THP-1 cells were re-suspended in fresh medium with PMA (Sigma) at 30ng/ml and seeded in 96-well plate flat bottom. THP-1 cells were washed to removed PMA and gently overlaid with 13 μL of 2X Permeabilization Buffer (100mM HEPES, 200mM KCl, 6mM MgCl2, 0.2mM DTT, 170mM Sucrose, 1mM ATP, 2mM GTP, 0.4% BSA, 0.002% Digitonin). The resuspended samples were diluted in 3-fold serial dilutions and 13 μL of each dilution were gently added to cells. Serial dilutions of synthetic 2′3′ cGAMP (InvivoGen) were delivered in 1X Permeabilization Buffer. The cells were incubated for 30 minutes at 37°C, 5% CO2 atmosphere, washed with 150 μL of cell medium, 75 μL of fresh cell medium were added on the cells and incubated overnight. 50 μL of the supernatant were then transferred on HL-116 cells to measure IFN activity as previously described (Lahaye et al., 2013).
cGAMP ELISA
cGAMP ELISA was performed according to manufacturer’s protocol using Cayman Chemical 2′3′-cGAMP ELISA Kit (Interchim). For 293FT quantification, 10 million cells were harvested, washed with PBS, pelleted and frozen in 500μl of MeOH/H2O (80/20, v/v) at −80°C until extraction. For MDDCs quantification at day 4 post-differentiation and transfection, 4.5 million cells (separated into three tubes of 1.5 million cells) were washed with PBS and processed according to the fractionation protocol B. The supernatant containing the cytoplasmic fraction was recovered, one tube was frozen at −20°C until western blotting. The two others cytoplasmic fractions and two nuclei pellets were pooled and frozen in a final volume of 500μl of MeOH/H2O (80/20, v/v) at −80°C until extraction. The last nuclei pellet was lysed according to the fractionation protocol B and the supernatant was stored at −20°C until western blotting.
MeOH/H2O extracts at −80°C were subjected to 5 freeze/thaw cycles in liquid nitrogen. The lysates were then centrifuged at 16,000 g at 4°C for 20 minutes. The recovered supernatants were subjected to speed vacuum drying in Savant DNA Speed Vac DNA 110 at 65°C for 2 hours. The pellets were resuspended in 100μl of RNase-DNase free water. cGAMP quantities were normalized to the number of cells extracted and represented as pg/million cells.
Flow cytometry
Cell surface staining was performed in PBS, 1% BSA (Euromedex), 1mM EDTA (GIBCO), 0.01% NaN3 (AMRESCO) (FACS Buffer). For MDDCs, the antibodies used were anti-human CD86-PE (clone IT2.2, eBioscience) and anti-human CD169-APC (SIGLEC1) (clone 7-239, Miltenyi). For BMDCs, the antibodies used were anti-mouse CD11c-PECy7 (clone N418, eBioscience) and anti-mouse CD11b-PerCp-Cy5.5 (clone M1170, eBioscience). Cells were stained for 15 minutes at 4°C, washed for two times in FACS buffer and fixed in 1% paraformaldehyde (Electron Microscopy Sciences) in FACS Buffer. Data was acquired on a FACSVerse (BD) flow cytometer and analyzed in FlowJo.
Cell compression
0.5 million HeLa cells per well were seeded in a 6 well plate glass bottom in 500μl and then a 3 μm roof of PDMS was placed on top, as previously described (Le Berre et al., 2014, Liu et al., 2015). Briefly, silicon wafers were coated with SU8 2005 photoresist (Microchem) 3 μm in height and holes were made in lithography. To make the PDMS pillars as the 3 μm height spacers, 12 mm glass coverslips were plasma treated and then placed on top of a PDMS/crosslinker mixture (10/1 w/w) on the wafer containing 3 μm holes. After baking at 95°C for 15 min, coverslips with PDMS pillars were carefully removed from the wafers using isopropanol and a razor blade. They were then cleaned with isopropanol, well-dried, plasma activated for 2 min, and treated with 0.1 mg/mL pLL-g-PEG in 10 mM pH 7.4 HEPES buffer for 1h at room temperature. Coverslips with PDMS pillars were rinsed and incubated in medium for at least 2 hours before confining the cells. The modified cover lid of a multi-well plate was used to apply confining slides to cells. In this case, large PDMS pillars were stuck on the cover lid of the multi-well plate to hold confining slides. The process of fabrication for these large pillars attached to the 6 well plate lid is as follows: the large PDMS pillars were fabricated by pouring a PDMS/crosslinker mixture (35/1 w/w) into a custom-made metallic mold, removing bubbles under vacuum, then baking overnight at 70°C, and getting the pillars out of the mold with the help of isopropanol. For HT-DNA transfection, cells were pre-treated for 30 minutes with 4μg/ml of HT-DNA with Lipofectamine 2000 (1μg HT-DNA:1μl Lipofectamine 2000) and then compressed or left untouched. Time-lapse recordings were acquired with a 40x objective, 0.95 NA, DIC, using an Eclipse Ti inverted microscope (Nikon) equipped with a Coolsnap HQ2 camera (Roper Scientific) controlled by MetaMorph software (Universal Imaging). Microscope was equipped with an on-stage incubation chamber which maintained the temperature at 37°C and CO2 concentration at 5% at all times. GFP signal was acquired with an interval of 5 minutes, while the mCherry signal was acquired every 3 frames of GFP to avoid phototoxicity mediated cell death.
Luciferase assay
45,000 293FT cells were plated in a 24-well plate in 500μl of medium. The next day, cells were transfected in fresh medium with 500ng of total DNA comprising 200ng of IFNβ-pGL3 and 150ng of the empty vector pMSCV-Hygro or or pMSCV-Hygro-STING R232 with TransIT-293 (Mirus). A master mix of transfection solution was prepared for each condition. 16h hours post transfection the medium was replaced with fresh medium. 30-36h after medium change cells were washed with PBS and lysed with 100μl of Passive Lysis Buffer (Promega) and 10μl of the lysates were used to perform the Luciferase assay. Luciferase activity was measured using Luciferase Assay Reagent (Promega). Luminescence was acquired on a FLUOstar OPTIMA microplate reader (BMG labtech). One well with the same transfection conditions for the assay was lysed for Western Blotting in 100μl LBX.
Quantitative PCR with Reverse Transcription (qRT-PCR)
1 million BMDCs from WT or Cgas−/− mice were collected at day 10, washed once in PBS (GIBCO) and lysed in 700μl of QIAzol (QIAGEN) and froze at −80°C until RNA purification. RNA was purified with miRNeasy Micro Kit (QIAGEN), following manufacturer instructions. 0.25 to 0.5 millions of transduced MDDCs for 4 days or BMDCs for 3 days were collected, washed once in PBS (GIBCO) and RNA were extracted using Nucleospin RNA II kit (Macherey-Nagel). cDNA was reverse transcribed using SuperScript III Reverse Transcriptase (Invitrogen) and Random Primer Mix (NEB) following manufacturer instructions. Quantitative PCR reaction was performed with LightCycler 480 SYBR Green I Master Mix (Roche) in a LightCycler 480 (Roche) and analyzed in LightCycler 480 software with the 2-ΔCp method. The primer pairs are listed in the Key Resources Table.
Chromatin immunoprecipitation
Crosslinking and lysis
10 million cells were cross-linked in medium with 1% formaldehyde for 8 min at RT on a slow shaker, quenched with freshly prepared 0.125M glycine, incubated 5min at RT on a slow shaker, then pelleted at 400 g for 5 minutes at 4°C, washed three times with 30ml of ice cold PBS and then incubated for 20 minutes rotating at 4°C in 1mL of RIPA lysis buffer (10mM Tris-HCl pH 8.0, 1mM EDTA pH 8.0 (Invitrogen), 140mM NaCl, 1% (v/v) Triton X-100 (Euromedex), 0.1% (v/v) SDS and 0.1% sodium deoxycholate (SIGMA)). Nuclei were pelleted at 1350 g for 5 minutes at 4°C, washed for 10 minutes rotating with 1ml of a buffer containing 10mM Tris, 200mM NaCl, 1mM EDTA (Invitrogen), 0.5 mM EGTA (Euromedex), pelleted and lysed in buffer containing 0.4% SDS (Euromedex), 10mM EDTA (Invitrogen), 50mM Tris-HCl pH 8.0 for 30min on ice (volume of buffer = 100μl/1.6 million cells). Lysates were sonicated on a Bioruptor Pico (Diagenode) sonication devices (11cycles 30 s ON, 30 s OFF) to reach fragments ranging from 150 to 500bp, and then centrifuged at 10,000 g for 10 minutes at 4°C to remove debris. Samples were then snap-frozen in liquid nitrogen and stored at −80°C until immunoprecipitation. All buffers contained cOmplete EDTA free Protease inhibitor cocktail (Roche).
Immunoprecipitation
Lysates were pre-cleared for 15 minutes rotating using 30μl of Binding Control magnetic agarose beads (Chromotek). Chromatin was diluted four-fold in dilution buffer containing 20mM Tris-HCl pH 8.0, 1% Triton X-100 (Euromedex), 2mM EDTA (Invitrogen), 167mM NaCl. 1% of the diluted lysate was recovered and used as input. For GFP-trap and control beads, chromatin was incubated for 5 hours in the presence of 0.1% BSA (Euromedex) (30μl of beads (GFP-Trap_MA beads (Chromotek) or Control magnetic agarose beads (Chromotek)/600μl per Eppendorf tube of the diluted lysate). Lysates were washed on a 96 well plate magnet with low salt washing buffer (140mM NaCl) (5 times), high salt washing buffer (500mM NaCl) (2 times), high LiCl washing buffer (250mM LiCl) (2 times), TE Buffer (Invitrogen) (1 time). All wash buffers were diluted in RIPA buffer 10mM Tris-HCl pH 8.0, 1mM EDTA pH 8.0 (Invitrogen), 140mM NaCl, 1% (v/v) Triton X-100 (Euromedex), 0.1% (v/v) SDS and 0.1% sodium deoxycholate (SIGMA)) and contained cOmplete EDTA free Protease inhibitor cocktail (Roche).
DNA purification
DNA was eluted in elution buffer (1% SDS, 50 mM NaHCO3) by shacking 2h at 37°C (100μl of buffer/tube) with 10 μg/mL RNaseA (Thermo Fischer), then 4h with 0.2 μg/ml proteinase K. Beads were concentrated on the magnet and take out eluate. Samples were decrosslinked overnight at 65°C. Inputs were treated like ChIP samples. DNA was purified by phenol/chloroform/isoamyl alcohol (SIGMA) followed by purification on MinElute columns (QIAGEN). DNA was eluted in 50μl of H2O and DNA concentration was measured with a Qubit fluorometer (Thermo Fischer).
ChIP-seq
Traces of high molecular weight fragments were eliminated with SPRIselect beads (Beckman Coulter). Illumina TruSeq ChIP library prep kit was used to prepare indexed libraries from IP and Input DNA. Libraries were pooled respecting equimolarity. Sequencing was performed on Illumina MiSeq sequencer in 150 bp paired-end reads (replicate 1 of human input and GFP-NLS-cGAS IP; replicate 1 and pooled replicates 2+3 of mouse input and GFP-cGAS IP), 100 bp single-end reads (replicates 2 and 3 of human input, GFP-NLS and GFP-NLS-cGAS IP).
ChIP-seq data analysis of overexpressed cGAS in human DCs
Mapping and peak calling
Reads for each replicate were mapped separately to the hg38 primary assembly (accession: GCF_000001305.14) with Bowtie2 v2.2.9 (Langmead and Salzberg, 2012) using a seed length of 22bp with at most 1 mismatches (-N 1 -L 22) and keeping the best scoring alignment per read. Duplicate fragments were identified with MarkDuplicates from picard v1 (https://broadinstitute.github.io/picard/). Only non-duplicate, properly paired reads (same reference, inner-oriented, insert size ≤ 500bp; only for replicate 1) with mapping quality ≥ 20 were retained, using samtools v1.3. Alignment files were converted from BAM to BED/BEDPE format using bedtools bamtobed from bedtools v2.27.1 (https://bedtools.readthedocs.io/en/latest/).
Genome mappability was computed with gemtools v1.7.1 (-l L -m 0.04 -e 0.04–max-big-indel-length 15–min-matched-bases 0.80, where L is the read length) (https://github.com/gemtools/gemtools). The effective genome size was then defined as m/n, where m is the number of bp with mappability score 1 (i.e., sequences occurring once in the genome) and n is the genome length.
Peak calling of GFP-NLS-cGAS IP reads on hg38 chromosomes was performed with SICER v1.1 on each replicate separately, using either input or GFP-NLS IP (only for replicate 2 and 3) reads as background (redundancy threshold 1, window size 200bp, FDR 0.05, effective genome size estimated with the above procedure). The gap size was set to 600bp for replicate 1 and to 400bp for replicate 2 and 3. For replicate 1, one read for each pair was used and the fragment size was set to the average insert size computed from the alignment. Filtered peaks were defined for each replicate i as the peaks supported by more than M ChIP reads, where M is the median across all peaks for replicate i. Selected peaks were defined as follows: a peak P1 from donor i is selected if there is a peak P2 from donor j, with j ≠ i, lying at a distance < 2000 bp from P1. Intersection peaks between replicate 2 and 3 (over GFP-NLS IP) were also identified, across all (non-filtered) peaks, using bedtools intersect (default parameters) from bedtools v2.27.1.
Public datasets
Reads datasets for endogenous CENP-A ChIP-Seq and MNase input in HeLa S3 cells from a previous study (Lacoste et al., 2014) were downloaded from SRA (accessions: SRR633612, SRR633613, SRR633614, SRR633615). Repeats annotation of hg38 is obtained with RepeatMasker v4.0.5 on repeats database version 20140131 (downloaded from http://www.repeatmasker.org/genomes/hg38/RepeatMasker-rm405-db20140131).
Peaks for histone marks H3K27ac in GM12878 cells (GEO: GSE29611) and H3K9me3 in PBMCs (GEO: GSE31755) were from the ENCODE consortium.
Peak calling of endogenous CENP-A ChIP on hg38
Peak calling on endogenous CENP-A data was performed following the approach previously described (Lacoste et al., 2014), with small modifications. The paired reads sequenced from the same fragment were merged using SeqPrep-1.2 (https://github.com/jstjohn/SeqPrep), with prior Illumina adaptors removal, requiring an overlap of at least 15bp. Fragments shorter than 100bp were filtered out. The first 50bp of each fragment were mapped separately for each replicate to the hg38 primary assembly (accession: GCF_000001305.14) with Bowtie v1. 2 (http://bowtie-bio.sourceforge.net/), allowing up to 3 mismatches (-v 3). Alignment files were converted from BAM to BED format using bedtools v2.27. The effective genome size is defined as m/n, where m is the number unique 50-mers (downloaded from https://github.com/biocore-ntnu/epic/blob/master/epic/scripts/effective_sizes/hg38_50.txt), and n is the genome length. Peak calling of CENP-A-IP reads on hg38 chromosomes was performed with SICER v1.1 on the two replicates separately, using input reads as background (redundancy threshold 1, window size 200bp, gap size 400bp, FDR 1e-5, effective genome size defined as above). Intersection peaks between the two replicates were detected with bedtools intersect from bedtools v2.27.1, requiring each intersection peak to cover at least 90% of the length of a peak in either replicate 1 or 2.
Peak annotation
The annotatePeaks.pl script from HOMER software v4.9 (http://homer.ucsd.edu/homer/) was used to annotate the human cGAS filtered peaks and to calculate enrichments of the annotated features.
Association of GFP-NLS-cGAS peaks with public datasets
Intersection of GFP-NLS-cGAS IP peaks with publicly available ChIP-Seq datasets (H3K27ac, H3K9me3, endogenous CENP-A) is computed at the base pair level. Lift-over from hg19 to hg38 is applied for H3K27ac and H3K9me3, whereas CENP-A peaks on hg38 are computed starting from raw data following the approach described above. The intersection is computed using bedtools intersect from bedtools v2.27.1 and the odds-ratio between two datasets A and B is defined as
where G is the genome size, a and b are the cumulative sizes of the regions in A and B, respectively, and x is the size of the intersection.
De novo motif discovery and motif enrichment analyses
This analysis was carried out on all intersecting peaks of GFP-NLS-cGAS over GFP-NLS in donor #2 and #3. 38 peaks are found. For de novo discovery, the peak-motifs pipeline (default parameters) of the software suite Regulatory Sequence Analysis Tools (RSAT; http://rsat.sb-roscoff.fr/) was used. cGAS intersection peaks are searched for CENP-B box, the consensus (NTTCGNNNNANNCGGGN) and the most common (NTTCGTTGGAANCGGGA), for Satellite repeats ([GGAAT]n, with n ≥ 4), and for telomere repeats ([TTAGGG]n, with n ≥ 2), using regular expression matching (in-house perl script). Motif enrichment is computed either over shuffled peaks (same number of peaks, same length) on the genome (with prior removal of gap regions, gap table from UCSC table browser). 10 peak shuffling runs are performed using bedtools shuffle from bedtools v2.27.1 and the motif enrichment is averaged across the 10 runs. The enrichment is defined as the ratio of the motif count on the peaks over the motif count on the shuffled peaks.
cGAS reads enrichment on repeats
Reads for each replicate were mapped separately to the hg38 primary assembly and alignments were filtered as described above. The coverage of each repeat element x in the genome is defined as the number of reads whose midpoint lies within x (in-house C++ code). The cGAS read enrichment of region x is defined as
where and are the ChIP and control read count on x and and are the library sizes. All repeat elements in the genome are ranked according to the cGAS read enrichment value and grouped into n ranking bins, where bin i contains the elements whose percentage ranking ranges between the top (100/i)% and the top (100/i+1)%. The number of elements falling into each bin is computed for each repeat class R. The first bin represents the bottom (100/n)% ranks and the n-th bin represents the top (100/n)% ranks.
ChIP-seq analysis of endogenous cGAS in mouse DCs
Mapping, peak calling and peak annotation
Raw reads were aligned to the mouse reference genome version mm10 (accession: GCA_000001305.2) with Bowtie2 v2.1.0 using a seed length of 22bp with at most 1 mismatch (-N 1 -L 22) and keeping the best scoring alignment per read. Alignment filtering and peak calling were performed as for the cGAS overexpression dataset (replicate 1). Intersection peaks between the two replicates were identified using bedtools intersect (default parameters) from bedtools v2.27.1. For peak annotation, the same procedure as for cGAS overexpression was followed.
Mapping to repeats database
Reads that failed to map to mm10 were aligned against the mouse- specific repeats from RepBase (https://www.girinst.org/repbase/). Bowtie2 was run with the same parameters as above but with soft-clipping option enabled (–local). The read count for each RepBase sequence was computed from the BAM files with samtools v1.3 (http://samtools.sourceforge.net/), and then normalized by the total number of reads mapped to RepBase. Repeats enrichment in ChIP with respect to Input was computed as the ratio between the normalized read counts and then log2-transformed.
Quantification and Statistical Analysis
Statistical analyses for all experiments except ChIP-seq were performed in Prism (GraphPad) v7. For ChIP-seq statistical analysis please refer to the corresponding section in the “Method Details” section. Statistical parameters including the exact value of n, dispersion and precision measures (as mean ± SEM) and statistical significance are reported in the Figures and Figure legends. In figures asterisks denote statistical significance ∗p < 0.05, ∗∗p < 0.01, ∗∗∗p < 0.001, ∗∗∗p < 0.0001, ‘‘ns’’ = not significant. Statistical tests used are indicated in the figure legends.
Data and Software Availability
The accession number for the raw data files of the ChIP-seq experiments reported in this paper is NCBI GEO: GSE125475.
Acknowledgments
We thank J. Waterfall, R. Gamba, A. Gatto, G. Almouzni, and D. Stetson for discussions and J. Gil for technical assistance. We acknowledge the flow cytometry facility and the imaging facility at Institut Curie (PICT-IBiSA, LABEX ANR-10-LBX-0038, ANR-10-IDEX-0001-02 PSL, France-BioImaging, ANR-10-INSB-04). This work was supported by LABEX VRI (ANR-10-LABX-77), LABEX DCBIOL (ANR-10-IDEX-0001-02 PSL∗ and ANR-11-LABX-0043), ANR INNATENUCLEOTIDES, Fondation BMS, ACTERIA Foundation, Fondation Schlumberger pour l’Education et la Recherche (FSER), ANRS (France Recherche Nord & Sud Sida-hiv Hépatites; ECTZ25472, ECTZ36691), Sidaction (VIH2016126002), DIM Biothérapies, and European Research Council grants 309848 HIVINNATE and 727408 STIMUNITY to N.M. E.P.L. received a doctoral fellowship from the French Ministry of Education, Research, and Technology. N.S.D.S. received a Marie Skłodowska-Curie Individual Fellowship (DCBIO 751735) and an EMBO Long-term fellowship (ALTF 1298-2016).
Author Contributions
N.M. and M.G. designed the study, analyzed the data, and wrote the manuscript. M.G. performed most of the experiments. X.L. performed the experiments with mouse cells and cGAMP ELISA and contributed to the experiments with human cells. G.F.P.N. performed parts of the experiments with cell confinement and their analysis. E.P.L. performed the initial analysis of the next-generation sequencing (NGS) data on hg19. F.N. analyzed the NGS data on hg38 and mm10. S.H. analyzed the metaphase chromosomes. E.Z. performed the chromatin immunoprecipitation experiment. N.S.D.S., D.C.R., and A.B. contributed to some of the experiments, and C.G. and M.M. contributed to some of the analyses. A.L.-V. supervised E.P.L. M.P. designed part of the study and supervised G.F.P.N. S.A. supervised D.C.R. and E.Z. D.F. supervised S.H. All of the authors discussed the results.
Declaration of Interests
The authors declare no competing interests.
Published: February 26, 2019
Footnotes
Supplemental Information can be found with this article online at https://doi.org/10.1016/j.celrep.2019.01.105.
Supplemental Information
References
- Andreeva L., Hiller B., Kostrewa D., Lässig C., de Oliveira Mann C.C., Jan Drexler D., Maiser A., Gaidt M., Leonhardt H., Hornung V., Hopfner K.P. cGAS senses long and HMGB/TFAM-bound U-turn DNA by forming protein-DNA ladders. Nature. 2017;549:394–398. doi: 10.1038/nature23890. [DOI] [PubMed] [Google Scholar]
- Ardeshna K.M., Pizzey A.R., Thomas N.S., Orr S., Linch D.C., Devereux S. Monocyte-derived dendritic cells do not proliferate and are not susceptible to retroviral transduction. Br. J. Haematol. 2000;108:817–824. doi: 10.1046/j.1365-2141.2000.01956.x. [DOI] [PubMed] [Google Scholar]
- Cerboni S., Jeremiah N., Gentili M., Gehrmann U., Conrad C., Stolzenberg M.C., Picard C., Neven B., Fischer A., Amigorena S. Intrinsic antiproliferative activity of the innate sensor STING in T lymphocytes. J. Exp. Med. 2017;214:1769–1785. doi: 10.1084/jem.20161674. [DOI] [PMC free article] [PubMed] [Google Scholar]
- Chen Q., Sun L., Chen Z.J. Regulation and function of the cGAS-STING pathway of cytosolic DNA sensing. Nat. Immunol. 2016;17:1142–1149. doi: 10.1038/ni.3558. [DOI] [PubMed] [Google Scholar]
- Civril F., Deimling T., de Oliveira Mann C.C., Ablasser A., Moldt M., Witte G., Hornung V., Hopfner K.P. Structural mechanism of cytosolic DNA sensing by cGAS. Nature. 2013;498:332–337. doi: 10.1038/nature12305. [DOI] [PMC free article] [PubMed] [Google Scholar]
- Denais C.M., Gilbert R.M., Isermann P., McGregor A.L., te Lindert M., Weigelin B., Davidson P.M., Friedl P., Wolf K., Lammerding J. Nuclear envelope rupture and repair during cancer cell migration. Science. 2016;352:353–358. doi: 10.1126/science.aad7297. [DOI] [PMC free article] [PubMed] [Google Scholar]
- Dou Z., Ghosh K., Vizioli M.G., Zhu J., Sen P., Wangensteen K.J., Simithy J., Lan Y., Lin Y., Zhou Z. Cytoplasmic chromatin triggers inflammation in senescence and cancer. Nature. 2017;550:402–406. doi: 10.1038/nature24050. [DOI] [PMC free article] [PubMed] [Google Scholar]
- Du M., Chen Z.J. DNA-induced liquid phase condensation of cGAS activates innate immune signaling. Science. 2018;361:704–709. doi: 10.1126/science.aat1022. [DOI] [PMC free article] [PubMed] [Google Scholar]
- Dunleavy E., Pidoux A., Allshire R. Centromeric chromatin makes its mark. Trends Biochem. Sci. 2005;30:172–175. doi: 10.1016/j.tibs.2005.02.007. [DOI] [PubMed] [Google Scholar]
- Gentili M., Kowal J., Tkach M., Satoh T., Lahaye X., Conrad C., Boyron M., Lombard B., Durand S., Kroemer G. Transmission of innate immune signaling by packaging of cGAMP in viral particles. Science. 2015;349:1232–1236. doi: 10.1126/science.aab3628. [DOI] [PubMed] [Google Scholar]
- Glück S., Guey B., Gulen M.F., Wolter K., Kang T.W., Schmacke N.A., Bridgeman A., Rehwinkel J., Zender L., Ablasser A. Innate immune sensing of cytosolic chromatin fragments through cGAS promotes senescence. Nat. Cell Biol. 2017;19:1061–1070. doi: 10.1038/ncb3586. [DOI] [PMC free article] [PubMed] [Google Scholar]
- Gough D.J., Messina N.L., Clarke C.J., Johnstone R.W., Levy D.E. Constitutive type I interferon modulates homeostatic balance through tonic signaling. Immunity. 2012;36:166–174. doi: 10.1016/j.immuni.2012.01.011. [DOI] [PMC free article] [PubMed] [Google Scholar]
- Grady D.L., Ratliff R.L., Robinson D.L., McCanlies E.C., Meyne J., Moyzis R.K. Highly conserved repetitive DNA sequences are present at human centromeres. Proc. Natl. Acad. Sci. USA. 1992;89:1695–1699. doi: 10.1073/pnas.89.5.1695. [DOI] [PMC free article] [PubMed] [Google Scholar]
- Güttinger S., Laurell E., Kutay U. Orchestrating nuclear envelope disassembly and reassembly during mitosis. Nat. Rev. Mol. Cell Biol. 2009;10:178–191. doi: 10.1038/nrm2641. [DOI] [PubMed] [Google Scholar]
- Harding S.M., Benci J.L., Irianto J., Discher D.E., Minn A.J., Greenberg R.A. Mitotic progression following DNA damage enables pattern recognition within micronuclei. Nature. 2017;548:466–470. doi: 10.1038/nature23470. [DOI] [PMC free article] [PubMed] [Google Scholar]
- Härtlova A., Erttmann S.F., Raffi F.A., Schmalz A.M., Resch U., Anugula S., Lienenklaus S., Nilsson L.M., Kröger A., Nilsson J.A. DNA damage primes the type I interferon system via the cytosolic DNA sensor STING to promote anti-microbial innate immunity. Immunity. 2015;42:332–343. doi: 10.1016/j.immuni.2015.01.012. [DOI] [PubMed] [Google Scholar]
- Henikoff S., Ahmad K., Malik H.S. The centromere paradox: stable inheritance with rapidly evolving DNA. Science. 2001;293:1098–1102. doi: 10.1126/science.1062939. [DOI] [PubMed] [Google Scholar]
- Hrecka K., Hao C., Gierszewska M., Swanson S.K., Kesik-Brodacka M., Srivastava S., Florens L., Washburn M.P., Skowronski J. Vpx relieves inhibition of HIV-1 infection of macrophages mediated by the SAMHD1 protein. Nature. 2011;474:658–661. doi: 10.1038/nature10195. [DOI] [PMC free article] [PubMed] [Google Scholar]
- Jeremiah N., Neven B., Gentili M., Callebaut I., Maschalidi S., Stolzenberg M.C., Goudin N., Frémond M.L., Nitschke P., Molina T.J. Inherited STING-activating mutation underlies a familial inflammatory syndrome with lupus-like manifestations. J. Clin. Invest. 2014;124:5516–5520. doi: 10.1172/JCI79100. [DOI] [PMC free article] [PubMed] [Google Scholar]
- Kipling D., Ackford H.E., Taylor B.A., Cooke H.J. Mouse minor satellite DNA genetically maps to the centromere and is physically linked to the proximal telomere. Genomics. 1991;11:235–241. doi: 10.1016/0888-7543(91)90128-2. [DOI] [PubMed] [Google Scholar]
- Lacoste N., Woolfe A., Tachiwana H., Garea A.V., Barth T., Cantaloube S., Kurumizaka H., Imhof A., Almouzni G. Mislocalization of the centromeric histone variant CenH3/CENP-A in human cells depends on the chaperone DAXX. Mol. Cell. 2014;53:631–644. doi: 10.1016/j.molcel.2014.01.018. [DOI] [PubMed] [Google Scholar]
- Laguette N., Sobhian B., Casartelli N., Ringeard M., Chable-Bessia C., Ségéral E., Yatim A., Emiliani S., Schwartz O., Benkirane M. SAMHD1 is the dendritic- and myeloid-cell-specific HIV-1 restriction factor counteracted by Vpx. Nature. 2011;474:654–657. doi: 10.1038/nature10117. [DOI] [PMC free article] [PubMed] [Google Scholar]
- Lahaye X., Satoh T., Gentili M., Cerboni S., Conrad C., Hurbain I., El Marjou A., Lacabaratz C., Lelièvre J.D., Manel N. The capsids of HIV-1 and HIV-2 determine immune detection of the viral cDNA by the innate sensor cGAS in dendritic cells. Immunity. 2013;39:1132–1142. doi: 10.1016/j.immuni.2013.11.002. [DOI] [PubMed] [Google Scholar]
- Lahaye X., Gentili M., Silvin A., Conrad C., Picard L., Jouve M., Zueva E., Maurin M., Nadalin F., Knott G.J. NONO detects the nuclear HIV capsid to promote cGAS-mediated innate immune activation. Cell. 2018;175:488–501.e22. doi: 10.1016/j.cell.2018.08.062. [DOI] [PubMed] [Google Scholar]
- Lan Y.Y., Londoño D., Bouley R., Rooney M.S., Hacohen N. Dnase2a deficiency uncovers lysosomal clearance of damaged nuclear DNA via autophagy. Cell Rep. 2014;9:180–192. doi: 10.1016/j.celrep.2014.08.074. [DOI] [PMC free article] [PubMed] [Google Scholar]
- Langmead B., Salzberg S.L. Fast gapped-read alignment with Bowtie 2. Nat. Methods. 2012;9:357–359. doi: 10.1038/nmeth.1923. [DOI] [PMC free article] [PubMed] [Google Scholar]
- Le Berre M., Zlotek-Zlotkiewicz E., Bonazzi D., Lautenschlaeger F., Piel M. Methods for two-dimensional cell confinement. Methods Cell Biol. 2014;121:213–229. doi: 10.1016/B978-0-12-800281-0.00014-2. [DOI] [PubMed] [Google Scholar]
- Lee J., Breton G., Oliveira T.Y., Zhou Y.J., Aljoufi A., Puhr S., Cameron M.J., Sékaly R.P., Nussenzweig M.C., Liu K. Restricted dendritic cell and monocyte progenitors in human cord blood and bone marrow. J. Exp. Med. 2015;212:385–399. doi: 10.1084/jem.20141442. [DOI] [PMC free article] [PubMed] [Google Scholar]
- Li X., Shu C., Yi G., Chaton C.T., Shelton C.L., Diao J., Zuo X., Kao C.C., Herr A.B., Li P. Cyclic GMP-AMP synthase is activated by double-stranded DNA-induced oligomerization. Immunity. 2013;39:1019–1031. doi: 10.1016/j.immuni.2013.10.019. [DOI] [PMC free article] [PubMed] [Google Scholar]
- Li X.D., Wu J., Gao D., Wang H., Sun L., Chen Z.J. Pivotal roles of cGAS-cGAMP signaling in antiviral defense and immune adjuvant effects. Science. 2013;341:1390–1394. doi: 10.1126/science.1244040. [DOI] [PMC free article] [PubMed] [Google Scholar]
- Liu Y.J., Le Berre M., Lautenschlaeger F., Maiuri P., Callan-Jones A., Heuzé M., Takaki T., Voituriez R., Piel M. Confinement and low adhesion induce fast amoeboid migration of slow mesenchymal cells. Cell. 2015;160:659–672. doi: 10.1016/j.cell.2015.01.007. [DOI] [PubMed] [Google Scholar]
- Liu H., Zhang H., Wu X., Ma D., Wu J., Wang L., Jiang Y., Fei Y., Zhu C., Tan R. Nuclear cGAS suppresses DNA repair and promotes tumorigenesis. Nature. 2018;563:131–136. doi: 10.1038/s41586-018-0629-6. [DOI] [PubMed] [Google Scholar]
- Lu Q., Haragopal H., Slepchenko K.G., Stork C., Li Y.V. Intracellular zinc distribution in mitochondria, ER and the Golgi apparatus. Int. J. Physiol. Pathophysiol. Pharmacol. 2016;8:35–43. [PMC free article] [PubMed] [Google Scholar]
- Luecke S., Holleufer A., Christensen M.H., Jønsson K.L., Boni G.A., Sørensen L.K., Johannsen M., Jakobsen M.R., Hartmann R., Paludan S.R. cGAS is activated by DNA in a length-dependent manner. EMBO Rep. 2017;18:1707–1715. doi: 10.15252/embr.201744017. [DOI] [PMC free article] [PubMed] [Google Scholar]
- Mackenzie K.J., Carroll P., Martin C.A., Murina O., Fluteau A., Simpson D.J., Olova N., Sutcliffe H., Rainger J.K., Leitch A. cGAS surveillance of micronuclei links genome instability to innate immunity. Nature. 2017;548:461–465. doi: 10.1038/nature23449. [DOI] [PMC free article] [PubMed] [Google Scholar]
- Manel N., Hogstad B., Wang Y., Levy D.E., Unutmaz D., Littman D.R. A cryptic sensor for HIV-1 activates antiviral innate immunity in dendritic cells. Nature. 2010;467:214–217. doi: 10.1038/nature09337. [DOI] [PMC free article] [PubMed] [Google Scholar]
- Müller S., Almouzni G. Chromatin dynamics during the cell cycle at centromeres. Nat. Rev. Genet. 2017;18:192–208. doi: 10.1038/nrg.2016.157. [DOI] [PubMed] [Google Scholar]
- Muro Y., Masumoto H., Yoda K., Nozaki N., Ohashi M., Okazaki T. Centromere protein B assembles human centromeric alpha-satellite DNA at the 17-bp sequence, CENP-B box. J. Cell Biol. 1992;116:585–596. doi: 10.1083/jcb.116.3.585. [DOI] [PMC free article] [PubMed] [Google Scholar]
- Orzalli M.H., Broekema N.M., Diner B.A., Hancks D.C., Elde N.C., Cristea I.M., Knipe D.M. cGAS-mediated stabilization of IFI16 promotes innate signaling during herpes simplex virus infection. Proc. Natl. Acad. Sci. USA. 2015;112:E1773–E1781. doi: 10.1073/pnas.1424637112. [DOI] [PMC free article] [PubMed] [Google Scholar]
- Raab M., Gentili M., de Belly H., Thiam H.R., Vargas P., Jimenez A.J., Lautenschlaeger F., Voituriez R., Lennon-Duménil A.M., Manel N., Piel M. ESCRT III repairs nuclear envelope ruptures during cell migration to limit DNA damage and cell death. Science. 2016;352:359–362. doi: 10.1126/science.aad7611. [DOI] [PubMed] [Google Scholar]
- Rongvaux A., Jackson R., Harman C.C., Li T., West A.P., de Zoete M.R., Wu Y., Yordy B., Lakhani S.A., Kuan C.Y. Apoptotic caspases prevent the induction of type I interferons by mitochondrial DNA. Cell. 2014;159:1563–1577. doi: 10.1016/j.cell.2014.11.037. [DOI] [PMC free article] [PubMed] [Google Scholar]
- Schlee M., Hartmann G. Discriminating self from non-self in nucleic acid sensing. Nat. Rev. Immunol. 2016;16:566–580. doi: 10.1038/nri.2016.78. [DOI] [PMC free article] [PubMed] [Google Scholar]
- Schoggins J.W., MacDuff D.A., Imanaka N., Gainey M.D., Shrestha B., Eitson J.L., Mar K.B., Richardson R.B., Ratushny A.V., Litvak V. Pan-viral specificity of IFN-induced genes reveals new roles for cGAS in innate immunity. Nature. 2014;505:691–695. doi: 10.1038/nature12862. [DOI] [PMC free article] [PubMed] [Google Scholar]
- Sun L., Wu J., Du F., Chen X., Chen Z.J. Cyclic GMP-AMP synthase is a cytosolic DNA sensor that activates the type I interferon pathway. Science. 2013;339:786–791. doi: 10.1126/science.1232458. [DOI] [PMC free article] [PubMed] [Google Scholar]
- Tait S.W., Green D.R. Mitochondria and cell death: outer membrane permeabilization and beyond. Nat. Rev. Mol. Cell Biol. 2010;11:621–632. doi: 10.1038/nrm2952. [DOI] [PubMed] [Google Scholar]
- Tao J., Zhang X.W., Jin J., Du X.X., Lian T., Yang J., Zhou X., Jiang Z., Su X.D. Nonspecific DNA Binding of cGAS N Terminus Promotes cGAS Activation. J. Immunol. 2017;198:3627–3636. doi: 10.4049/jimmunol.1601909. [DOI] [PubMed] [Google Scholar]
- West A.P., Khoury-Hanold W., Staron M., Tal M.C., Pineda C.M., Lang S.M., Bestwick M., Duguay B.A., Raimundo N., MacDuff D.A. Mitochondrial DNA stress primes the antiviral innate immune response. Nature. 2015;520:553–557. doi: 10.1038/nature14156. [DOI] [PMC free article] [PubMed] [Google Scholar]
- Woodward J.J., Iavarone A.T., Portnoy D.A. c-di-AMP secreted by intracellular Listeria monocytogenes activates a host type I interferon response. Science. 2010;328:1703–1705. doi: 10.1126/science.1189801. [DOI] [PMC free article] [PubMed] [Google Scholar]
- Wu J., Sun L., Chen X., Du F., Shi H., Chen C., Chen Z.J. Cyclic GMP-AMP Is an Endogenous Second Messenger in Innate Immune Signaling by Cytosolic DNA. Science. 2013;339:826–830. doi: 10.1126/science.1229963. [DOI] [PMC free article] [PubMed] [Google Scholar]
- Wu X., Wu F.H., Wang X., Wang L., Siedow J.N., Zhang W., Pei Z.M. Molecular evolutionary and structural analysis of the cytosolic DNA sensor cGAS and STING. Nucleic Acids Res. 2014;42:8243–8257. doi: 10.1093/nar/gku569. [DOI] [PMC free article] [PubMed] [Google Scholar]
- Xia P., Wang S., Ye B., Du Y., Li C., Xiong Z., Qu Y., Fan Z. A Circular RNA Protects Dormant Hematopoietic Stem Cells from DNA Sensor cGAS-Mediated Exhaustion. Immunity. 2018;48:688–701.e7. doi: 10.1016/j.immuni.2018.03.016. [DOI] [PubMed] [Google Scholar]
- Yang H., Wang H., Ren J., Chen Q., Chen Z.J. cGAS is essential for cellular senescence. Proc. Natl. Acad. Sci. USA. 2017;114:E4612–E4620. doi: 10.1073/pnas.1705499114. [DOI] [PMC free article] [PubMed] [Google Scholar]
Associated Data
This section collects any data citations, data availability statements, or supplementary materials included in this article.
Supplementary Materials
HeLa cells stably expressing H2B-mCherry (red) and GFP-cGAS (green). One cell is going through mitosis.
HeLa cell expressing GFP-cGAS (green) and H2B-mCherry (red) going through mitosis. Scale bar is 10μm.
HeLa cells stably expressing H2B-mCherry (red) and GFP-cGAS (green). One cell is going through mitosis followed by the next interphase, showing decay of nuclear GFP-cGAS after mitosis. Red indicates nuclear mask. Blue corona indicates cytoplasmic mask.
HeLa cells stably expressing GFP-cGAS ΔK173-I220ΔH390-C405 (green) labeled with siR-DNA (red). Various cells are going through mitosis. Time is hh:mm. Scale bar is 10μm.
HeLa cells expressing BFP2A-STING (not shown), GFP-IRF3 (green) and mCherry-cGAS E225A/D227A labeled with siR-DNA and transfected with 4μg/ml of HT-DNA. Transfection has been performed at time = 0 min. Scale bar is 10μm.
HeLa cells expressing BFP2A-STING (not shown), GFP-IRF3 (green) and mCherry-cGAS E225A/D227A confined at 3μm height. The cells were confined and the movie was started after compression. Foci of mCherry-cGAS at the nucleus identify NE ruptures. NE rupture events increase during time. Rapid flashes of GFP-IRF3 in and out of the nucleus correspond to events of NE rupture. Scale bar is 10μm.
HeLa cells expressing BFP2A-STING (not shown), GFP-IRF3 (green) and mCherry-cGAS E225A/D227A confined at 3μm height and transfected with 4μg/ml of HT-DNA. Rapid flashes of GFP-IRF3 in and out of the nucleus correspond to events of NE rupture. Cells with GFP-IRF3 translocation show bright GFP foci in the cytoplasm, followed by nuclear translocation. Scale bar is 10μm.
HeLa cells expressing BFP2A-STING (not shown), GFP-IRF3 (green) and mCherry-cGAS E225A/D227A transfected with 4μg/ml of HT-DNA. Cells were transfected and the movie was started. Cells with GFP-IRF3 translocation show bright GFP foci in the cytoplasm, followed by nuclear translocation. Scale bar is 10μm.
Data Availability Statement
The accession number for the raw data files of the ChIP-seq experiments reported in this paper is NCBI GEO: GSE125475.