Abstract
Aim
The role of surgery in the treatment of metastatic pancreatic neuroendocrine tumors (PNETs) was controversial. The objectives of this study were to illustrate the impact of surgery in improving the prognosis of patients with metastatic PNETs and build nomograms to predict overall survival (OS) and cancer-specific survival (CSS) based on a large population-based cohort.
Methods
Patients diagnosed with metastatic PNETs between 2004 and 2015 from the Surveillance, Epidemiology, and End Results (SEER) database were retrospectively collected. Nomograms for estimating OS and CSS were established based on Cox regression model and Fine and Grey’s model. The precision of the nomograms was evaluated and compared using concordance index (C-index) and the area under receiver operating characteristic (ROC) curve (AUC).
Results
The study cohort included 1966 patients with metastatic PNETs. It was shown that the surgery provided survival benefit for all groups of patients with metastatic PNETs. In the whole study cohort, 1-, 2- and 3-year OS and CSS were 51.5, 37.1 and 29.4% and 53.0, 38.9 and 31.1%, respectively. The established nomograms were well calibrated, and had good discriminative ability, with C-indexes of 0.773 for OS prediction and 0.774 for CSS prediction.
Conclusions
Patients with metastatic PNETs could benefit from surgery when the surgery tolerance was acceptable. The established nomograms could stratify patients who were categorized as tumor-node-metastasis (TNM) IV stage into groups with diverse prognoses, showing better discrimination and calibration of the established nomograms, compared with 8th TNM stage system in predicting OS and CSS for patients with metastatic PNETs.
Keywords: pancreatic neuroendocrine tumor, metastasis, surgery, competing risk analysis
Introduction
Pancreatic neuroendocrine tumors (PNETs) are rare and represent 1.3 to 10.0% of all pancreatic tumors. The annual incidence of PNET is around 3.65/10,000 people and it has been increasing over the last decades (1, 2, 3). The PNETs can be broadly categorized as functioning and nonfunctioning tumors, which account for a large part of patients and had more aggressive behavior. As a group of generally indolent epithelial neoplasms, they have the ability to metastasis. Moreover, most of the PNETs were often diagnosed at late stages because of the absence of specific symptoms. About 40–80% of patients were diagnosed with metastatic PNETs. Liver is the most common metastatic site, which accounts for 40–93% of all metastases, followed by bone (12–20%) and lungs (8–10%) (4). Thus, the management of metastatic PNETs occupies a critical position within the treatment of patients with PNETs. It was reported that the metastatic sites are not infiltrative, but expansive. The surrounding organs such as liver and lung are pushed aside by these metastatic sites, making it possible to remove tumor from the surrounding liver and lung tissues and essentially enucleating them (5). Moreover, different from metastatic pancreatic adenocarcinoma, the primary source of mortality of metastatic PNETs is mainly the dysfunction of metastatic organs, such as liver failure (6). Although the presence of distant metastasis is correlated with shortened long-term survival, the appropriately selected metastatic organ-directed therapies may provide survival benefit for patients with metastatic PNETs (7). There were some studies which reported that patients with metastatic PNETs could benefit from surgical approach (8, 9). While due to the small numbers of included patients and the absence of unified standards, it is still unclear how much benefit can be obtained from surgery for patients with metastatic PNETs.
PNET is a heterogeneous group of tumors and differs both biologically and clinically from pancreatic adenocarcinoma (2, 10). The clinical and pathological features of metastatic PNET remain ill-defined because of the low incidence of PNET. Moreover, the America Joint Commission on Cancer (AJCC) 8th edition tumor-node-metastasis (TNM) stage (11), which is widely used for prognostic evaluation of PNETs, is designed specifically for pancreatic adenocarcinoma and only takes tumor size and distant metastasis into account. In addition, the 8th edition TNM stage functions better in diagnosis compared with predicting survival. As for patients with metastatic PNETs, maybe more factors apart from the variables of TNM stage system, such as age, tumor grade and treatment, should be considered when evaluating prognosis of these patients. In addition, patients with PNET usually had better survival due to the indolent feature of PNET, compared with pancreatic adenocarcinoma. Also, the prolonged survival will bring about a high risk of competing non-cancer events, such as high rates of comorbidities, for older patients with PNET (12). However, these competing events are often treated as censorings by Kaplan–Meier (K–M) method, which is the most frequently used method to analyze survival and often overestimates the probabilities of cancer-specific death (13, 14). Failure to take competing risks into account may lead to misleading conclusions in survival analyses (15). In this sense, it is necessary to develop a stage system which considers competing risks in predicting prognosis of patients with metastatic PNETs.
Nomogram is a simple graphical presentation of multivariate predictive model and can be used to show the impact of each factor on an outcome of interest (16). It has been widely adopted as a useful predictive tool for survival analysis for cancers (17, 18, 19). In the current work, competing risk analyses for patients with metastatic PNET were constructed and the nomograms were built to investigate overall survival (OS) and cancer-specific survival (CSS) of these patients.
Materials and methods
Patients
Patients diagnosed with metastatic PNET from 2004 to 2015 were retrospectively collected from the SEER database in this study. Inclusion criteria based on International Classification of Diseases for Oncology were as follows, Third Edition (ICD-O-3), histology code: 8012, 8013, 8041, 8150, 8151, 8152, 8153, 8155, 8156, 8240, 8241, 8243, 8244, 8245, 8246 and 8249; and the ICD-O-3 site code C25.0, C25.1, C25.2, C25.3, C25.4, C25.7, C25.8 and C25.9. The exclusion criteria were as follows: (1) patients with second primary cancer; (2) age at diagnosis younger than 18 years; (3) patients not pathologically diagnosed; (4) patients with missing or incomplete information about survival, follow-up months, cause of death or other characteristics. Three-fourths of patients were randomly selected to form the training cohort to develop the nomograms, and the rest of patients were selected to serve as an internal validation cohort. Institutional review board approval and informed consent are not required in the current study because SEER research data is publicly available and all patient data are de-identified.
Data collection
The following data were extracted from SEER database: age at diagnosis, gender, surgery information, tumor site, tumor grade, tumor size, TNM stage, follow-up information and cause of death. OS was defined as survival time until death by any cause or last follow-up and CSS was defined as survival time until death due to PNET.
Statistical analysis
Statistical analysis were conducted by SPSS version 22 (SPSS Inc., Chicago, IL, USA) and R version 3.4.2 software (The R Foundation for Statistical Computing, Vienna, Austria; http://www.r-project.org). The OS depicted by MedCalc software version 11.4.2.0 (http://www.medcalc.be) was analyzed using K–M curves and compared with long-rank test. Cancer-specific mortality and non-cancer-specific mortality were treated as two competing events. Fine and Grey’s model were adopted to evaluate the cumulative incidence function (CIF) of the variables on cancer-specific mortality and non-cancer-specific mortality (20, 21). Hazard ratio (HR) and the associated 95% confidence interval (CI) were calculated. A two tailed P value <0.05 was considered statistically significant.
Independent risk factors identified in the multivariate analysis were used to construct nomogram to predict OS. Competing risk nomogram was built on the basis of Fine and Grey’s model. The discrimination and calibration power were two important aspects of the performance of the established nomograms and they were evaluated by concordance index (C-index) and calibration curves (22, 23), respectively. The C-index reflected the probability of changes of the predicted survival along with the variation of predicted scores (22). The calibration curves were used to compare the predicted probability with the observed probability. Bootstraps with 1000 resamples were used for the validation of the nomograms and the area under receiver operating characteristic (ROC) curve (AUC) were used to evaluate the 1-, 2- and 3-year survival predictions.
Results
Patient characteristics
According to the whole criteria above, we identified 1966 eligible PNET patients diagnosed from 2004 to 2015 in the SEER database. There were 1474 patients in the training cohort and another 492 patients in the validation cohort. For the whole study population, the median age was 61 years old and 51.9% of patients were older than 60 years old. Majority of patients (55.1%) were male. A large proportion (56.7%) of patients had tumors that were larger than 4 cm and poor differentiation was the most common tumor grade (44.3%). Lymph node (LN) metastasis was observed in 908 (46.2%) patients and most of patients (72.2%) were classified as T stage III and IV in the TNM stage system. The baseline characteristics of the training cohort and validation cohort were shown as Table 1 and they were all comparable between training and validation cohort.
Table 1.
The comparison of clinicopathological factors between training cohort and validation cohort.
| Characteristic | N | Patients | P | |
|---|---|---|---|---|
| Training cohort | Validation cohort | |||
| Total | 1966 | 1474 | 492 | |
| Age (years) | ||||
| ≤60 | 946 | 705 | 241 | 0.677 |
| >60 | 1020 | 769 | 251 | |
| Gender | ||||
| Male | 1084 | 815 | 269 | 0.834 |
| Female | 882 | 659 | 223 | |
| Surgery | ||||
| No | 1695 | 1271 | 424 | 0.978 |
| Yes | 271 | 203 | 68 | |
| Surgery | ||||
| No | 1619 | 1215 | 404 | 0.964 |
| Recommended, but no | 76 | 56 | 20 | |
| Yes | 271 | 203 | 68 | |
| Tumor site | ||||
| Head | 883 | 655 | 228 | 0.775 |
| Body | 300 | 231 | 69 | |
| Tail | 783 | 588 | 195 | |
| Tumor grade | ||||
| Well | 700 | 513 | 197 | 0.646 |
| Moderate | 396 | 305 | 91 | |
| Poor | 870 | 656 | 214 | |
| Tumor size (cm) | ||||
| ≤2 | 150 | 107 | 43 | 0.585 |
| 2–4 | 702 | 526 | 176 | |
| >4 | 1114 | 841 | 273 | |
| T stage (8th) | ||||
| I | 56 | 39 | 17 | 0.725 |
| II | 490 | 374 | 116 | |
| III | 1098 | 825 | 273 | |
| IV | 322 | 236 | 86 | |
| LN metastasis | ||||
| Absent | 1058 | 785 | 273 | 0.476 |
| Present | 908 | 689 | 219 | |
| Survival status | ||||
| Alive | 497 | 372 | 125 | 0.952 |
| Dead | 1469 | 1102 | 367 | |
| Survival status | ||||
| Alive | 497 | 372 | 125 | 0.976 |
| Cancer-specific death | 1398 | 1048 | 350 | |
| Non-cancer-specific death | 71 | 54 | 17 | |
LN, lymph node.
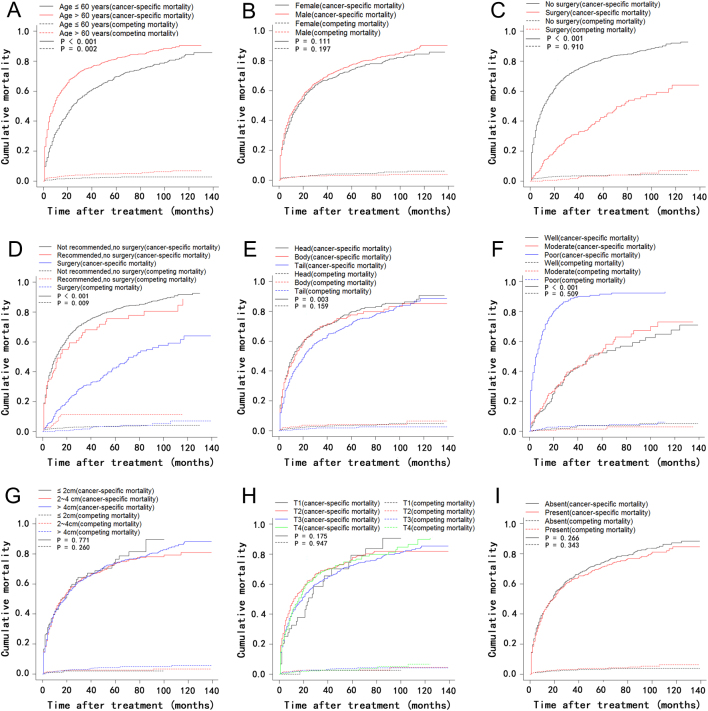
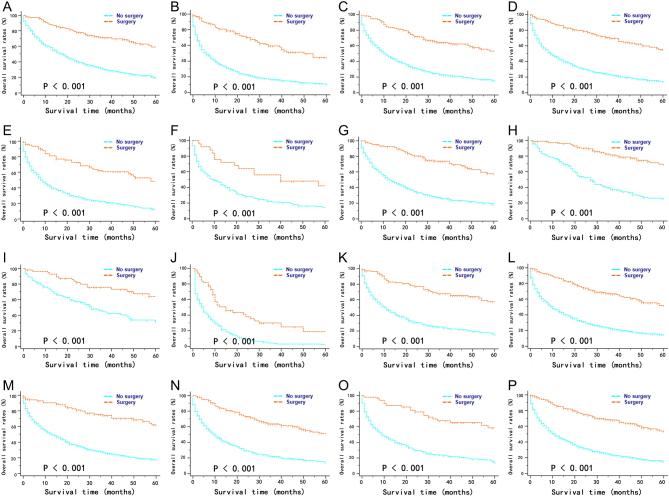
The median follow-up time was 10 months (range, 1–139 months). There were 1469 patient deaths during the follow-up period: 1398 cancer-specific mortality and 71 competing mortality. In the whole study cohort, 1-, 2- and 3-year OS and CSS were 51.5, 37.1 and 29.4% and 53.0, 38.9 and 31.1%, respectively, while 1-, 2- and 3-year cancer-specific mortalities and non-cancer-specific mortalities were 46.4, 60.0 and 67.4% and 2.0, 2.8 and 3.2%, respectively. The corresponding CIF curves were shown in Fig. 1. The cumulative probabilities of death from PNET increased with the increasing ages at diagnosis. Compared with well-differentiated tumor, poorly differentiated tumor was also associated with higher cancer-specific mortalities. Moreover, it was shown that patients had lower mortality from PNETs after surgery. This result was also proved in the K–M analyses of OS, which indicated that surgery provided better survival to patients with metastatic PNETs (Fig. 2). In addition, patients with older ages or patients who were recommended to have surgery but have no surgery finally had relative higher rates of other causes of mortality. The comparison of OS and CSS stratified by surgery or not in different groups of patients was summarized in Table 2. In all groups of patients, surgery could provide survival benefit for patients with metastatic PNET in this study (Fig. 3).
Figure 1.
Cumulative cancer-specific and competing mortality according to patient characteristics: (A) age; (B) gender; (C) surgery; (D) surgery; (E) tumor site; (F) tumor grade; (G) tumor size; (H) T stage (8th); (I) LN metastasis. LN, lymph node.
Figure 2.
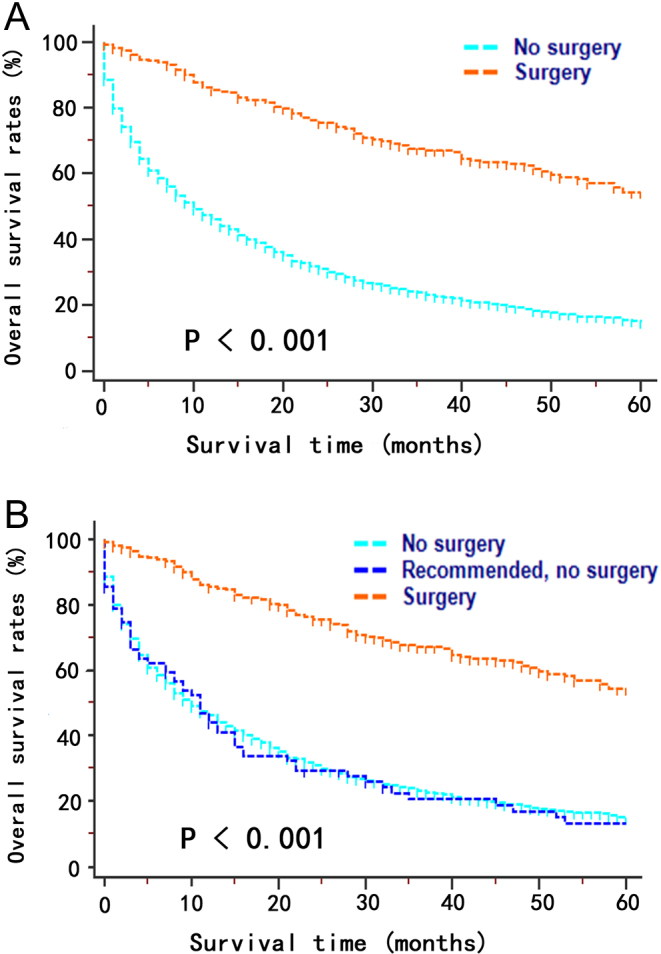
Kaplan–Meier curves for overall survival stratified by different status of surgery in patients with metastatic pancreatic neuroendocrine tumors. (A) Surgery vs no surgery; (B) surgery vs recommended, no surgery vs no surgery.
Table 2.
Overall survival rates and cancer-specific survival of patients with PNETs stratified by surgery or not.
| Characteristic | Levels | OS | Median survival time (months) | P | Hazard ratio (95% CI) | CSS | Median survival time (months) | P | Hazard ratio (95% CI) | |||||
|---|---|---|---|---|---|---|---|---|---|---|---|---|---|---|
| 1-year | 2-year | 3-year | 1-year | 2-year | 3-year | |||||||||
| Whole cohort | No surgery | 46.0 | 30.8 | 23.0 | 10 | <0.001 | 3.17 (2.81–3.58) | 47.6 | 32.6 | 24.6 | 11 | <0.001 | 3.28 (2.89–3.71) | |
| Surgery | 85.4 | 75.4 | 67.1 | 68 | 85.8 | 76.1 | 68.6 | 71 | ||||||
| Age (years) | ≤60 | No surgery | 58.3 | 40.6 | 30.8 | 18 | <0.001 | 2.93 (2.47–3.48) | 59.4 | 41.9 | 32.2 | 19 | <0.001 | 2.95 (2.48–3.51) |
| Surgery | 88.1 | 78.3 | 71.2 | 75 | 88.7 | 78.8 | 72.3 | 81 | ||||||
| >60 | No surgery | 37.6 | 24.6 | 18.1 | 7 | <0.001 | 3.42 (2.83–4.14) | 35.8 | 22.7 | 16.5 | 6 | <0.001 | 3.13 (2.60–3.76) | |
| Surgery | 80.7 | 71.3 | 61.5 | 61 | 80.7 | 70.1 | 59.4 | 50 | ||||||
| Gender | Female | No surgery | 46.7 | 31.5 | 23.1 | 11 | <0.001 | 3.04 (2.55–3.63) | 48.4 | 33.1 | 25.0 | 11 | <0.001 | 3.14 (2.62–3.77) |
| Surgery | 83.9 | 72.1 | 64.5 | 63 | 84.7 | 73.5 | 66.6 | 71 | ||||||
| Male | No surgery | 45.5 | 30.3 | 23.0 | 9 | <0.001 | 3.30 (2.79–3.91) | 47.0 | 32.1 | 24.3 | 10 | <0.001 | 3.39 (2.86–4.03) | |
| Surgery | 87.0 | 78.8 | 69.9 | 70 | 87.0 | 78.8 | 70.7 | 78 | ||||||
| Tumor site | Head | No surgery | 42.1 | 28.8 | 22.3 | 9 | <0.001 | 2.87 (2.30–3.58) | 43.1 | 30.2 | 23.5 | 9 | <0.001 | 3.03 (2.42–3.80) |
| Surgery | 81.2 | 72.7 | 60.5 | 58 | 82.5 | 75.4 | 64.1 | 63 | ||||||
| Body | No surgery | 46.3 | 28.2 | 21.1 | 10 | <0.001 | 2.29 (1.56–3.37) | 48.4 | 30.5 | 22.9 | 12 | <0.001 | 2.45 (1.64–3.66) | |
| Surgery | 76.0 | 64.0 | 56.0 | 40 | 76.0 | 64.0 | 56.0 | 57 | ||||||
| Tail | No surgery | 51.1 | 35.0 | 26.7 | 13 | <0.001 | 3.25 (2.61–4.05) | 51.6 | 36.1 | 28.1 | 13 | <0.001 | 3.21 (2.57–4.01) | |
| Surgery | 92.5 | 80.5 | 73.9 | 75 | 92.5 | 80.5 | 73.9 | 75 | ||||||
| Tumor size (cm) | ≤4 | No surgery | 46.3 | 30.7 | 24.7 | 11 | <0.001 | 3.26 (2.65–4.02) | 47.7 | 31.9 | 25.7 | 11 | <0.001 | 3.38 (2.74–4.18) |
| Surgery | 82.9 | 77.0 | 67.8 | 71 | 83.9 | 78.9 | 69.4 | 78 | ||||||
| >4 | No surgery | 45.9 | 30.9 | 22.4 | 10 | <0.001 | 3.03 (2.60–3.53) | 47.6 | 32.8 | 24.2 | 11 | <0.001 | 3.14 (2.68–3.67) | |
| Surgery | 87.1 | 74.2 | 66.7 | 63 | 87.1 | 74.2 | 68.1 | 68 | ||||||
| T stage (8th) | I + II | No surgery | 44.6 | 30.0 | 23.4 | 9 | <0.001 | 3.37 (2.56–4.44) | 45.9 | 31.4 | 24.5 | 10 | <0.001 | 3.76 (2.84–4.97) |
| Surgery | 87.5 | 79.0 | 67.9 | 71 | 89.5 | 83.0 | 71.3 | 78 | ||||||
| III + IV | No surgery | 47.6 | 32.1 | 24.0 | 11 | <0.001 | 3.11 (2.67–3.61) | 49.2 | 34.0 | 25.6 | 12 | <0.001 | 3.13 (2.68–3.66) | |
| Surgery | 85.5 | 75.3 | 68.0 | 64 | 85.5 | 75.3 | 68.5 | 70 | ||||||
| LN metastasis | Absent | No surgery | 51.4 | 36.0 | 27.1 | 13 | <0.001 | 3.39 (2.74–4.20) | 52.8 | 37.6 | 28.5 | 14 | <0.001 | 3.45 (2.77–4.29) |
| Surgery | 90.2 | 81.2 | 74.2 | 71 | 90.2 | 81.2 | 75.5 | 75 | ||||||
| Present | No surgery | 44.9 | 29.2 | 22.0 | 10 | <0.001 | 3.04 (2.53–3.65) | 46.5 | 31.1 | 23.8 | 11 | <0.001 | 3.11 (2.57–3.75) | |
| Surgery | 84.2 | 73.1 | 63.7 | 63 | 84.8 | 74.2 | 65.2 | 68 | ||||||
CI, confidence interval; CSS, cancer-specific survival; OS, overall survival; PNET, pancreatic neuroendocrine tumors; other abbreviations as in Table 1.
Figure 3.
Kaplan–Meier curves for overall survival stratified by surgery or not in different groups of patients: (A) age ≤60 years; (B) age >60 years; (C) female; (D) male; (E) PNET of pancreatic head; (F) PNET of pancreatic body; (G) PNET of pancreatic tail; (H) well-differentiated tumor; (I) moderately differentiated tumor; (J) poorly differentiated tumor; (K) tumor size ≤4 cm; (L) tumor size >4 cm; (M) LN negative; (N) LN positive; (O) T stage (8th) I + II; (P) T stage (8th) III + IV. LN, lymph node; PNET, pancreatic neuroendocrine tumor.
Nomogram construction
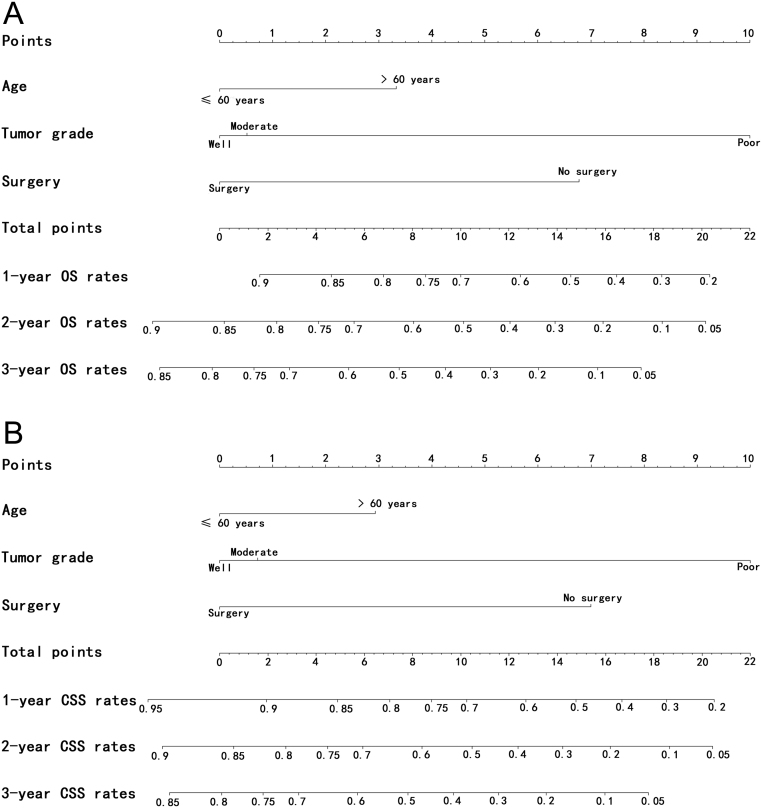
In assessing the 1474 patients in the training cohort, univariate analysis showed that several factors were associated with OS (Table 3). In addition, the multivariate analysis showed that age (HR = 1.58, 95% CI = 1.30–1.93, P < 0.001), tumor grade (HR = 1.83, 95% CI = 1.66–2.03, P < 0.001) and surgery (HR = 0.24, 95% CI = 0.10–0.62, P = 0.003) remained independent prognostic factors for OS. Proportional subdistribution hazard assumption was held for variables in CSS analysis. Age (HR = 1.49, 95% CI = 1.21–1.83, P < 0.001), tumor grade (HR = 1.85, 95% CI = 1.67–2.05, P < 0.001) and surgery (HR = 0.25, 95% CI = 0.10–0.65, P = 0.005) were independently associated with CSS. Nomograms for predicting 1-, 2- and 3-year OS and CSS were constructed based on the independent prognostic factors in the multivariate analyses (Fig. 4). It was shown that tumor grade contributed most to prognosis, followed by surgery and age in predicting OS and CSS.
Table 3.
Univariate and multivariate analyses of survival in patients with PNETs.
| Characteristic | OS | CSS | |||||||||||
|---|---|---|---|---|---|---|---|---|---|---|---|---|---|
| Univariate analysis | Multivariate analysis | Univariate analysis | Multivariate analysis | ||||||||||
| HR | 95% CI | P | HR | 95% CI | P | HR | 95% CI | P | HR | 95% CI | P | ||
| Age (years) | ≤60/>60 | 1.77 | 1.59–1.96 | <0.001 | 1.58 | 1.30–1.93 | <0.001 | 1.72 | 1.55–1.91 | <0.001 | 1.49 | 1.21–1.83 | <0.001 |
| Gender | Female/male | 1.06 | 0.96–1.18 | 0.254 | NI | 1.08 | 0.97–1.20 | 0.156 | NI | ||||
| Surgery | No surgery/surgery | 0.30 | 0.25–0.37 | <0.001 | 0.24 | 0.10–0.62 | 0.003 | 0.29 | 0.24–0.36 | <0.001 | 0.25 | 0.10–0.65 | 0.005 |
| Surgery | No/recommended, but no/surgery | 0.58 | 0.53–0.63 | <0.001 | 1.20 | 0.75–1.92 | 0.438 | 0.56 | 0.52–0.62 | <0.001 | 1.18 | 0.73–1.91 | 0.494 |
| Tumor site | Head/body/tail | 1.009 | 0.98–1.05 | 0.599 | NI | 1.00 | 0.97–1.04 | 0.837 | NI | ||||
| Tumor grade | Well/moderately/poorly | 1.91 | 1.75–2.09 | <0.001 | 1.83 | 1.66–2.03 | <0.001 | 1.92 | 1.75–2.10 | <0.001 | 1.85 | 1.67–2.05 | <0.001 |
| Tumor size | ≤4 cm/≥4 cm | 1.03 | 0.93–1.14 | 0.621 | NI | 1.01 | 0.91–1.12 | 0.893 | NI | ||||
| T stage (8th) | T1/T2/T3/T4 | 0.98 | 0.90–1.07 | 0.645 | NI | 0.98 | 0.90–1.06 | 0.564 | NI | ||||
| LN metastasis | Absent/present | 0.87 | 0.79–0.96 | 0.005 | 1.05 | 0.89–1.25 | 0.549 | 0.86 | 0.78–0.95 | 0.002 | 0.87 | 0.85–1.21 | 0.868 |
HR, hazard ratio; NI, not included; other abbreviations as in Table 2.
Figure 4.
Nomograms predicting 1-, 2- and 3-year OS (A) and CSS (B) of patients with metastatic pancreatic neuroendocrine tumor. CSS, cancer-specific survival; OS, overall survival.
Nomogram validation
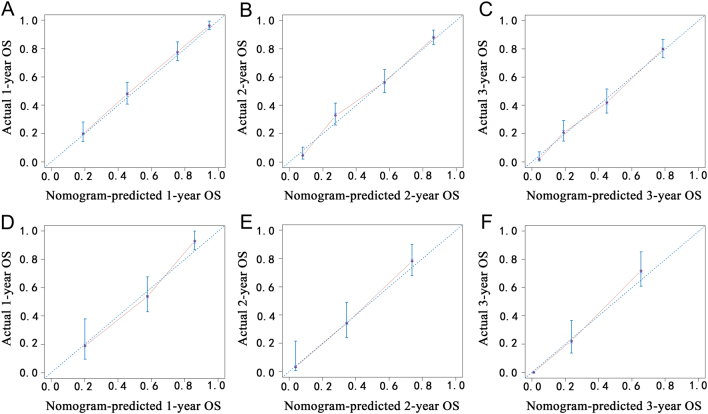
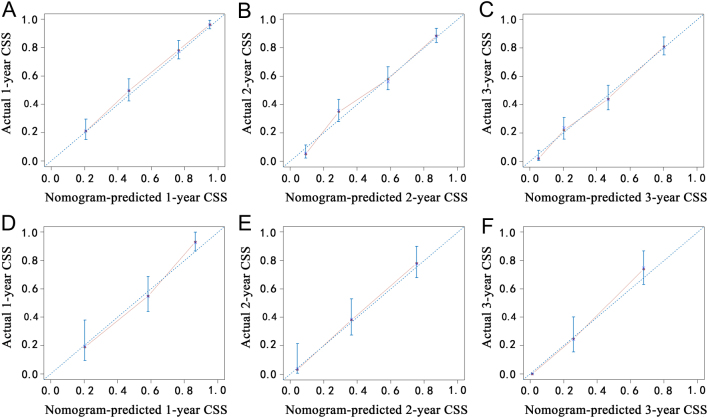
The nomogram demonstrated good accuracy for OS prediction, with a C-index of 0.773 (95% CI, 0.753–0.793). The internal calibration plots revealed good correlation between the predictions estimated by nomogram and actual observation in both training and validation cohorts (Fig. 5). The C-index of nomogram for CSS prediction was 0.774 (95% CI, 0.753–0.795). An optimal agreement of calibration curves was also observed for CSS probabilities in both training and validation cohorts (Fig. 6). Moreover, the C-indexes for OS and CSS prediction in the validation cohort were also as high as 0.764 (95% CI, 0.726–0.802) and 0.773 (95% CI, 0.735–0.811), respectively.
Figure 5.
Calibration plots of the nomogram for 1-, 2- and 3-year OS prediction in the training cohort (A, B and C) and validation cohort (D, E and F). X-axis represents the nomogram-predicted probability of survival; Y-axis represents the actual OS probability. A perfectly accurate nomogram prediction model would result in a plot that the observed and predicted probabilities for given groups fall along the 45-degree line. Dots with bars represent nomogram-predicted probabilities along with 95% confidence interval. OS, overall survival.
Figure 6.
Calibration plots of the nomogram for 1-, 2- and 3-year CSS prediction in the training cohort (A, B and C) and validation cohort (D, E and F). CSS, cancer-specific survival.
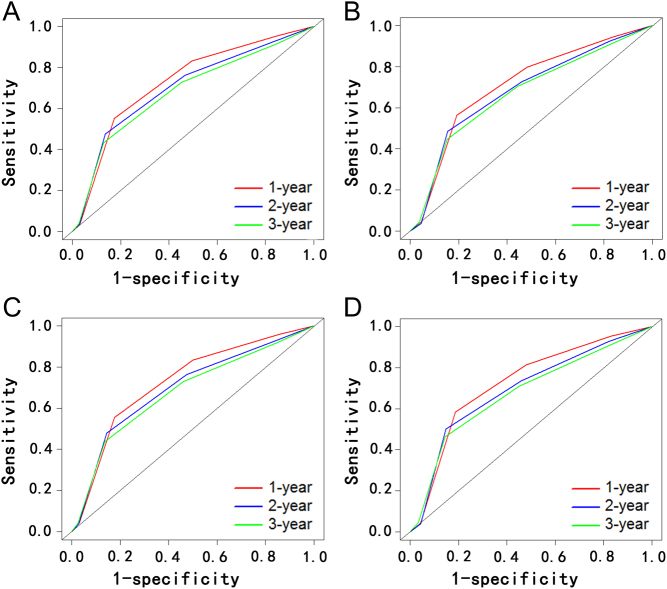
In the next step, two ROC models of OS and CSS regarding the prediction ability were compared (Fig. 7), indicating that the values of AUC were 0.728, 0.702 and 0.683; 0.729, 0.698 and 0.681, respectively, for predicting 1-, 2 and 3-year OS and CSS. Regarding the validation cohort, the values of AUC of the nomogram for predicting 1-, 2 and 3-year OS and CSS were 0.711, 0.684 and 0.671; 0.726, 0.696 and 0.679, respectively.
Figure 7.
Comparison of the ROC curves of the nomogram for 1-, 2- and 3-year OS prediction in the training cohort (A) and validation cohort (B); CSS prediction in the training cohort (C) and validation cohort (D). CSS, cancer-specific survival; OS, overall survival.
Discussion
The annual incidence of all PNETs is steadily on the rise (24). PNETs are a group of highly heterogeneous neoplasms presenting a spectrum of biological behavior (25, 26). Although PNETs are generally indolent, distant metastasis was detected in a large proportion of patients when PNETs were diagnosed (4). There are a diverse range of therapeutic modalities for the treatment of PNETs, including medical therapies and interventional radiological techniques (27). However, due to the small number of included patients (28, 29), the optional treatment for metastatic PNETs is still debated. Moreover, Lesurtel et al. illustrated that there were only small numbers of studies which compared the efficacy of surgery and other therapies (30). Whether surgery can provide survival benefit for patients with metastatic PNETs or not remained unclear. Most studies which focused on the surgery treatment for patients with metastatic PNETs were not able to identify prognostic factors for patients (7). Moreover, many survival analyses focused only one survival end point (12, 31) and ignored the competing events which would lead to some misunderstanding on survival evaluation, especially for patients with increasing ages (32). In this study, it was shown that patients with different clinical and pathological characteristics could all benefit from surgery. In addition, using one of the largest reported series, to date, of patients with metastatic PNETs from the SEER database, we evaluated the mortality of patients and built nomograms to predict OS and CSS for patients with metastatic PNETs. The established nomograms could stratify patients who were categorized as TNM IV stage into groups with diverse prognoses, showing better discrimination and calibration of the established nomograms, compared with 8th edition TNM stage system in predicting OS and CSS.
Deaths as a result of other causes other than PNETs were treated as competing risk events in this study, which could preclude the possibility of death resulting from PNETs. However, these competing events which were treated as censoring by K–M analysis would certainly lead to bias due to the differences of risks from censors as a result of competing risks compared with the non-censored population (33). It was shown that patients who were recommended to receive surgery but had no surgery finally had extremely high rates of non-cancer-specific mortality in this study. Maybe the comorbidities which prevented these patients from receiving surgery led to more deaths from non-cancer causes. Moreover, age-related comorbidities contribute to most of the competing risk events. As the improved prognosis of patients with PNETs, more than half of patients were older than 60 years old in this study. Thus, competing risks should be considered in the analysis of prognosis of patients. It was found that older patients were more likely to die of metastatic PNETs. This negative effect was even more obvious on OS compared with CSS. This result was consistent with other published studies (34, 35). The age-related comorbidities not only led to more non-cancer-specific mortalities, but also prevented patients from receiving the same standards of care that were provided for young patients (36). Moreover, it was indicated that the increasing ages were independently prognostic factors of survival in this study. Thus, although surgery is good for patients with metastatic PNETs, it is important to evaluate surgery tolerance among older patients. In addition, it was appropriate and necessary to consider age when evaluating prognosis of patients with metastatic PNETs.
It was shown that patients with metastatic PNETs after surgery had better prognosis compared with patients who did not receive surgery. Moreover, surgery was identified to be a prognostic factor for patients with metastatic PNETs, which was independent from the LN metastasis or distant metastasis, illustrating that metastasis to other organ or LN should not be the contraindication of surgery. Interestingly, our study showed that patients who did not receive surgery treatment had similar prognosis, no matter they were recommended to have surgery before or were diagnosed at late stages at the first time, showing that some common pathological factors, such as tumor size and LN metastasis, had little impact on prognosis of these patients. This conclusion was also in accordance with the results of multivariate analysis in this study. Surgery could provide survival benefit for patients with different levels of tumor sizes or LN metastasis. In this sense, unlike pancreatic adenocarcinoma, large tumor or presence of LN metastasis also should not be the contraindication of surgery in patients with metastatic PNETs.
In the present nomograms, tumor grade was also shown to predict independently both OS and CSS, which was consistent to the previous reports (18, 37). Grade reflected tumor biological behavior and was included in the 8th edition TNM stage system (11). In the presence of metastasis, tumor grade, an inherent characteristic of tumor, weighted more in determination of prognosis compared with other common tumor characteristics, such as tumor size and LN metastasis. Moreover, the inclusion of these additional variables certainly contributed to the superior power of nomograms in predicting OS and CSS, compared with 8th edition TNM stage.
It is well known that patient counseling and decision are based on the prognosis estimated from the individual risk profiles (38). Nomogram is a novel form of stage system which can help to provide personal medical decision-making and has been used in analyses in various kinds of cancers (17, 19). In addition, competing risk analysis, which has been used for many tumor, such as pancreatic cancer (18), lung cancer (34) and melanoma (39), should be considered in survival analysis for patients with PNETs. However, no study previously evaluated the competing prognostic factors for patients with metastatic PNETs. In this study, competing risk nomogram was established for the first time and showed good discrimination with relatively high C-indexes and values of AUC for predicting OS and CSS in the training and validation cohort. The calibration plots also demonstrated that the predicted probability of the nomograms corresponded well with the observed OS and CSS. In addition, analysis on the basis of data from a population-based dataset and cross-validation from another dataset made our results more generable than studies from single center. Thus, physicians assess a diverse range of parameters of patients with more objectives and precision for patients with metastatic PNETs using the established nomograms, which can identify subgroups of patients with more homogeneous prognoses. The nomograms can be used to estimate individual survival and specialize personal treatment.
There were several limitations that should be noted. The major limitation of the present study is that the variables used to construct the nomograms only represented some of the clinical and pathological features. Some important tumor biomarkers, such as Ki-67 index, and some positive prognostic variables, such as surgical margin status and vascular invasion, were unavailable in SEER dataset. We acknowledge that certain additional variables (e.g. pathological factors or molecular biomarkers) might provide potential predictive information. This is also the major part of our future research. Another limitation is that although the established nomograms showed good discrimination and validation, further validation based on large-scale external cohort is needed for these nomograms.
In conclusion, the comparisons of survival analyses and competing risk analyses were conducted based on the SEER database in this study. It was showed that surgery should be recommended for patients with metastatic PNETs when the surgery tolerance was acceptable. We also developed a novel clinical tool to predict both OS and CSS of patients with metastatic PNETs for the first time. Using nomograms including only three clinicopathological variables, we classified patients into various groups with different prognoses. Moreover, our relatively well-validated nomograms might help to facilitate highly tailored patient management for patients with metastatic PNETs in clinical practice.
Declaration of interest
The authors declare that there is no conflict of interest that could be perceived as prejudicing the impartiality of the research reported.
Funding
This work was supported by School of Sociology and Anthropology-Sun Yat-sen University Cancer Center Joint Foundation on Medical Humanities (No. 201804, No. 201816).
References
- 1.Frilling A, Modlin IM, Kidd M, Russell C, Breitenstein S, Salem R, Kwekkeboom D, Lau WY, Klersy C, Vilgrain V, et al Recommendations for management of patients with neuroendocrine liver metastases. Lancet Oncology 2014. 15 e8–e21. ( 10.1016/S1470-2045(13)70362-0) [DOI] [PubMed] [Google Scholar]
- 2.Sandvik OM, Soreide K, Gudlaugsson E, Kvaloy JT, Soreide JA. Epidemiology and classification of gastroenteropancreatic neuroendocrine neoplasms using current coding criteria. British Journal of Surgery 2016. 103 226–232. ( 10.1002/bjs.10034) [DOI] [PMC free article] [PubMed] [Google Scholar]
- 3.Vagefi PA, Razo O, Deshpande V, McGrath DJ, Lauwers GY, Thayer SP, Warshaw AL, Fernandez-Del Castillo C. Evolving patterns in the detection and outcomes of pancreatic neuroendocrine neoplasms: the Massachusetts General Hospital experience from 1977 to 2005. Archives of Surgery 2007. 142 347–354. ( 10.1001/archsurg.142.4.347) [DOI] [PMC free article] [PubMed] [Google Scholar]
- 4.Mazzaferro V, Pulvirenti A, Coppa J. Neuroendocrine tumors metastatic to the liver: how to select patients for liver transplantation? Journal of Hepatology 2007. 47 460–466. ( 10.1016/j.jhep.2007.07.004) [DOI] [PubMed] [Google Scholar]
- 5.Farley HA, Pommier RF. Treatment of neuroendocrine liver metastases. Surgical Oncology Clinics of North America 2016. 25 217–225. ( 10.1016/j.soc.2015.08.010) [DOI] [PubMed] [Google Scholar]
- 6.Thompson GB, van Heerden JA, Grant CS, Carney JA, Ilstrup DM. Islet cell carcinomas of the pancreas: a twenty-year experience. Surgery 1988. 104 1011–1017. [PubMed] [Google Scholar]
- 7.Mayo SC, de Jong MC, Pulitano C, Clary BM, Reddy SK, Gamblin TC, Celinksi SA, Kooby DA, Staley CA, Stokes JB, et al Surgical management of hepatic neuroendocrine tumor metastasis: results from an international multi-institutional analysis. Annals of Surgical Oncology 2010. 17 3129–3136. ( 10.1245/s10434-010-1154-5) [DOI] [PubMed] [Google Scholar]
- 8.Shimura M, Mizuma M, Takadate T, Katoh Y, Suzuki T, Iseki M, Hata T, Aoki S, Suzuki Y, Sakata N, et al A novel liver metastasis-correlated protein of pancreatic neuroendocrine neoplasm (PanNEN) discovered by proteomic analysis. Oncotarget 2018. 9 24291–24303. ( 10.18632/oncotarget.25110) [DOI] [PMC free article] [PubMed] [Google Scholar]
- 9.Sham JG, Ejaz A, Gage MM, Bagante F, Reames BN, Maithel S, Poultsides GA, Bauer TW, Fields RC, Weiss MJ, et al The impact of extent of liver resection among patients with neuroendocrine liver metastasis: an international multi-institutional study. Journal of Gastrointestinal Surgery 2018. ( 10.1007/s11605-018-3862-2) [DOI] [PubMed] [Google Scholar]
- 10.Cleary SP, Gryfe R, Guindi M, Greig P, Smith L, Mackenzie R, Strasberg S, Hanna S, Taylor B, Langer B, et al Prognostic factors in resected pancreatic adenocarcinoma: analysis of actual 5-year survivors. Journal of the American College of Surgeons 2004. 198 722–731. ( 10.1016/j.jamcollsurg.2004.01.008) [DOI] [PubMed] [Google Scholar]
- 11.Amin MB, Edge S, Greene F. AJCC Cancer Staging Manual, 8th ed Chicago, IL, USA: Springer, 2017. [Google Scholar]
- 12.Miao DL, Song W, Qian J, Zhu ZG, Wu Q, Lv CG, Chen L. Development and validation of a nomogram for predicting overall survival in pancreatic NeuroendocrineTumors. Translational Oncology 2018. 11 1097–1103. ( 10.1016/j.tranon.2018.06.012) [DOI] [PMC free article] [PubMed] [Google Scholar]
- 13.Gooley TA, Leisenring W, Crowley J, Storer BE. Estimation of failure probabilities in the presence of competing risks: new representations of old estimators. Statistics in Medicine 1999. 18 695–706. (doi:) [DOI] [PubMed] [Google Scholar]
- 14.Putter H, Fiocco M, Geskus RB. Tutorial in biostatistics: competing risks and multi-state models. Statistics in Medicine 2007. 26 2389–2430. ( 10.1002/sim.2712) [DOI] [PubMed] [Google Scholar]
- 15.Noordzij M, Leffondre K, van Stralen KJ, Zoccali C, Dekker FW, Jager KJ. When do we need competing risks methods for survival analysis in nephrology? Nephrology, Dialysis, Transplantation 2013. 28 2670–2677. ( 10.1093/ndt/gft355) [DOI] [PubMed] [Google Scholar]
- 16.Iasonos A, Schrag D, Raj GV, Panageas KS. How to build and interpret a nomogram for cancer prognosis. Journal of Clinical Oncology 2008. 26 1364–1370. ( 10.1200/JCO.2007.12.9791) [DOI] [PubMed] [Google Scholar]
- 17.He CB, Lao XM, Lin XJ. Transarterial chemoembolization combined with recombinant human adenovirus type 5 H101 prolongs overall survival of patients with intermediate to advanced hepatocellular carcinoma: a prognostic nomogram study. Chinese Journal of Cancer 2017. 36 59 ( 10.1186/s40880-017-0227-2) [DOI] [PMC free article] [PubMed] [Google Scholar]
- 18.He C, Zhang Y, Cai Z, Lin X, Li S. Overall survival and cancer-specific survival in patients with surgically resected pancreatic head adenocarcinoma: a competing risk nomogram analysis. Journal of Cancer 2018. 9 3156–3167. ( 10.7150/jca.25494) [DOI] [PMC free article] [PubMed] [Google Scholar]
- 19.He C, Mao Y, Wang J, Duan F, Lin X, Li S. Nomograms predict long-term survival for patients with periampullary adenocarcinoma after pancreatoduodenectomy. BMC Cancer 2018. 18 327 ( 10.1186/s12885-018-4240-x) [DOI] [PMC free article] [PubMed] [Google Scholar]
- 20.Gray RJ. A class of K-sample tests for comparing the cumulative incidence of a competing risk. Annals of Statistics 1988. 16 1141–1154. ( 10.1214/aos/1176350951) [DOI] [Google Scholar]
- 21.Fine JP, Gray RJ. A proportional hazards model for the subdistribution of a competing risk. Journal of the American Statistical Association 1999. 94 496–509. ( 10.1080/01621459.1999.10474144) [DOI] [Google Scholar]
- 22.Harrell FE, Jr, Lee KL, Mark DB. Multivariable prognostic models: issues in developing models, evaluating assumptions and adequacy, and measuring and reducing errors. Statistics in Medicine 1996. 15 361–387. (doi:) [DOI] [PubMed] [Google Scholar]
- 23.Pencina MJ, D’Agostino RB. Overall C as a measure of discrimination in survival analysis: model specific population value and confidence interval estimation. Statistics in Medicine 2004. 23 2109–2123. ( 10.1002/sim.1802) [DOI] [PubMed] [Google Scholar]
- 24.Dasari A, Shen C, Halperin D, Zhao B, Zhou S, Xu Y, Shih T, Yao JC. Trends in the incidence, prevalence, and survival outcomes in patients With neuroendocrine tumors in the United States. JAMA Oncology 2017. 3 1335–1342. ( 10.1001/jamaoncol.2017.0589) [DOI] [PMC free article] [PubMed] [Google Scholar]
- 25.Singh S, Dey C, Kennecke H, Kocha W, Maroun J, Metrakos P, Mukhtar T, Pasieka J, Rayson D, Rowsell C, et al Consensus recommendations for the diagnosis and management of pancreatic neuroendocrine tumors: guidelines from a Canadian National Expert Group. Annals of Surgical Oncology 2015. 22 2685–2699. ( 10.1245/s10434-014-4145-0) [DOI] [PubMed] [Google Scholar]
- 26.Wiedenmann B, Pavel M, Kos-Kudla B. From targets to treatments: a review of molecular targets in pancreatic neuroendocrine tumors. Neuroendocrinology 2011. 94 177–190. ( 10.1159/000329386) [DOI] [PubMed] [Google Scholar]
- 27.Frilling A, Clift AK. Therapeutic strategies for neuroendocrine liver metastases. Cancer 2015. 121 1172–1186. ( 10.1002/cncr.28760) [DOI] [PubMed] [Google Scholar]
- 28.Karabulut K, Akyildiz HY, Lance C, Aucejo F, McLennan G, Agcaoglu O, Siperstein A, Berber E. Multimodality treatment of neuroendocrine liver metastases. Surgery 2011. 150 316–325. ( 10.1016/j.surg.2011.05.008) [DOI] [PubMed] [Google Scholar]
- 29.Osborne DA, Zervos EE, Strosberg J, Boe BA, Malafa M, Rosemurgy AS, Yeatman TJ, Carey L, Duhaine L, Kvols LK. Improved outcome with cytoreduction versus embolization for symptomatic hepatic metastases of carcinoid and neuroendocrine tumors. Annals of Surgical Oncology 2006. 13 572–581. ( 10.1245/ASO.2006.03.071) [DOI] [PubMed] [Google Scholar]
- 30.Lesurtel M, Nagorney DM, Mazzaferro V, Jensen RT, Poston GJ. When should a liver resection be performed in patients with liver metastases from neuroendocrine tumours? A systematic review with practice recommendations. HPB 2015. 17 17–22. ( 10.1111/hpb.12225) [DOI] [PMC free article] [PubMed] [Google Scholar]
- 31.Ruzzenente A, Bagante F, Bertuzzo F, Aldrighetti L, Ercolani G, Giuliante F, Ferrero A, Torzilli G, Grazi GL, Ratti F, et al A novel nomogram to predict the prognosis of patients undergoing liver resection for neuroendocrine liver metastasis: an analysis of the Italian Neuroendocrine Liver Metastasis Database. Journal of Gastrointestinal Surgery 2017. 21 41–48. ( 10.1007/s11605-016-3228-6) [DOI] [PubMed] [Google Scholar]
- 32.Norris CM, Ghali WA, Saunders LD, Brant R, Galbraith D, Faris P, Knudtson ML. & APPROACH Investigators. Ordinal regression model and the linear regression model were superior to the logistic regression models. Journal of Clinical Epidemiology 2006. 59 448–456. ( 10.1016/j.jclinepi.2005.09.007) [DOI] [PubMed] [Google Scholar]
- 33.Yang L, Shen W, Sakamoto N. Population-based study evaluating and predicting the probability of death resulting from thyroid cancer and other causes among patients with thyroid cancer. Journal of Clinical Oncology 2013. 31 468–474. ( 10.1200/JCO.2012.42.4457) [DOI] [PubMed] [Google Scholar]
- 34.Zhou H, Zhang Y, Qiu Z, Chen G, Hong S, Chen X, Zhang Z, Huang Y, Zhang L. Nomogram to predict cause-specific mortality in patients With surgically resected Stage I non-small-cell lung cancer: a competing risk analysis. Clinical Lung Cancer 2018. 19 e195–e203. ( 10.1016/j.cllc.2017.10.016) [DOI] [PubMed] [Google Scholar]
- 35.Li D, Zhong C, Tang X, Yu L, Ding K, Yuan Y. Competing nomograms help in the selection of elderly patients with colon cancer for adjuvant chemotherapy. Journal of Cancer Research and Clinical Oncology 2018. 144 909–923. ( 10.1007/s00432-018-2611-y) [DOI] [PubMed] [Google Scholar]
- 36.Rees MJ, Liao H, Spillane J, Speakman D, McCormack C, Donahoe S, Pohl M, Webb A, Gyorki D, Henderson MA. Localized melanoma in older patients, the impact of increasing age and comorbid medical conditions. European Journal of Surgical Oncology 2016. 42 1359–1366. ( 10.1016/j.ejso.2016.01.010) [DOI] [PubMed] [Google Scholar]
- 37.Raj N, Valentino E, Capanu M, Tang LH, Basturk O, Untch BR, Allen PJ, Klimstra DS, Reidy-Lagunes D. Treatment response and outcomes of Grade 3 pancreatic neuroendocrine neoplasms based on morphology: well differentiated versus poorly differentiated. Pancreas 2017. 46 296–301. ( 10.1097/MPA.0000000000000735) [DOI] [PMC free article] [PubMed] [Google Scholar]
- 38.Balachandran VP, Gonen M, Smith JJ, DeMatteo RP. Nomograms in oncology: more than meets the eye. Lancet Oncology 2015. 16 e173–e180. ( 10.1016/S1470-2045(14)71116-7) [DOI] [PMC free article] [PubMed] [Google Scholar]
- 39.Shen W, Sakamoto N, Yang L. Melanoma-specific mortality and competing mortality in patients with non-metastatic malignant melanoma: a population-based analysis. BMC Cancer 2016. 16 413 ( 10.1186/s12885-016-2438-3) [DOI] [PMC free article] [PubMed] [Google Scholar]


 This work is licensed under a