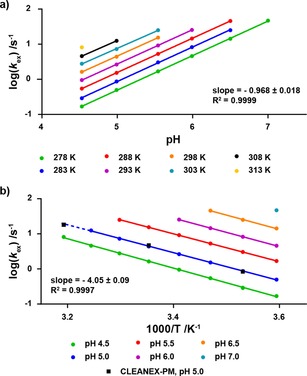
Figure 5.

Plots demonstrating the linear dependence of log (k ex) on a) pH and b) inverse temperature. Data was recorded on [13C6,15N4]‐L‐arginine at 11.7 T. At high pH and high temperature, the exchange rate becomes too fast to measure. Black squares indicated data points measured using the CLEANEX‐PM experiment for comparison.
