Abstract
Fluorescence barcoding based on nanoparticles provides many advantages for multiparameter imaging. However, creating different concentration‐independent codes without mixing various nanoparticles and by using single‐wavelength excitation and emission for multiplexed cellular imaging is extremely challenging. Herein, we report the development of quantum dots (QDs) with two different SiO2 shell thicknesses (6 and 12 nm) that are coated with two different lanthanide complexes (Tb and Eu). FRET from the Tb or Eu donors to the QD acceptors resulted in four distinct photoluminescence (PL) decays, which were encoded by simple time‐gated (TG) PL intensity detection in three individual temporal detection windows. The well‐defined single‐nanoparticle codes were used for live cell imaging and a one‐measurement distinction of four different cells in a single field of view. This single‐color barcoding strategy opens new opportunities for multiplexed labeling and tracking of cells.
Keywords: FRET, imaging, lanthanides, photoluminescence lifetimes, quantum dots
Optical encoding has great potential for nanomedicine, diagnostics, biosensing, document security, and optical data storage.1, 2, 3, 4 Such barcoding has exploited both the emission color1, 5 and the excited‐state lifetime6, 7, 8 components of PL. The majority of encoding approaches are based on the mixing of different luminescent molecules or nanoparticles in microspheres1, 6, 7 or cells.5, 8, 9 Using individual dyes or nanoparticles (e.g., QDs)10, 11 for optical encoding is limited by the spectral overlap of their PL spectra and the concentration dependence of the PL intensity. Concentration‐independent PL lifetime multiplexing with individual nanoparticles has also been demonstrated. One concept was based on the use of upconversion nanoparticles (UCNPs) with varying co‐doping concentrations of Yb3+ and Tm3+ ions, but was only applied for proof‐of‐concept biosensing and security printing,2 most probably owing to the limited brightness of UCNPs.12 Individual QDs were also used for PL lifetime tuning through band gap engineering, for example, by increasing the particle size,13 introducing various dopants,7, 14 and fabricating nanostructures with lattice strain.8, 15 Unfortunately, these methods led to changes in the PL wavelengths, and thus color could not be used as an independent parameter, which is a prerequisite for combining both color and lifetime into higher‐order multiplexing. A facile and robust strategy to prepare QDs with lifetime tunability that is independent of the PL color would significantly advance this endeavor.
Förster resonance energy transfer (FRET) is a strongly distance‐dependent interaction within a luminescent donor–acceptor pair, and the donor–acceptor distance defines the PL lifetime of the donor.16 A FRET pair of lanthanide (e.g., Eu3+ or Tb3+) donors and QD acceptors is of particular interest for multiplexed biosensing because lanthanides possess very long PL lifetimes and QDs provide color tunability and narrow PL emission.17, 18, 19, 20 Owing to the large difference between the PL lifetimes of lanthanides (on the order of milliseconds) and QDs (on the order of nanoseconds), the FRET‐sensitized lifetime of the QD acceptor is the same as the FRET‐quenched lifetime of the lanthanide donor.19 Therefore, shorter (or longer) lanthanide–QD distances lead to shorter (or longer) PL lifetimes for both lanthanide and QD. We have recently shown that a single Tb–QD FRET pair can be used for TG detection of multiple miRNAs by PL lifetime tuning through Tb‐to‐QD distance adjustment.21 Herein, we demonstrate that such a distance tuning approach can be used within one single nanoparticle by direct attachment of the lanthanides to QD coatings with different thicknesses and that these individual lanthanide‐coated QD nanohybrids can be used for the encoding of different cells by TG temporal multiplexing.
As a prototypical system for FRET lifetime encoding with individual nanoparticles (Scheme 1), we used silica as a transparent and controllable coating matrix for the QDs (CdSe/CdS/ZnS, emission maximum at 620 nm).22, 23 The QDs were coated with size‐controlled (6 and 12 m) and uniform thiol‐functionalized silica shells (QD–SiO2), and two different maleimide‐functionalized lanthanide complexes (Lumi4‐Tb and Eu‐1)24, 25, 26 were attached through conjugation.
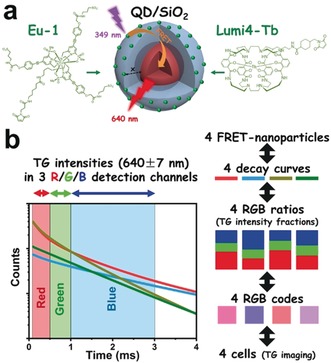
Scheme 1.

a) QDs with SiO2 coatings of different thicknesses (x=6 or 12 nm) functionalized with Eu‐1 or Lumi4‐Tb for single‐wavelength temporal PL barcoding. b) The RGB encoding principle based on three distinct TG PL intensity fractions for each of the four FRET‐specific PL decays (see Figure 1 for technical details).
High resolution transmission electron microscopy (HRTEM; see the Supporting Information, Figure S1) images showed nearly monodisperse QDs with clearly defined SiO2 nanoshells of 6 nm and 12 nm thickness. Absorption and emission spectra of Lumi4‐Tb, Eu‐1, QD, QD/SiO2(6 nm), and QD/SiO2(12 nm) are presented in Figure S2. Both lanthanide complexes were excitable in the 300 to 400 nm wavelength region, and their PL spectra overlapped well with the QD absorption spectra for efficient FRET (Figure S3). Photophysical and FRET parameters for the different single luminophores and the donor–acceptor combinations are listed in Table 1. While the PL emission wavelength of the QDs before and after SiO2 coating did not change (Figure S2), the extinction coefficient of QD/SiO2 significantly increased with increasing shell thickness owing to the better protection of the QD from the environment. The spectral overlap integral (J) and the Förster distance (R 0) of each individual FRET pair were calculated. UV/Vis absorbance spectra were employed to calculate the number of lanthanide donors per QD acceptor. The absorbance spectra (Figure S4), which presented linear combinations of QD–SiO2 and the lanthanide complexes, resulted in labeling ratios of ca. 75 Lumi4‐Tb per QD/SiO2(6 nm), ca. 87 Lumi4‐Tb per QD/SiO2(12 nm), ca. 175 Eu‐1 per QD/SiO2(6 nm), and ca. 180 Eu‐1 per QD/SiO2(12 nm). Approximately double amounts were used for Eu‐1 to account for the lower brightness (lower extinction coefficient at the microscopy excitation wavelength of 349 nm and lower quantum yield) of Eu‐1 compared to Lumi4‐Tb. Owing to the long PL lifetime of lanthanides, one QD can be sensitized by FRET from several lanthanide donors, and therefore an increasing number of donors increases the overall brightness of FRET‐sensitized QD emission.
Table 1.
Optical characteristics of Tb, Eu, and QD/SiO2 with their FRET pairs.
| ϵ max (m −1 cm−1) [λ max] |
Φ
|
Emission filter (nm)[a] | τ [b] | ||
|---|---|---|---|---|---|
| Lumi4‐Tb | 26 000 [340 nm] | 0.79 | 490/20 | 2.7 ms | |
| Eu‐1 | 58 000 [330 nm] | 0.48 | 567/15 | 1.1 ms | |
| QD/SiO2(6 nm) | 599 500 [610 nm] | – | 640/14 | ca. 12 ns | |
| QD/SiO2(12 nm) | 1 770 000 [610 nm] | – | 640/14 | ca. 11 ns |
| FRET pair (D→A) | J (m −1 cm−1 nm4) | R 0 (nm) | τ ave (ms)[c] | |
|---|---|---|---|---|
| Tb→QD/SiO2(6 nm) | 8.5×10¹⁶ | 10.3 | 0.74 | |
| Tb→QD/SiO2(12 nm) | 2.4×10¹⁷ | 12.2 | 1.82 | |
| Eu→QD/SiO2(6 nm) | 7.2×10¹⁶ | 9.2 | 0.61 | |
| Eu→QD/SiO2(12 nm) | 2.3×10¹⁷ | 11.1 | 1.09 | |
[a] See Figure S6 for filter spectra. Lumi4‐Tb and Eu‐1 filters were selected to measure their bluest emission bands with the least possible overlap with the QD emission band. The QD filter was selected to avoid overlap with Tb and Eu PL. [b] See Figure S7 for PL decay curves. [c] Amplitude‐averaged decay time that takes into account the complete decay curves, which contain FRET‐quenched and unquenched (lanthanide complexes that do not participate in FRET) components. FRET‐quenched average decay times, FRET efficiencies, and donor–acceptor distances can be found in Table S1.
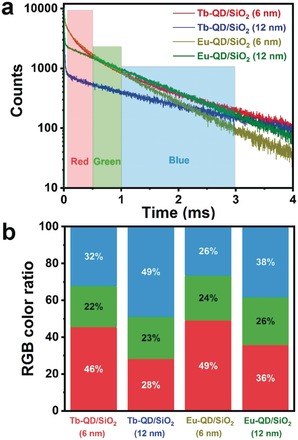
Owing to the different distances (6 nm or 12 nm) and different R 0 values (between 9.2 and 12.2 nm, Table 1), the PL lifetimes (τ) of Lumi4‐Tb (2.7 ms) and Eu‐1(1.1 ms) were shortened to different extents. Because of the much shorter PL lifetime of the QDs (ns) compared to the lanthanide complexes (ms), the FRET‐quenched PL decay times of the lanthanides equaled the FRET‐sensitized PL decay times of the QDs.17 Therefore, FRET led to distinct and long‐lived QD decays (Figure 1 a and Figure S5), with average decay times (τ ave) between 0.61 ms and 1.82 ms (Table 1) for the four lanthanide–QD FRET nanoparticles. Steady‐state PL spectra also showed increased lanthanide PL quenching with decreasing shell thickness (Figure S6). Based on the PL decay curves, we also calculated FRET efficiencies and donor–acceptor distances (Tb/Eu–QD distances of 8.0 nm/8.3 nm for the 6 nm SiO2 shell and 11.3 nm/12.5 nm for the 12 nm SiO2 shell), which were in very good agreement with the QD–SiO2 structures and the distances from HRTEM (Figure S1), taking into account the random conjugation of the lanthanide complexes on the surface of the SiO2 shell.
Figure 1.

a) QD acceptor PL decay curves of each single nanoparticle code. b) TG PL intensity (RGB) ratios of each single nanoparticle code calculated from the TG intensities in the red, green, and blue TG detection windows in (a).
The principle of TG RGB encoding is illustrated in Scheme 1 b. Based on the intersections of the four distinct PL decay curves (Figure 1 a), three temporally distinct TG PL intensity detection windows were selected and defined as red (R), green (G), and blue (B), respectively. One PL intensity (integrated over the time interval of the detection channel) is recorded for each channel. The different shapes of the decay curves (different PL lifetimes) result in distinct PL intensity combinations of the three detection channels R, G, and B. Thereby, each FRET nanoparticle can be identified by a unique RGB ratio (ratios of the TG PL intensities: R/(R+G+B), G/(R+G+B), and B/(R+G+B); Figure 1 b and Table S2). TG imaging uses the same three TG detection windows as defined by the decay curves, and each camera pixel records three time‐dependent intensities (R, G, and B) for each image. ImageJ was used to assign red, green, or blue color to the three detection channels and define a common intensity range (same minimum and maximum values for all channels). The resulting overlay images provide RGB codes (between 0 and 255 for R, G, and B) for each pixel, which can then be transferred into RGB ratios and directly related to the four different FRET nanoparticles. As a first evaluation of biocompatibility, the stability of the RGB codes was analyzed for the four different nanoparticles incubated in PBS buffer at different pH (5.3, 6.8, and 7.5) for 2 h and 4 h. The TG PL intensity ratios of each code were nearly invariant (Figure S8), which provided first good evidence regarding the compatibility of our temporal PL encoding approach with live cell imaging.
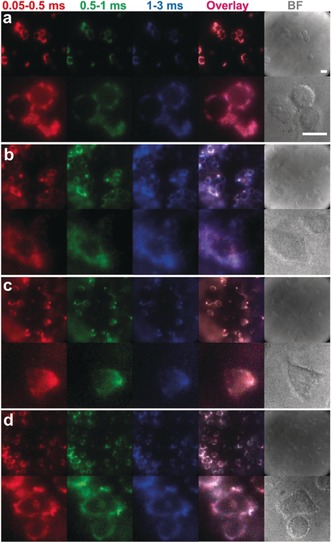
To demonstrate the actual application for live cell imaging, HeLa cells were incubated with Tb–QD/SiO2(6 nm), Tb–QD/SiO2(12 nm), Eu–QD/SiO2(6 nm), and Eu–QD/SiO2(12 nm), respectively. Although adequately coated and biocompatible QDs have been used in many biological imaging applications in vivo and in vitro, their toxicity remains an important subject of discussion.11 Cell viability tests (MTT assays) with QD concentrations of up to 800 nm (the concentration used for imaging experiments was only 20 nm) for both QD/SiO2(6 nm) and QD/SiO2(12 nm) revealed no significant cytotoxicity (Figure S9). To encode the cells incubated with a specific nanoparticle, we used a TG microscopy imaging system with pulsed laser excitation at 349 nm and time‐gated detection of the QD PL with an intensified CCD camera.27 In general, TG microscopy in the micro‐ and millisecond range can be realized on any standard fluorescence microscope that is equipped with pulsed excitation (e.g., LEDs, lasers, flash lamps, mechanical choppers) and time‐gated detection (e.g., intensified cameras, scanning photon detectors, mechanical choppers).28, 29 As defined before in the PL decay experiments, TG windows of 0.05–0.5 ms (R), 0.5‐1 ms (G), and 1–3 ms (B) were selected for TG image encoding (Figure 2). After merging the images from the three TG detection windows (overlay), the RGB color images were obtained. Each code was determined according to RGB color selection and was consistent with the previously calculated results obtained by PL decays. Noteworthy, the different RGB colors could be readily distinguished by the naked eye (Figure 2).
Figure 2.

TG PL images (top) and high‐resolution TG PL images (bottom) in different temporal detection windows (time ranges on top), their overlay, and bright field (BF) images of HeLa cells labeled with individual nanoparticle codes: a) Tb–QD/SiO2(6 nm); b) Tb–QD/SiO2(12 nm); c) Eu–QD/SiO2(6 nm); d) Eu–QD/SiO2(12 nm). Scale bar (top right): 20 μm; λ ex=349 nm; λ em=640 nm.
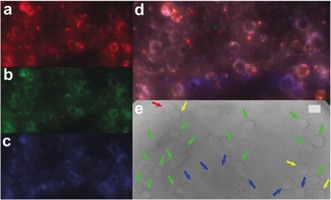
To emphasize the capability of these codes to distinguish cells in more complex environments, four differently encoded HeLa cells were mixed and cultured on the same microscopy slide. As shown in Figure 3, single‐color (one excitation and one emission wavelength) TG imaging could efficiently distinguish the four types of cells within the same field of view. Again, the four RGB codes can be already distinguished by the naked eye (Figure 3 d). However, for reasons of clarity and taking into account the different color impressions from screen to screen and from screen to paper, we retrieved the RGB codes from color selection within the overlay image and marked the different cells with colored arrows in the bright‐field images (Figure 3 e). We found that the RGB color of each code in this rather complex mixing environment exhibited less blue color, which we assigned to quenching effects during the 8 h incubation time. Still, we could clearly distinguish the encoded cells based on the ratios of the TG PL intensities. Finally, to demonstrate the independence of the readout from PL intensity and probe concentration, different encoding nanoparticles were incubated at distinct concentrations with HeLa cells, and afterwards the cells were mixed. Adjusting brightness and contrast within the same field of view also allowed us to distinguish cells with significantly different PL intensities (Figure S10).
Figure 3.

TG PL images of differently encoded HeLa cells: a) 0.05–0.5 ms; b) 0.5–1 ms; c) 1–3 ms; d) overlay; e) bright‐field image; red arrow: Tb–QD/SiO2(6 nm), blue arrows: Tb–QD/SiO2(12 nm), yellow arrows: Eu–QD/SiO2(6 nm), green arrows: Eu–QD/SiO2(12 nm). Scale bar (e): 20 μm; λ ex=349 nm; λ em=640 nm.
In summary, we have developed and applied a single‐wavelength, single‐nanoparticle encoding system composed of QD cores with lanthanide‐functionalized SiO2 shells. Our TG‐FRET barcoding technique is based on precise control of the distance between lanthanide donors and QD acceptors, which, in turn, leads to distinct PL decay curves. TG PL detection in three specific time windows allowed us to create distinct RGB codes for each encoding nanoparticle, which were used to label live cells. Individual cells and cell mixtures could be distinguished by the predefined RGB codes in the same field of view by TG PL imaging. Our encoding approach is independent from PL intensity and nanoparticle concentration, and was shown to provide stable signals at different pH values over several hours of incubation. While our study used two different QD coating thicknesses and two different lanthanide complexes to create four different codes, more variations could be used to extend the coding range with additional lifetimes. Although a larger lifetime difference will always lead to better distinction, the curves of Eu–QD/SiO2(6 nm) and Tb–QD/SiO2(6 nm) are very similar with an average lifetime difference of only about 20 % (0.61 and 0.74 ms, see Table 1), but can still be distinguished very efficiently. A 20 % difference between all lifetimes and a minimum lifetime of about 10 % of the one of Lumi4‐Tb (2.7 ms) would allow for 14 different codes (lifetimes of 0.25, 0.30, 0.36, 0.44, 0.52, 0.63, 0.75, 0.90, 1.09, 1.30, 1.56, 1.88, 2.25, and 2.70 ms). If the coding system of interest requires more than 20 % lifetime difference, the FRET multiplexing range can be extended by other means, for example, by combining spectral and temporal multiplexing components or by multistep FRET processes, in which the QD is used both as acceptor (to a Tb complex) and donor (to a dye). Such approaches have already been used in solution to quantify multiple DNAs by spectrotemporal multiplexing30 or for the design of sophisticated molecular logic gates.31, 32 Taking into account that lanthanide‐to‐QD FRET can be applied to many different QD colors,18, 33, 34, 35 it should be possible to extend our single‐nanoparticle encoding strategy to higher‐order spectrotemporal PL barcoding, and thereby significantly advance the possibilities of fluorescence encoding.
Conflict of interest
The authors declare no conflict of interest.
Supporting information
As a service to our authors and readers, this journal provides supporting information supplied by the authors. Such materials are peer reviewed and may be re‐organized for online delivery, but are not copy‐edited or typeset. Technical support issues arising from supporting information (other than missing files) should be addressed to the authors.
Supplementary
Acknowledgements
We thank Lumiphore, Inc. for the gift of Lumi4 reagents. This work was partially funded by the European Commission (H2020‐FET‐Open project PROSEQO) and the National Natural Science Foundation of China (51502333, 21501191). C.C. thanks the IDEX Paris‐Saclay (ANR, Investissements d'avenir) for a PhD fellowship. N.H. acknowledges the Institut Universitaire de France (IUF) for financial support.
C. Chen, L. Ao, Y.-T. Wu, V. Cifliku, M. Cardoso Dos Santos, E. Bourrier, M. Delbianco, D. Parker, J. M. Zwier, L. Huang, N. Hildebrandt, Angew. Chem. Int. Ed. 2018, 57, 13686.
In memory of Maxime Dahan, a pioneer in advanced imaging technologies
Contributor Information
Dr. Liang Huang, Email: lhuang@zjut.edu.cn.
Prof. Niko Hildebrandt, Email: niko.hildebrandt@u-psud.fr, nanofret.com.
References
- 1. Han M., Gao X., Su J. Z., Nie S., Nat. Biotechnol. 2001, 19, 631–635. [DOI] [PubMed] [Google Scholar]
- 2. Lu Y. et al., Nat. Photonics 2014, 8, 32–36. [Google Scholar]
- 3. Zijlstra P., Chon J. W. M., Gu M., Nature 2009, 459, 410–413. [DOI] [PubMed] [Google Scholar]
- 4. Leng Y., Sun K., Chen X., Li W., Chem. Soc. Rev. 2015, 44, 5552–5595. [DOI] [PMC free article] [PubMed] [Google Scholar]
- 5. Andreiuk B., Reisch A., Lindecker M., Follain G., Peyriéras N., Goetz J. G., Klymchenko A. S., Small 2017, 13, 1701582. [DOI] [PubMed] [Google Scholar]
- 6. Lu Y. et al., Nat. Commun. 2014, 5, 3741. [DOI] [PMC free article] [PubMed] [Google Scholar]
- 7. Chen C., Zhang P., Gao G., Gao D., Yang Y., Liu H., Wang Y., Gong P., Cai L., Adv. Mater. 2014, 26, 6313–6317. [DOI] [PubMed] [Google Scholar]
- 8. Zhang L., Chen C., Li W., Gao G., Gong P., Cai L., ACS Appl. Mater. Interfaces 2016, 8, 13187–13191. [DOI] [PubMed] [Google Scholar]
- 9. Rees P. et al., Nat. Methods 2014, 11, 1177–1181. [DOI] [PubMed] [Google Scholar]
- 10. Jennings T. L. et al., ACS Nano 2011, 5, 5579–5593. [DOI] [PubMed] [Google Scholar]
- 11. Wegner K. D., Hildebrandt N., Chem. Soc. Rev. 2015, 44, 4792–4834. [DOI] [PubMed] [Google Scholar]
- 12. Gorris H. H., Wolfbeis O. S., Angew. Chem. Int. Ed. 2013, 52, 3584–3600; [DOI] [PubMed] [Google Scholar]; Angew. Chem. 2013, 125, 3668–3686. [Google Scholar]
- 13. Rogach A. L., Franzl T., Klar T. A., Feldmann J., Gaponik N., Lesnyak V., Shavel A., Eychmuller A., Rakovich Y. P., Donegan J. F., J. Phys. Chem. C 2007, 111, 14628–14637. [Google Scholar]
- 14. Chen C., Zhang P., Zhang L., Gao D., Gao G., Yang Y., Li W., Gong P., Cai L., Chem. Commun. 2015, 51, 11162–11165. [DOI] [PubMed] [Google Scholar]
- 15. Smith A. M., Mohs A. M., Nie S., Nat. Nanotechnol. 2009, 4, 56–63. [DOI] [PMC free article] [PubMed] [Google Scholar]
- 16. Medintz I., Hildebrandt N., FRET—Förster Resonance Energy Transfer: From Theory to Applications, 1st ed., Wiley-VCH, Weinheim, 2013. [Google Scholar]
- 17. Hildebrandt N., Spillmann C. M., Algar W. R., Pons T., Stewart M. H., Oh E., Susumu K., Díaz S. A., Delehanty J. B., Medintz I. L., Chem. Rev. 2017, 117, 536–711. [DOI] [PubMed] [Google Scholar]
- 18. Cardoso Dos Santos M., Hildebrandt N., TrAC Trends Anal. Chem. 2016, 84, 60–71. [Google Scholar]
- 19. Hildebrandt N., Wegner K. D., Algar W. R., Coord. Chem. Rev. 2014, 273–274, 125–138. [Google Scholar]
- 20. Faklaris O., Cottet M., Falco A., Villier B., Laget M., Zwier J. M., Trinquet E., Mouillac B., Pin J. P., Durroux T., FASEB J. 2015, 29, 2235–2246. [DOI] [PubMed] [Google Scholar]
- 21. Qiu X., Guo J., Jin Z., Petreto A., Medintz I. L., Hildebrandt N., Small 2017, 13, 1700332. [Google Scholar]
- 22. Ji B. et al., Nat. Nanotechnol. 2015, 10, 170–175. [DOI] [PubMed] [Google Scholar]
- 23. Huang L., Liao T., Wang J., Ao L., Su W., Hu J., Adv. Funct. Mater. 2018, 28, 1705380. [Google Scholar]
- 24. Xu J., Corneillie T. M., Moore E. G., Law G. L., Butlin N. G., Raymond K. N., J. Am. Chem. Soc. 2011, 133, 19900–19910. [DOI] [PMC free article] [PubMed] [Google Scholar]
- 25. Delbianco M., Sadovnikova V., Bourrier E., Mathis G., Lamarque L., Zwier J. M., Parker D., Angew. Chem. Int. Ed. 2014, 53, 10718–10722; [DOI] [PubMed] [Google Scholar]; Angew. Chem. 2014, 126, 10894–10898. [Google Scholar]
- 26. Butler S. J., Delbianco M., Lamarque L., McMahon B. K., Neil E. R., Pal R., Parker D., Walton J. W., Zwier J. M., Dalton Trans. 2015, 44, 4791–4803. [DOI] [PubMed] [Google Scholar]
- 27. Cardoso Dos Santos M., Goetz J., Bartenlian H., Wong K.-L., Charbonnière L. J., Hildebrandt N., Bioconjugate Chem. 2018, 29, 1327–1334. [DOI] [PubMed] [Google Scholar]
- 28. Gahlaut N., Miller L. W., Cytom. A 2010, 77A, 1113–1125. [DOI] [PMC free article] [PubMed] [Google Scholar]
- 29. Zwier J. M., Hildebrandt N. in Rev. Fluoresc. 2016 (Ed.: C. D. Geddes), Springer, Berlin, 2017, pp. 17–43. [Google Scholar]
- 30. Qiu X., Guo J., Xu J., Hildebrandt N., J. Phys. Chem. Lett. 2018, 9, 4379–4384. [DOI] [PubMed] [Google Scholar]
- 31. Claussen J. C., Hildebrandt N., Susumu K., Ancona M. G., Medintz I. L., ACS Appl. Mater. Interfaces 2014, 6, 3771–3778. [DOI] [PubMed] [Google Scholar]
- 32. Claussen J. C., Algar W. R., Hildebrandt N., Susumu K., Ancona M. G., Medintz I. L., Nanoscale 2013, 5, 12156–12170. [DOI] [PubMed] [Google Scholar]
- 33. Qiu X., Hildebrandt N., ACS Nano 2015, 9, 8449–8457. [DOI] [PubMed] [Google Scholar]
- 34. Geißler D., Charbonnière L. J., Ziessel R. F., Butlin N. G., Löhmannsröben H. G., Hildebrandt N., Angew. Chem. Int. Ed. 2010, 49, 1396–1401; [DOI] [PubMed] [Google Scholar]; Angew. Chem. 2010, 122, 1438–1443. [Google Scholar]
- 35. Morgner F., Geißler D., Stufler S., Butlin N. G., Löhmannsröben H. G., Hildebrandt N., Angew. Chem. Int. Ed. 2010, 49, 7570–7574; [DOI] [PubMed] [Google Scholar]; Angew. Chem. 2010, 122, 7732–7736. [Google Scholar]
Associated Data
This section collects any data citations, data availability statements, or supplementary materials included in this article.
Supplementary Materials
As a service to our authors and readers, this journal provides supporting information supplied by the authors. Such materials are peer reviewed and may be re‐organized for online delivery, but are not copy‐edited or typeset. Technical support issues arising from supporting information (other than missing files) should be addressed to the authors.
Supplementary


