Abstract
Size‐selective hydroformylation of terminal alkenes was attained upon embedding a rhodium bisphosphine complex in a supramolecular metal–organic cage that was formed by subcomponent self‐assembly. The catalyst was bound in the cage by a ligand‐template approach, in which pyridyl–zinc(II) porphyrin interactions led to high association constants (>105 m −1) for the binding of the ligands and the corresponding rhodium complex. DFT calculations confirm that the second coordination sphere forces the encapsulated active species to adopt the ee coordination geometry (i.e., both phosphine ligands in equatorial positions), in line with in situ high‐pressure IR studies of the host–guest complex. The window aperture of the cage decreases slightly upon binding the catalyst. As a result, the diffusion of larger substrates into the cage is slower compared to that of smaller substrates. Consequently, the encapsulated rhodium catalyst displays substrate selectivity, converting smaller substrates faster to the corresponding aldehydes. This selectivity bears a resemblance to an effect observed in nature, where enzymes are able to discriminate between substrates based on shape and size by embedding the active site deep inside the hydrophobic pocket of a bulky protein structure.
Keywords: cage compounds, hydroformylation, porphyrins, substrate selectivity, supramolecular chemistry
Introduction
Traditional homogeneous transition‐metal catalysis relies on the use of metal complexes, which are tuned by changing the metal and modifying the ligands that are coordinated to it.1 Nature's catalysts, enzymes, use a larger toolbox to steer the outcome of catalytic reactions. As a result, they display unusually high control of both the activity and selectivity of catalytic transformations at ambient conditions. The detailed working principles of enzymes are still under dispute, but overall it is understood that steric confinement of the catalytically active centre within the hydrophobic pocket of a bulky protein structure plays an important role in generating such outstanding catalytic performance.2 Upon encapsulation of a substrate in the pocket near the active site of an enzyme by multiple weak, non‐covalent interactions between the substrate and the hydrophobic surroundings, the local microenvironment created differs substantially from the bulk solution.3 Analogously, synthetic metal catalysts have been docked into nanocages with the aim to control the catalyst performance by means of the second coordination sphere.4 Control of both the activity and selectivity of various organic transformations5 and several metal‐catalysed transformations5c, 6 has been demonstrated. For the latter, the most common approach is to use an existing molecular cage and to bind a metal complex as the catalyst, which is difficult to do by design because it requires a sophisticated interplay between entropic effects and weak interactions between the catalyst and the interior of the cage.7 We previously reported a general strategy to encapsulate transition‐metal catalysts that is based on a ligand‐template approach, in which the interactions between the cage and the catalyst are present by design.8 The ligand acts as a template for capsule formation and coordinates to the active metal centre, allowing different types of catalysts to be encapsulated. For example, by coordination of the ligand to rhodium, efficient hydroformylation catalysts that show excellent product selectivity have been obtained.8, 9
Most studies have focused on the use of nanocages to modify the activity and selectivity of catalytic reactions. In nature, however, the complexity of chemical systems requires enzymes to also be highly substrate‐selective to allow for a single substrate to be converted in a “chemical concoction”.10 Some enzymes are also regulated by cofactors, rendering them inherently more dynamic and responsive than traditional homogeneous catalysts. In the context of transition‐metal catalysis in nanocages, limited attention has been dedicated to promoting substrate selectivity of the catalysts. Furthermore, the majority of all reported examples describe organic transformations over transition‐metal‐catalysed reactions.6d, 10, 11 As yet, no examples of size‐selective hydroformylation catalysis using catalysts in nanocages have been reported.
We decided to explore size‐selective hydroformylation of terminal alkenes by confining a rhodium bisphosphine catalyst in a metal–organic cage. Capsules formed by the ligand‐template approach (as previously reported) are likely to be too dynamic to allow for substrate selectivity, necessitating a more rigid cage structure. Here, a new approach is presented in which the generality of the ligand‐template approach is combined with the rigidity of a self‐assembled cage structure. The use of a zinc porphyrin analogue (Fe4(Zn‐L)6) of a self‐assembled tetrahedral cage published by the group of Nitschke12 allows the strong binding of pyridine‐functionalized phosphine ligands within its apolar cavity. By coordination of the encapsulated phosphine ligands to rhodium, a supramolecular catalyst capable of size‐selective hydroformylation of terminal alkenes was obtained (Scheme 1). The non‐encapsulated catalyst does not display such substrate discrimination, demonstrating that the selectivity stems from the steric bulk imposed by the second coordination sphere around the catalyst.
Scheme 1.
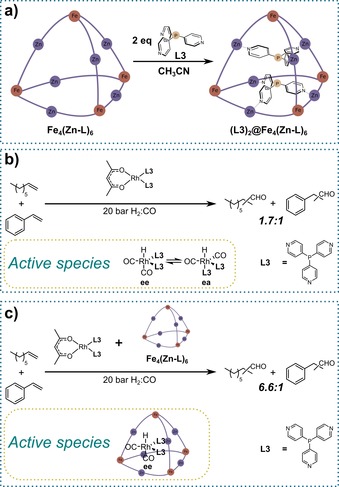
(a) Formation of the encapsulated supramolecular bidentate phosphine ligand through selective encapsulation of two trispyridylphosphine ligands (L3) inside cage Fe4(Zn‐L)6 driven by tritopic pyridyl–zinc porphyrin coordination. (b) Hydroformylation of mixtures of substrates by a non‐encapsulated rhodium phosphine catalyst. (c) Size‐selective hydroformylation of mixtures of substrates by an encapsulated rhodium phosphine catalyst. ee=equatorial‐equatorial isomer, ea=equatorial‐apical isomer.
Results and Discussion
In this section, we will first discuss the synthesis and characterization of the new cage, followed by molecular modelling of the catalyst–cage assembly. Next, the binding constants of various pyridine‐functionalized guests with the supramolecular cage are determined by UV/Vis titration studies. Finally, we will discuss the spectroscopic characterization of the encapsulated active species and its application in hydroformylation catalysis.
Synthesis of the cage
The subcomponent self‐assembly of the tetrahedral nanocage Fe4(Zn‐L)6 is similar to that of the previously reported analogue based on nickel porphyrin building blocks (Scheme 2; for the detailed synthetic procedure, see Supporting Information, Section 4).12 The structure of the new nanocage was confirmed by various spectroscopic techniques, including one‐ and two‐dimensional NMR spectroscopy and high‐resolution mass spectrometry, along with elemental analysis (Supporting Information, Section 5). All analytical data are in line with the formation of a cage compound, which is identical to the previously reported cage based on nickel porphyrins.
Scheme 2.
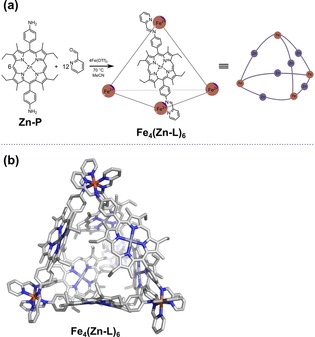
(a) Formation of the tetrahedral cage Fe4(Zn‐L)6 through metal‐directed self‐assembly of the corresponding building blocks and a schematic representation of the resulting nanocage. For clarity, only one of the six ligands occupying the edges of the cage is shown in the molecular structure. OTf=trifluoromethanesulfonate. (b) xTB‐optimized structure of cage Fe4(Zn‐L)6.
Molecular modelling of the encapsulated catalyst
To confirm that Fe4(Zn‐L)6 has the appropriate size to accommodate a hydroformylation catalyst, we performed volume calculations on the empty cage and the prospective guests with the online utility Voss Volume Voxelator (Supporting Information, Section 10).13 The structures of all the guests are shown in Figure 1, and the results of the volume calculations are presented in Table 1.
Figure 1.
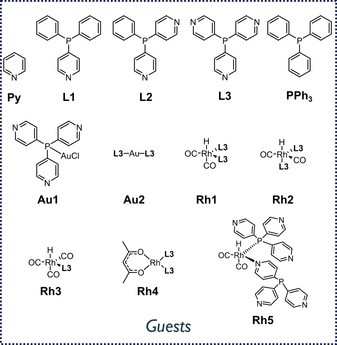
Molecular structures of the various pyridine‐functionalized guests.
Table 1.
Volumes of the cage and the guests calculated with the online utility Voss Volume Voxelator.13 The occupancy factor corresponds to the ratio between the guest volume and the host‐cavity volume. 1 equiv=one equivalent of guest compared to cage, 2 equiv=two equivalents of guest compared to cage.
| Entry | Compound | Volume [Å3] | Occupancy factor |
|---|---|---|---|
| 1 | Fe4(Zn‐L)6 | 1748 | – |
| 2 | L1 | 422 | 0.24 (1 equiv), 0.48 (2 equiv) |
| 3 | L2 | 412 | 0.24 (1 equiv), 0.47 (2 equiv) |
| 4 | L3 | 405 | 0.23 (1 equiv), 0.46 (2 equiv) |
| 5 | Au1 | 498 | 0.28 (1 equiv), 0.57 (2 equiv) |
| 6 | Au2 | 918 | 0.53 (1 equiv) |
| 7 | Rh4 | 1003 | 0.57 (1 equiv) |
| 8 | Rh1 | 928 | 0.53 (1 equiv) |
| 9 | Rh3 | 570 | 0.33 (1 equiv), 0.65 (2 equiv) |
Cage Fe4(Zn‐L)6 has an inner‐cavity volume of about 1750 Å3, which is large enough to encapsulate any of the guests shown in Figure 1. Volume calculations indicate that a rhodium complex with two phosphine ligands has the most suitable size for encapsulation in the cavity. The catalyst precursor Rh4 has a molecular volume of around 1000 Å3, resulting in an occupancy factor (the ratio between the guest volume and the host‐cavity volume) of 0.57. This is in good agreement with Rebek's 55 % rule, which has been developed for guest binding in cages by weak forces, and this indicates that the complex is of the correct size for encapsulation.14 More importantly, the catalytically active rhodium complex Rh1 fills 53 % of the cavity void. As a result, binding of the catalytically active species is possible, and there is sufficient space to also accommodate the substrate. The monoligated rhodium complex Rh3 is smaller in volume (570 Å3) and therefore only fills 33 % of the volume of the cage. For the free phosphine ligands L1, L2 and L3, the calculated occupancy factors suggest that their binding will be most favourable in a 1:2 stoichiometry with respect to the cage.
To gain deeper insight into the geometry of the encapsulated active species, we performed molecular modelling studies by using the Amsterdam Density Functional (ADF) software (Supporting Information, Section 11). The crystal structure of the previously published nickel‐porphyrin‐based cage served as a starting point for the modelling. We calculated three possible geometries of the encapsulated trigonal bipyramidal active species HRh(CO)2(L3)2, namely Rh1 (ee, the complex with both phosphine ligands in equatorial positions), Rh2 (ea, the complex with the phosphine ligands in equatorial and apical positions) and Rh5 (P‐N, the complex with one of the phosphine ligands coordinating through the nitrogen atom). The complexes were separately docked inside the cage structure with a maximum number of pyridin–zinc porphyrin interactions between the complex and the inner walls of the cage. We then undertook a geometry optimization by using a tight‐binding chemical method (GFN‐xTB) that mimics DFT and has been developed specifically for large molecular systems.15 We found that the encapsulated ee isomer is 28 kcal mol−1 lower in energy compared to the ea isomer and 45 kcal mol−1 lower in energy than the P‐N isomer (Supporting Information, Figures S88–S90). This difference is a result of geometric constraints imposed by the cage, and only in the ee isomer are the phosphine ligands oriented such that they can effectively fill the cavity and form pyridine–zinc porphyrin interactions with each side of the cage (Figure 2). Moreover, after optimization, the coordination geometries of the ea and P‐N isomers were converted from trigonal bipyramidal to square pyramidal, further confirming a suboptimal fit in the cage compared to that of the ee isomer. The average pyridine–zinc porphyrin distance in the optimized catalyst(ee)–cage assembly is 2.2 Å, which is identical to the literature value of 2.2 Å for a slightly bent Npy−Zn bond.16 The P−Rh−P bond angle of the ee isomer decreased from 120° to 117° upon encapsulation because of the rigid second coordination sphere forcing the two phosphine ligands closer to each other (Supporting Information, Table S13). Typically, such a large bite angle in rhodium bisphosphine complexes results in high selectivity for the linear aldehyde in hydroformylation catalysis.17 We therefore anticipated that the encapsulated bidentate rhodium catalyst could similarly result in linear selective hydroformylation of terminal alkenes.
Figure 2.
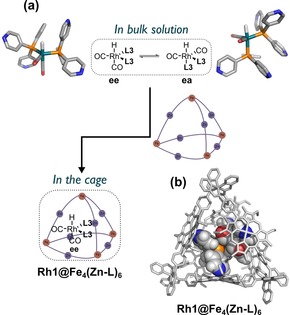
(a) A shift in equilibrium from a mixture of ee and ea isomers in the bulk solution to solely the ee isomer during encapsulation of the active species. (b) xTB‐optimized structure of the encapsulated active species Rh1@Fe4(Zn‐L)6.
Analysis of the cage by CSI‐MS
Modelling studies clearly showed that cage Fe4(Zn‐L)6 should have a suitable size and geometry to host the Rh1 catalyst. Confirmation of encapsulation of the catalyst came from high‐resolution mass spectrometric analysis of the assembly (for mass spectra, see Supporting Information, Section 8). Cold‐spray ionization mass spectrometry (CSI‐MS) of a solution of the empty host in dry acetonitrile gave a clean spectrum with signals corresponding to the expected molecular weight of the cage (Figure 3, top spectrum). Charge states of 8+, 5+, 4+ and 3+ are visible in the spectrum and correspond to different numbers of CF3SO3 − counterions lost during ionization. Some fragmentation of the cage was observed even though ionization was performed at −40 °C, as evident from the signal with a m/z ratio of 900 that belongs to a single ligand of the cage. In addition, the signal with the m/z ratio of 993 most likely stemmed from a symmetrical fragmentation of the cage during ionization.
Figure 3.
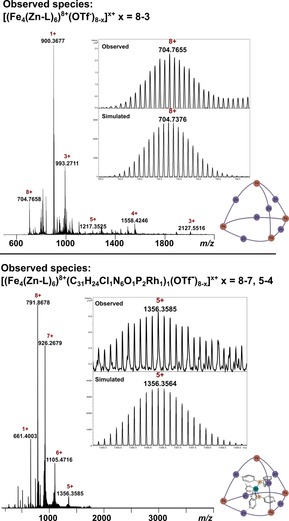
High‐resolution CSI‐MS spectra of the empty host and the catalyst–cage assembly. (Top) Full mass spectrum of Fe4(Zn‐L)6 showing the different charged species, with an inset showing the theoretical and experimental isotopic distribution of the 8+ signal. The peak with the m/z ratio of 900 belongs to a single ligand of the cage, and the peak with the m/z ratio of 993 belongs to a symmetrically fragmented cage. (Bottom) Full mass spectrum of Rh4@Fe4(Zn‐L)6 showing the different charged species, with an inset showing the theoretical and experimental isotopic distribution of the 5+ signal. The peak with the m/z ratio of 661 belongs to the fragment [Rh(CO)(L3)2]1+.
Next, a solution of equimolar amounts of the catalyst precursor Rh4 (pre‐formed by mixing 1 equiv Rh(acac)(CO)2 and 2 equiv L3) and Fe4(Zn‐L)6 in dry acetonitrile was analysed by the same method. The sample gave a clean spectrum with signals corresponding to a different elemental composition than that of the empty host (Figure 3, bottom spectrum). The signals agreed with the molecular formula Rh(CO)(Cl)(L3)2@Fe4(Zn‐L)6 in a 1:1 stoichiometry. The CO ligand stemmed from incomplete ligand displacement during the formation of Rh4, with CO being known to coordinate as a fifth ligand to these types of complexes.18 Chloride is inferred to have been introduced as an impurity in Fe(OTf)2, which was used for the cage self‐assembly.19 The acac ligand decoordinated upon ionization and was replaced by chloride in the mass spectrometer to preserve neutrality of the rhodium complex. A signal with a m/z ratio of 661 is also observed in the spectrum of the assembly, and it corresponds to the fragment [Rh(CO)(L3)2]1+. Most importantly, these results unambiguously confirm that the rhodium pre‐catalyst was selectively bound in the cage.
Mass spectra were also obtained for the free ligands L1, L2 and L3, along with the gold complex Au1, all in a 1:2 stoichiometry with respect to the cage. The measurements confirmed the selective formation of a 1:2 host–guest complex for multitopic ligands L2 and L3. For monotopic ligand L1, on the other hand, a statistical mixture of 1:1, 1:2, 1:3 and 1:4 host–guest complexes was formed. In the case of Au1, the spectrum showed signals corresponding to the molecular formula Au2@Fe4(Zn‐L)6. Hence, the Au−Cl bond was broken upon ionization in the mass spectrometer. These control experiments confirm the ability of multitopic guests to bind optimally in Fe4(Zn‐L)6.
Determination of binding constants of the ligands to the cage
Having established by mass spectrometry that guests bind selectively inside Fe4(Zn‐L)6 by multitopic coordination to the zinc(II) porphyrin building blocks, we next evaluated the binding strength of these guests in the cavity (for all binding data, see Supporting Information, Section 7). The binding constant of the ligand L3 (the same ligand as that in the catalytically active complex Rh1) to the cage was determined by titration of increasing amounts of L3 into a solution of Fe4(Zn‐L)6 in acetonitrile. A bathochromic shift of both the Soret band and Q bands of the cage porphyrins confirmed coordination of the pyridine groups to the axial positions of the zinc(II) porphyrins (Figure 4 a).20 The binding curves display a linear decrease in absorption as a function of equivalents of added guest, indicating strong binding of L3 in the cage (Figure 4 b). The absence of an isosbestic point around 550 nm suggested that a simple 1:1 binding model is not a valid description of this host–guest complex. Indeed, fitting of the titration data to a 1:1 host–guest equilibrium model did not result in acceptable fits, whereas fitting with a 1:3 host–guest equilibrium model yielded good fits from which the association constants can be extracted: K 1=3.12×10⁵ m −1, K 2=3.53×10⁵ m −1 and K 3=6.24×10³ m −1 (Table 2). A 1:2 binding model was also fitted, but the 1:3 model gave the best fit with the lowest error for the acquired data. The binding constants of the first two molecules of L3 are much higher than that of the third molecule; this suggests that these molecules are bound multitopically on the inside of the cage, whereas the binding of the third molecule occurred on the outside of the capsule by a monotopic interaction and, as such, is much weaker. The high association constants under these conditions are important because they indicate that the ligands and the corresponding rhodium complex should not leach out of the cage during catalysis.
Figure 4.
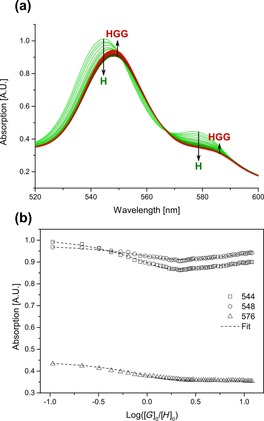
(a) Overlay of UV/Vis spectra of the titration of Fe4(Zn‐L)6 (host) and L3 (guest) at a constant host concentration of 8.8 μm in acetonitrile at 298 K. (b) Variation in the absorption at the Q bands versus the logarithm of the equivalents of added guest. H=host, G=guest, HGG=1:2 host–guest complex.
Table 2.
Microscopic association constants (K) for 1:3 host–guest binding of L1, L2, L3 and Au1 with nanocage Fe4(Zn‐L)6 in acetonitrile at 298 K.
| Guest | K 1 [m −1][a] | K 2 [m −1][b] | K 3 [m −1][c] |
|---|---|---|---|
| L1 | 2.53(±0.35)×103 | 1.37(±0.07)×103 | 1.34(±0.14)×103 |
| L2 | 1.72(±0.09)×105 | 6.71(±0.34)×104 | 3.44(±0.17)×103 |
| L3 | 3.12(±0.16)×105 | 3.53(±0.18)×105 | 6.24(±0.31)×103 |
| Au1 | 4.08(±0.20)×104 | 2.45(±0.12)×103 | 2.04(±0.10)×103 |
[a] K 1=K a, [b] K 2=α 1×K a, and [c] K 3=α 2×K a; where α 1 and α 2 are the cooperativity factors.
Next, the binding of ditopic guest L2 to the cage was investigated by a similar titration procedure as that for L3. The titration curves of L2 also fitted best to a 1:3 host–guest equilibrium model, giving association constants of K 1=1.72×10⁵ m −1, K 2=6.71×10⁴ m −1 and K 3=3.44×10³ m −1 (Table 2; all binding curves and fitted parameters are displayed in Supporting Information, Section 7). The binding of the first guest was around two times weaker than that for L3, consistent with ditopic binding compared with tritopic binding for L3. The binding of a second equivalent of guest L2 was roughly three times weaker than that of the first, whereas the third binding was roughly 20 times weaker than that of the second, consistent with monotopic coordination to the outside of the cage.
For the multitopic guest Au1, which is around 30 % larger than L3, a more significant difference can be seen in the binding when compared to the previously discussed guests (Table 2). Already the first binding event displayed a lower binding constant (K 1=4.08×10⁴ m −1) by nearly an order of magnitude compared to that of L3. The binding of a second molecule of Au1 proceeded with a binding constant that is about 20 times lower than the first binding, indicating that the second binding already occurs at the outside of the cage by monotopic coordination.
As control experiments, the binding of monotopic ligands Py and L1 was explored. For these ligands, no preference for binding on the inside of the cage was anticipated. Indeed, for Py, the titration curves fitted well with a 1:1 (with respect to the porphyrin ligand) host–guest equilibrium equation, giving a binding constant of 1.19×10³ m −1. The value obtained for 1:1 binding of Py to zinc(II) tetraphenylporphyrin (ZnIITPP) was nearly identical (1.18×10³ m −1), confirming that the Lewis acidity of the zinc atom in the porphyrin ligands of the cage is similar to those in the benchmark ZnIITPP.
Finally, the binding of guest L1 to Fe4(Zn‐L)6 was investigated. L1 also bears a single pyridine group, as with Py, but is more comparable in size to the other guests discussed so far (Table 1). The obtained titration curves did not fit to a 1:1, 1:4 or 1:6 host–guest binding model, but unexpectedly, the equilibrium equation for 1:3 host–guest binding gave the most reliable fit, with the least error. The binding constant for the binding of the first equivalent of L1 (K 1=2.53×10³ m −1) is around two times higher than that for Py, consistent with a different electronic structure. The 1:3 host–guest model appears to imply that encapsulation of L1 takes place; however, from previously discussed mass spectrometric measurements, we knew that selective binding of L1 on the inside of the cage did not occur.
To gain further insight into the encapsulation of the various guests, further binding studies were performed by 1D and 2D NMR spectroscopy (for all encapsulation studies, see Supporting Information, Section 8). For all of the guests, a broadening of the 1H NMR spectrum of the cage signals occurred upon encapsulation, indicating loss of symmetry of the host–guest complex in comparison with the highly symmetric structure of free Fe4(Zn‐L)6. As a typical example, the 1H NMR spectrum of (L2)2@Fe4(Zn‐L)6 is displayed in Figure 5 a, and the 1H NMR spectra acquired between 233 and 323 K are shown in Figure 5 b. Upon lowering the temperature to 233 K, several broad peaks are resolved into multiple sharper peaks, revealing that several species are in fast equilibrium on the NMR spectroscopic timescale (Figure 5 b). As a control experiment, the 1H NMR spectrum of the cage was recorded in the presence of triphenylphosphine, and as expected, no broadening of the peaks occurred. This observation confirmed that pyridine groups are required to drive encapsulation (Supporting Information, Figure S70). Furthermore, we concluded that binding did not involve the phosphorus atom, which remains available for coordination to rhodium.
Figure 5.
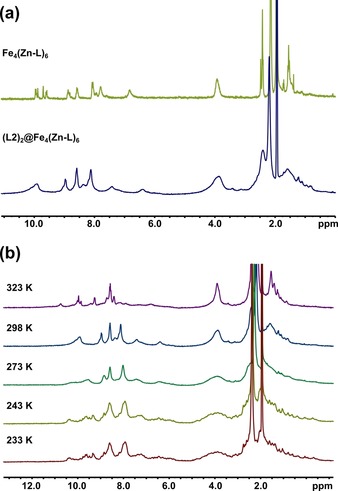
(a) 1H NMR (400 MHz, 298 K) spectrum of Fe4(Zn‐L)6 (top) and (L2)2@Fe4(Zn‐L)6 (bottom) in CD3CN. (b) Variable‐temperature 1H NMR (400 MHz) spectrum of (L2)2@Fe4(Zn‐L)6 in CD3CN.
For multitopic ligands L2 and L3, encapsulation was additionally confirmed by 2D DOSY 1H NMR spectroscopy. These experiments demonstrated that the host and guest had the same diffusion cross‐section and hence the same size. This size is the same as that of the empty host, indicating that binding did not affect the size of the host (Supporting Information, Figures S55 and S63).
Encapsulation of the catalyst precursor Rh4 was confirmed by 1H NMR and 2D DOSY 1H NMR spectroscopy (Supporting Information, Figures S73 and S74). Desymmetrization of the host upon encapsulation of a square planar complex with lower symmetry is clear from the increase in the number of signals (Figure 6). The tetrahedral symmetry of the cage was lost as a less symmetric guest occupied its interior. Because of the rather complicated spectrum, 1H NMR spectroscopy could not be used to assign the catalyst conformation.
Figure 6.
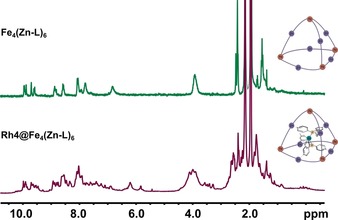
1H NMR (500 MHz, 298 K) spectrum of Fe4(Zn‐L)6 (top) and Rh4@Fe4(Zn‐L)6 (bottom) in CD3CN. The bottom spectrum contains a 1:2:1 mixture of Rh(acac)(CO)2, L3 and Fe4(Zn‐L)6.
Preparation of the encapsulated active species
We envisaged and explored two strategies to form the encapsulated active species (Figure 7; for more details, see Supporting Information, Section 9). In the first approach, catalyst activation occurred after encapsulation of the catalyst precursor. In the second approach, the catalyst precursor was converted to the active species, which was subsequently trapped by the cage. Simple mixing of all components (approach 1), followed by incubation under 10 bar syngas did not result in catalyst activation because no hydrido signals were observed in the 1H NMR spectrum (Supporting Information, Figure S80). However, pre‐activation of the catalyst precursor to form the hydrido complex, followed by cage addition (approach 2), successfully yielded the encapsulated active species as was clear from the in situ IR spectra. The reason why the encapsulated precursor Rh4 cannot be activated is unclear, but it is reasonable to assume that strong binding of the acac complex inside the cage provides additional barriers to activation because the coordination geometry of rhodium needs to change from square planar to trigonal bipyramidal.
Figure 7.
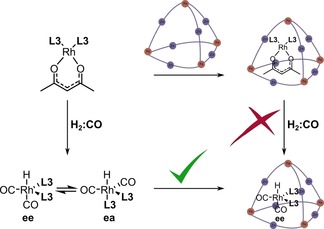
Strategies for the formation of the encapsulated active species.
The active rhodium hydrido complex was identified by high‐pressure IR spectroscopy in a mixture (2:3) of dichloromethane and acetonitrile by tracking the CO stretching frequencies (Supporting Information, Figures S81–S85). The active species in the bulk solution displayed four stretching frequencies at 2042, 2018, 2003 and 1987 cm−1, in line with a mixture of two complexes in which the ligands coordinate in ee or ea fashion (Figure 8 a). Upon encapsulation of the active species, a shift in the equilibrium between the species was observed; the encapsulated complex displays only two main stretching frequencies at 1993 and 1969 cm−1 (Figure 8 b). Moreover, the bands are redshifted compared to those of the non‐encapsulated active species, which may result from the altered bite angle in the cage.17 The CO stretching frequencies remain unchanged upon addition of 1‐octene, confirming that the initial complex formed is also the resting state of the reaction, in line with other bisphosphine‐based rhodium catalysts (Supporting Information, Figure S86).21 To gain further insight into the measured IR spectra, we calculated the vibrational spectra of the three different xTB‐optimized encapsulated catalyst geometries (ee, ea and P‐N) by using DFT (Supporting Information, Figures S92–S94). The complexes were extracted from the xTB‐optimized structures, and their geometries were further optimized by DFT with all atoms frozen except for the CO and hydrido ligands before calculation of the IR spectra. The same trend was observed in these calculations as in the ones of xTB; the ee isomer gave the lowest energy structure followed by ea and P‐N. As expected, the computed spectrum for the ee isomer closely resembles the shape of the obtained experimental spectrum (Supporting Information, Figure S92). This similarity confirms that the encapsulated active species has ee geometry, in line with results obtained from the xTB calculations on the host–guest complex. The computed spectra for the ea and P‐N isomers have different shapes compared with that of the ee isomer (Supporting Information, Figures S93 and S94).
Figure 8.
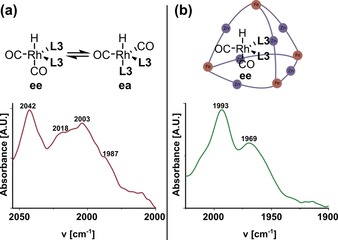
High‐pressure IR spectrum of the rhodium hydrido species (a) in the absence of the cage and (b) in the presence of the cage at 20 bar syngas at 298 K in a 3:2 mixture of acetonitrile and dichloromethane.
To confirm that the IR bands at 1993 and 1969 cm−1 are indeed from the encapsulated complex with ee geometry, deuterium labelling studies were performed by replacing H2/CO with D2/CO (Figure 9; for all experimental details, see Supporting Information, Section 13). Upon H/D exchange in the encapsulated Rh1 complex (leading to DRh(CO)2(L3)2), both CO bands shift to a lower wavenumber (Δν=4–6 cm−1), in line with expectations for the ee complex in which one CO ligand is trans to the hydrido ligand.22
Figure 9.
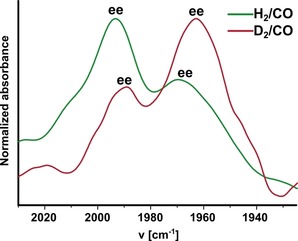
High‐pressure IR spectrum of Rh1@Fe4(Zn‐L)6 at 20 bar H2/CO (green trace) and at 20 bar D2/CO (red trace) at 298 K in a 3:2 mixture of acetonitrile and dichloromethane.
Application of the encapsulated catalyst in hydroformylation
After having characterized the encapsulated active species, we studied its catalytic performance in the hydroformylation of aliphatic and aromatic terminal alkenes (for experimental details, see Supporting Information, Section 12). To explore size‐selective hydroformylation catalysis with the current system, various substrates were studied including styrene, 4‐tert‐butylstyrene and 1‐octene, which were also modelled with Spartan (Supporting Information, Figure S95). The shortest H−H distance in styrene and 4‐tert‐butylstyrene is 6.7 Å, which corresponds to the distance between two aromatic hydrogen atoms. In 1‐octene, the shortest distance (4.9 Å) is between two hydrogen atoms of a methylene subunit. The window aperture size of the empty cage is 7.9 Å, but this value decreases to 5.0 Å in the optimized catalyst–cage assembly (see above). This smaller window means that aliphatic substrates will be able to freely diffuse into the cage, whereas aromatic substrates will not. This situation was expected to result in size‐selective catalysis with the encapsulated catalyst.
In a first experiment, the hydroformylation of 1‐octene was attempted by mixing all catalytic components, followed by pressurizing at 20 bar syngas. No conversion of 1‐octene was observed (even after 72 h at 70 °C), fully consistent with the observation that the rhodium pre‐catalyst was not activated when residing in the cage (Table 3, Entry 1). In the absence of the Fe4(Zn‐L)6 cage, 1‐octene was transformed into the aldehyde with 58 % conversion in 3 h at 70 °C (Table 3, Entry 4). An experiment in which all components were added in the presence of the Fe4(Zn‐L)6 cage containing C60 fullerene as a competing guest (blocking the catalyst precursor from the cavity), resulted in 85 % conversion of 1‐octene at 60 °C in 72 h (Table 3, Entry 2). Thus, the cage itself does not block the hydroformylation catalysis. Importantly, pre‐activation of the catalyst precursor for 1 h at room temperature, followed by the addition of the Fe4(Zn‐L)6 cage to encapsulate the activated complex and the substrate, led to an active catalyst system, in which 78 % of 1‐octene was converted in 72 h at 70 °C. These experiments confirm that activation of the catalyst precursor needed to occur in the absence of the cage (Table 3, Entry 4). Importantly, after 72 h of catalysis at 20 bar syngas, no precipitate appeared in the reaction mixture, strongly suggesting that the capsule is not destroyed under these conditions because the building block Zn‐L is not soluble in acetonitrile, and cage decomposition would have resulted in precipitation. Moreover, in separate control experiments, the 1H NMR spectrum of the cage remain unaltered, even after heating at 70 °C under 10 bar syngas for 72 h, confirming the cage stability under the applied catalytic conditions (Supporting Information, Figure S96).
Table 3.
Hydroformylation of various substrates using catalyst Rh1@Fe4(Zn‐L)6 at various temperatures in acetonitrile.[a]
| Entry | Catalyst | Substrate | T [°C] | Conv. [%] | l/b[b] |
|---|---|---|---|---|---|
| 1[c] | Rh1@Fe4(Zn‐L)6 | 1‐Octene | 70 | 0 | – |
| 2[d] | C60@Fe3(Zn‐L)4 | 1‐Octene | 60 | 85 | 2.7 |
| 3[e] | Rh1@Fe4(Zn‐L)6 | 1‐Octene | 70 | 78 | 2.4 |
| 4[f] | Rh1/Rh2 | 1‐Octene | 70 | 58 | 2.0 |
| 5[e] | Rh1@Fe4(Zn‐L)6 | Styrene | 70 | 0 | – |
| 6[f] | Rh1/Rh2 | Styrene | 70 | 33 | 0.08 |
| 7[e] | Rh1@Fe4(Zn‐L)6 | 4‐tBu‐styrene | 70 | 0 | – |
| 8[f] | Rh1/Rh2 | 4‐tBu‐styrene | 70 | 34 | 0.09 |
[a] Reagents and conditions: [Rh(acac)(CO)2]=0.15 mm, [L3]=0.3 mm, [Fe4(Zn‐L)6]=0.15 mm, [Substrate]=30 mm, 20 bar H2/CO (1:1). [b] Ratio of linear and branched aldehyde. [c] All reagents mixed from the beginning of the experiment; reaction time=72 h. [d] Fe4(Zn‐L)6 mixed with 1 equiv of C60 fullerene in acetonitrile, and then the Rh4 precursor and substrate were added, and the reaction was carried out for 72 h. [e] The catalytically active species was generated from Rh(acac)(CO)2 and L3 under 20 bar syngas at RT for 1 h, then the substrate and Fe4(Zn‐L)6 were added, and the reaction was carried out at 70 °C for 72 h. [f] No Fe4(Zn‐L)6 was present in the catalytic mixture, and the reaction was carried out at 70 °C for 3 h without pre‐activation of the catalyst.
Finally, to explore size‐selective catalysis, the hydroformylation of aromatic alkenes was studied (Table 3, Entries 5–8). Interestingly, encapsulation of the active species fully prevented it from reacting with styrene and 4‐tert‐butylstyrene; 0 % conversion was seen for both substrates (Table 3, Entries 5 and 7). In the absence of the cage, about 35 % of both substrates was converted after 3 h (Table 3, Entries 6 and 8). Clearly, the affinities of the substrates to the inner cavity of the cage were suitably different to allow for size‐selective catalysis. All further control experiments in the absence of the cage were run for 3 h, and all experiments in the presence of the cage were run for 72 h to ensure similar conversions of the substrates.
Next, we evaluated the effect of the second coordination sphere on the substrate selectivity of the encapsulated catalyst. For this purpose, we explored the conversion of a series of aliphatic terminal alkenes ranging from 1‐hexene to 1‐decene (Figure 10). As anticipated, the encapsulated catalyst preferentially converted shorter substrates, for which a quantitative conversion was obtained for the shortest substrate 1‐hexene at 70 °C in 72 h. Remarkably, 1‐heptene showed a significantly lower conversion of 33 % under identical conditions, despite its chain length being only a single methylene unit longer. The non‐encapsulated catalyst, however, showed a 72 % conversion of 1‐hexene and 65 % conversion of 1‐heptene, confirming that confinement of the catalyst in a rigid second coordination sphere is responsible for the observed substrate size‐selectivity. For 1‐octene, the encapsulated catalyst exhibited a higher conversion of 78 %, whereas only 14 % of 1‐nonene was converted.
Figure 10.
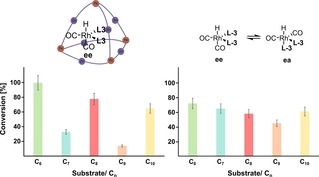
Results of the hydroformylation of alkenes ranging from 1‐hexene to 1‐decene (left) with the encapsulated catalyst and (right) with the catalyst in the bulk solution. All of the experiments were performed in duplicate, and estimated errors are 10 % and indicated with error bars.
Finally, 1‐decene was converted yet again at a higher proportion of 65 %. An odd‐even effect is markedly present; all even‐numbered alkenes displayed higher conversions than odd‐numbered ones. This observation indicated that the substrate must be fully encapsulated for catalysis to occur because such an effect would not be expected if it is sufficient for the substrate to be only partially encapsulated in the cage during catalysis. The odd‐even effect most likely arises from an enthalpically more favourable folding of certain alkenes inside the cage.23 Such an effect is not observed in the bulk solution, in which the non‐encapsulated catalyst converts all substrates with similar conversions. To gain a deeper understanding of the surprising odd‐even effect, we performed molecular modelling studies of the encapsulated catalyst–substrate complexes with three different substrates. First, the geometry of the complex was optimized by using xTB, and then the folded alkene was extracted from the structure and its energy was computed by DFT. The energies of the folded alkene structures were then compared with those of linear alkenes that were separately geometry‐optimized by using DFT. Interestingly, an odd‐even effect is also present in the folding energies of the alkenes, in which the odd‐numbered alkene 1‐heptene shows a thermodynamically more favourable folding inside the cage than that of the even‐numbered alkenes (Figure 11). This result suggests that odd‐numbered alkenes form more stable catalyst–substrate complexes inside the cage than those of the even‐numbered alkenes, resulting in lower reactivity and explaining the observed odd‐even effect (for more details on the correlation between the folding energies and the observed odd‐even selectivity, see Supporting Information, Section 11).
Figure 11.
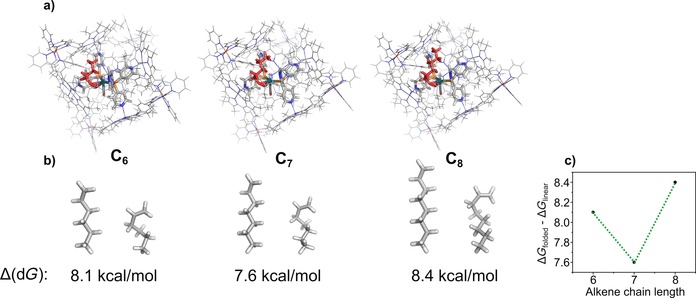
Results of the xTB and DFT calculations with the encapsulated catalyst–substrate complexes. (a) xTB‐optimized structures for catalyst–substrate complexes with 1‐hexene (left), 1‐heptene (middle) and 1‐octene (right). The folded alkene is shown in red. (b) Energies and structures of the alkenes calculated by DFT. Δ(dG) refers to the folding energy obtained by taking the difference in the Gibbs free energy of the folded alkene versus that of the linear alkene. (c) Odd‐even effect in the folding energy.
For all substrates, a slight increase in the linear to branched ratio (l/b ratio) is seen when performing the reaction in the cage, consistent with the bidentate character of the rhodium complex in the cavity. Although this shows the proof of principle, further optimization is required to achieve competing selectivities compared to those of the best catalysts known in literature.
To confirm that full encapsulation of the substrates is required, we explored the hydroformylation of substrate Sub1, which possesses a styrene functionalized with an aliphatic alkene tail (Figure 12). We envisioned that this substrate can pierce into the cage but is too large for full encapsulation. The encapsulated catalyst displayed no conversion of either side of the substrate at 70 °C after 72 h, confirming that full encapsulation of the substrate is required for cage catalysis to occur. In the absence of the cage, the catalyst displayed 7 % overall conversion after 3 h with a 1.2:1 ratio of aromatic to aliphatic aldehydes formed.
Figure 12.

Structure of the bifunctional substrate Sub1.
Having concluded that the cage was sufficiently rigid to induce substrate selectivity in single‐substrate experiments, we explored competition experiments with substrates of variable sizes. Mixtures of different aliphatic alkenes and styrene were studied, as well as mixtures of two aliphatic alkenes that differ in length. The size difference between styrene and aliphatic alkenes is larger, and therefore, a more pronounced size selectivity was expected compared to that of purely aliphatic alkene mixtures. Upon hydroformylation of a mixture of 1‐octene and styrene, the non‐encapsulated catalyst converted both substrates to yield the products with a ratio of 0.58 in favour of 1‐octene, which is a similar ratio to that found in the single‐substrate experiments (Table 4, Entry 8). This finding is consistent with the inherently lower reactivity of styrene compared to 1‐octene.3 In line with the single‐substrate experiments, the encapsulated catalyst has an even stronger preference for converting 1‐octene, leading to a product ratio of 0.15, which corresponds to a 4‐fold increase in selectivity upon catalyst encapsulation (Table 4, Entry 7).
Table 4.
Hydroformylation of a mixture of alkenes using the catalyst Rh1@Fe4(Zn‐L)6 in acetonitrile.[a]

| |||||||
|---|---|---|---|---|---|---|---|
| Entry | Assembly | Substrate 1 | Substrate 2 | Conv. 1 [%] | Conv. 2 [%] | Ratio of products 1:2 in mixtures |
Ratio of products 1:2 in single‐substrate experiments |
| 1[b] | Rh1@Fe4(Zn‐L)6 |

|

|
100 | 79 | 1.27 | 1.54 |
| 2[c] | Rh1/Rh2 |

|

|
24 | 26 | 0.92 | 1.18 |
| 3[b] | Rh1@Fe4(Zn‐L)6 |

|

|
40 | 38 | 1.05 | 0.42 |
| 4[c] | Rh1/Rh2 |

|

|
38 | 46 | 0.83 | 1.12 |
| 5[b] | Rh1@Fe4(Zn‐L)6 |

|

|
49 | 40 | 1.23 | 1.20 |
| 6[c] | Rh1/Rh2 |

|

|
37 | 42 | 0.88 | 0.95 |
| 7[b] | Rh1@Fe4(Zn‐L)6 |

|

|
5 | 33 | 0.15 | 0.00 |
| 8[c] | Rh1/Rh2 |

|

|
14 | 24 | 0.58 | 0.57 |
[a] Reagents and conditions: [Rh(acac)(CO)2]=0.15 mm, [L3]=0.3 mm, [Fe4(Zn‐L)6]=0.15 mm, [Substrate]=30 mm, 20 bar H2/CO (1:1). [b] The catalytically active species was generated from Rh(acac)(CO)2 and L3 under 20 bar syngas at RT for 1 h, then the substrates and Fe4(Zn‐L)6 were added, and the reaction was carried out at 70 °C for 72 h. [c] No Fe4(Zn‐L)6 was present in the catalytic mixture, and the reaction was carried out at 70 °C for 3 h without pre‐activation of the catalyst.
Next, mixtures of purely aliphatic alkenes were studied (Table 4, Entries 1–6). For all different mixtures, the encapsulated catalyst showed a preference for the conversion of the smaller substrate, whereas the free catalyst showed a preference for the conversion of the larger substrate. The best substrate selectivity was obtained for a mixture of 1‐hexene and 1‐decene, for which the products formed with a ratio of 1.27 in favour of the smaller aldehyde (Table 4, Entry 1). Similar substrate selectivity was observed in an experiment involving a mixture of 1‐octene and 1‐decene (product ratio=1.23, Table 4, Entry 5). Finally, for a mixture of 1‐heptene and 1‐octene, the preference for the formation of the smaller aldehyde was much smaller than expected, even given the small difference in substrate size (product ratio=1.05, in Table 4, Entry 3). The conversion of 1‐octene drops in the presence of 1‐heptene compared to that of the single‐substrate experiment. This inhibiting effect of 1‐heptene is in line with the more stable catalyst–substrate complex that is formed inside the cage, thereby blocking the active site from 1‐octene. This observation is in line with the folding energies computed by DFT (see above). The mixture experiments demonstrated that size‐selective hydroformylation was possible and worked best if there was a large difference in size between the substrates.
Conclusion
This work describes the first example of size‐selective hydroformylation by encapsulation of a rhodium complex in a molecular cage. The active rhodium phosphine complex is strongly bound inside the cavity by multitopic ZnII–pyridyl interactions. Because of the geometric constraints imposed by the surrounding cage structure, only the ee isomer of the active species is present inside the cage. When applied in hydroformylation of terminal alkenes, the encapsulated catalyst showed a clear preference for the conversion of smaller substrates. In single‐substrate experiments, an odd‐even effect was present, whereas the non‐encapsulated catalyst did not display such a selectivity. In competition experiments involving the presence of mixtures of substrates, the encapsulated catalyst also displayed substrate selectivity, although to a lower extent as expected based on the single‐substrate experiments. In this work, we have demonstrated that by simply modulating the second coordination sphere of a rhodium catalyst, substrate selectivity based on size can be evoked in hydroformylation catalysis. In future experiments, we will explore if this type of size‐selective catalyst can be applied to invoke selective conversions in complex mixtures of substrates and catalysts, and asymmetric transformations may be possible by application of the enantiomerically pure form of the same cage.
Experimental Section
General conditions for the hydroformylation reactions: All catalytic reactions were carried out in dry and degassed acetonitrile. Standard solutions for the pre‐catalyst, ligand, cage and substrate in acetonitrile were first prepared. Next, an autoclave (15 mL) with a separate sample container was evacuated and purged with nitrogen three times. The pre‐catalyst solution (1 mL, 0.6 mm stock solution; final catalytic concentration 0.15 mm) and the ligand solution (1 mL, 1.2 mm stock solution; final catalytic concentration 0.3 mm) were mixed in a dry Schlenk flask under nitrogen to allow for complex formation, and then the resulting pale‐yellow solution was injected into the mini autoclave by a syringe with a long stainless‐steel needle (about 25 cm). The autoclave was purged with 20 bar syngas (CO/H2=1:1) three times and subsequently pressurized with 20 bar syngas. The solution in the autoclave was allowed to pre‐incubate for 1 h at RT while being stirred at 900 rpm. Next, the cage solution (1 mL, 0.6 mm stock solution; final catalytic concentration 0.15 mm) and substrate solution (1 mL, 120 mm stock solution; final catalytic concentration 30 mm) were mixed in a dry Schlenk flask under nitrogen to give a dark red‐purple solution. The top part of the autoclave was depressurized while the bottom part of the autoclave containing the catalyst–ligand solution maintained a pressure of 20 bar syngas. The dark red‐purple solution was injected into the sample container of the autoclave under a flow of nitrogen, and the container was purged with 20 bar syngas three times. The cage–substrate solution was injected into the autoclave with a 5 bar overpressure of syngas, and the final pressure was adjusted to 20 bar. The autoclave was transferred into a pre‐heated oil bath, and the reaction was stirred at a constant speed (900 rpm). After the reaction was finished, the autoclave was cooled in an ice bath and depressurized. A drop of n‐tributylphosphite was added to quench the active rhodium catalyst, along with decane as an external standard. An aliquot of the reaction mixture was diluted with dichloromethane and injected into the GC directly without workup or product isolation.
Conflict of interest
The authors declare no conflict of interest.
Supporting information
As a service to our authors and readers, this journal provides supporting information supplied by the authors. Such materials are peer reviewed and may be re‐organized for online delivery, but are not copy‐edited or typeset. Technical support issues arising from supporting information (other than missing files) should be addressed to the authors.
Supplementary
Acknowledgements
We thank the European Research Council (ERC Adv. NAT‐CAT Reek) and the UK Engineering and Physical Sciences Research Council (EPSRC, EP/P027067/1) for financial support. W.B. acknowledges the support of the Leopoldina Fellowship Programme, German National Academy of Sciences Leopoldina (Grant LPDS 2014‐11). We acknowledge W. I. Dzik for determining the x‐ray diffraction structure of compound Au1, E. Zuidinga for mass spectrometric analyses and J. M. Ernsting for help with 2D DOSY 1H NMR spectroscopic measurements.
S. S. Nurttila, W. Brenner, J. Mosquera, K. M. van Vliet, J. R. Nitschke, J. N. H. Reek, Chem. Eur. J. 2019, 25, 609.
References
- 1.
- 1a. Seechurn C. C. C. J., Kitching M. O., Colacot T. J., Snieckus V., Angew. Chem. Int. Ed. 2012, 51, 5062–5085; [DOI] [PubMed] [Google Scholar]; Angew. Chem. 2012, 124, 5150–5174; [Google Scholar]
- 1b. Noyori R., Nat. Chem. 2009, 1, 5–6; [DOI] [PubMed] [Google Scholar]
- 1c. Franke R., Selent D., Börner A., Chem. Rev. 2012, 112, 5675–5732; [DOI] [PubMed] [Google Scholar]
- 1d. Cornils B., Herrmann W. A., Applied Homogeneous Catalysis with Organometallic Compounds, Wiley-VCH, Weinheim, 1996; [Google Scholar]
- 1e. Sheldon R. A., Arends I. W. C. E., Hanefeld U., Green Chemistry and Catalysis, Wiley-VCH, Weinheim, 2007; [Google Scholar]
- 1f. van Leeuwen P. W. N. M., Homogeneous Catalysis: Understanding the Art, Kluwer, Dordrecht, 2004; [Google Scholar]
- 1g. Tolman C. A., Chem. Rev. 1977, 77, 313–348. [Google Scholar]
- 2. Ringe D., Petsko G. A., Science 2008, 320, 1428–1429. [DOI] [PubMed] [Google Scholar]
- 3. Reetz M. T., Angew. Chem. Int. Ed. 2011, 50, 138–174; [DOI] [PubMed] [Google Scholar]; Angew. Chem. 2011, 123, 144–182. [Google Scholar]
- 4.
- 4a. Leenders S. H. A. M., Gramage-Doria R., de Bruin B., Reek J. N. H., Chem. Soc. Rev. 2015, 44, 433–448; [DOI] [PubMed] [Google Scholar]
- 4b. Yoshizawa M., Klosterman J. K. K., Fujita M., Angew. Chem. Int. Ed. 2009, 48, 3418–3438; [DOI] [PubMed] [Google Scholar]; Angew. Chem. 2009, 121, 3470–3490; [Google Scholar]
- 4c. Wiester M. J., Ulmann P. A., Mirkin C. A., Angew. Chem. Int. Ed. 2011, 50, 114–137; [DOI] [PubMed] [Google Scholar]; Angew. Chem. 2011, 123, 118–142; [Google Scholar]
- 4d. Raynal M., Ballester P., Vidal-Ferran A., van Leeuwen P. W. N. M., Chem. Soc. Rev. 2014, 43, 1734–1787; [DOI] [PubMed] [Google Scholar]
- 4e. Brown C. J., Toste F. D., Bergman R. G., Raymond K. N., Chem. Rev. 2015, 115, 3012–3035; [DOI] [PubMed] [Google Scholar]
- 4f. Vriezema D. M., Aragonès M. C., Elemans J. A. A. W., Cornelissen J. J. L. M., Rowan A. E., Nolte R. J. M., Chem. Rev. 2005, 105, 1445–1489; [DOI] [PubMed] [Google Scholar]
- 4g. Zarra S., Wood D. M., Roberts D. A., Nitschke J. R., Chem. Soc. Rev. 2015, 44, 419–432; [DOI] [PubMed] [Google Scholar]
- 4h. Hooley R. J., J. Rebek, Jr. , Chem. Biol. 2009, 16, 255–264. [DOI] [PMC free article] [PubMed] [Google Scholar]
- 5.
- 5a. Marty M., Clyde-Watson Z., Twyman L. J., Nakash M., Sanders J. K. M., Chem. Commun. 1998, 2265–2266; [Google Scholar]
- 5b. Walter C. J., Anderson H. L., Sanders J. K. M., J. Chem. Soc. Chem. Commun. 1993, 458–460; [Google Scholar]
- 5c. Kang J., Hilmersson G., Santamaría J., Rebek J., J. Am. Chem. Soc. 1998, 120, 3650–3656; [Google Scholar]
- 5d. Yoshizawa M., Tamura M., Fujita M., Science 2006, 312, 251–254; [DOI] [PubMed] [Google Scholar]
- 5e. Samanta D., Mukherjee S., Patil Y. P., Mukherjee P. S., Chem. Eur. J. 2012, 18, 12322–12329; [DOI] [PubMed] [Google Scholar]
- 5f. Mackay L. G., Wylie R. S., Sanders J. K. M., J. Am. Chem. Soc. 1994, 116, 3141–3142; [Google Scholar]
- 5g. Iwasawa T., Hooley R. J., Rebek J., Science 2007, 317, 493–496; [DOI] [PubMed] [Google Scholar]
- 5h. Pluth M. D., Bergman R. G., Raymond K. N., Science 2007, 316, 85–88; [DOI] [PubMed] [Google Scholar]
- 5i. Bolliger J. L., Belenguer A. M., Nitschke J. R., Angew. Chem. Int. Ed. 2013, 52, 7958–7962; [DOI] [PubMed] [Google Scholar]; Angew. Chem. 2013, 125, 8116–8120; [Google Scholar]
- 5j. Dalton D. M., Ellis S. R., Nichols E. M., Mathies R. A., Toste F. D., Bergman R. G., Raymond K. N., J. Am. Chem. Soc. 2015, 137, 10128–10131; [DOI] [PubMed] [Google Scholar]
- 5k. Kaphan D. M., Toste F. D., Bergman R. G., Raymond K. N., J. Am. Chem. Soc. 2015, 137, 9202–9205. [DOI] [PubMed] [Google Scholar]
- 6.
- 6a. Wang Z. J., Brown C. J., Bergman R. G., Raymond K. N., Toste F. D., J. Am. Chem. Soc. 2011, 133, 7358–7360; [DOI] [PubMed] [Google Scholar]
- 6b. Sarmentero M. A., Fernández-Pérez H., Zuidema E., Bo C., Vidal-Ferran A., Ballester P., Angew. Chem. Int. Ed. 2010, 49, 7489–7492; [DOI] [PubMed] [Google Scholar]; Angew. Chem. 2010, 122, 7651–7654; [Google Scholar]
- 6c. Wang Q.-Q., Gonell S., Leenders S. H. A. M., Dürr M., Ivanović-Burmazović I., Reek J. N. H., Nat. Chem. 2016, 8, 225–230; [DOI] [PubMed] [Google Scholar]
- 6d. Otte M., Kuijpers P. F., Troeppner O., Ivanović-Burmazović I., Reek J. N. H., de Bruin B., Chem. Eur. J. 2014, 20, 4880–4884; [DOI] [PubMed] [Google Scholar]
- 6e. Leung D. H., Fiedler D., Bergman R. G., Raymond K. N., Angew. Chem. Int. Ed. 2004, 43, 963–966; [DOI] [PubMed] [Google Scholar]; Angew. Chem. 2004, 116, 981–984. [Google Scholar]
- 7. Leung D. H., Bergman R. G., Raymond K. N., J. Am. Chem. Soc. 2008, 130, 2798–2805. [DOI] [PubMed] [Google Scholar]
- 8.
- 8a. Slagt V. F., Reek J. N. H., Kamer P. C. J., van Leeuwen P. W. N. M., Angew. Chem. Int. Ed. 2001, 40, 4271–4274; [DOI] [PubMed] [Google Scholar]; Angew. Chem. 2001, 113, 4401–4404; [Google Scholar]
- 8b. Slagt V. F., Kamer P. C. J., van Leeuwen P. W. N. M., Reek J. N. H., J. Am. Chem. Soc. 2004, 126, 1526–1536. [DOI] [PubMed] [Google Scholar]
- 9.
- 9a. Kleij A. W., Reek J. N. H., Chem. Eur. J. 2006, 12, 4218–4227; [DOI] [PubMed] [Google Scholar]
- 9b. Jacobs I., van Duin A. C. T., Kleij A. W., Kuil M., Tooke D. M., Spek A. L., Reek J. N. H., Hermansson K., Catal. Sci. Technol. 2013, 3, 1955–1963; [Google Scholar]
- 9c. Bocokić V., Lutz M., Spek A. L., Reek J. N. H., Dalton Trans. 2012, 41, 3740–3750; [DOI] [PubMed] [Google Scholar]
- 9d. Kuil M., Soltner T., van Leeuwen P. W. N. M., Reek J. N. H., J. Am. Chem. Soc. 2006, 128, 11344–11345; [DOI] [PubMed] [Google Scholar]
- 9e. Bocokić V., Kalkan A., Lutz M., Spek A. L., Gryko D. T., Reek J. N. H., Nat. Commun. 2013, 4, 2670; [DOI] [PubMed] [Google Scholar]
- 9f. Bellini R., Chikkali S. H., Berthon-Gelloz G., Reek J. N. H., Angew. Chem. Int. Ed. 2011, 50, 7342–7345; [DOI] [PubMed] [Google Scholar]; Angew. Chem. 2011, 123, 7480–7483; [Google Scholar]
- 9g. Gadzikwa T., Bellini R., Dekker H. L., Reek J. N. H., J. Am. Chem. Soc. 2012, 134, 2860–2863; [DOI] [PubMed] [Google Scholar]
- 9h. Besset T., Norman D. W., Reek J. N. H., Adv. Synth. Catal. 2013, 355, 348–352; [Google Scholar]
- 9i. Wang X., Nurttila S. S., Dzik W. I., Becker R., Rodgers J., Reek J. N. H., Chem. Eur. J. 2017, 23, 14769–14777. [DOI] [PMC free article] [PubMed] [Google Scholar]
- 10. Otte M., ACS Catal. 2016, 6, 6491–6510. [Google Scholar]
- 11.
- 11a. Catti L., Tiefenbacher K., Chem. Commun. 2015, 51, 892–894; [DOI] [PubMed] [Google Scholar]
- 11b. Zhang Q., Tiefenbacher K., J. Am. Chem. Soc. 2013, 135, 16213–16219; [DOI] [PubMed] [Google Scholar]
- 11c. Kuijpers P. F., Otte M., Dürr M., Ivanović-Burmazović I., Reek J. N. H., de Bruin B., ACS Catal. 2016, 6, 3106–3112; [Google Scholar]
- 11d. Jiao Y., Wang J., Wu P., Zhao L., He C., Zhang J., Duan C., Chem. Eur. J. 2014, 20, 2224–2231; [DOI] [PubMed] [Google Scholar]
- 11e. Wu X., He C., Wu X., Qu S., Duan C., Chem. Commun. 2011, 47, 8415–8417; [DOI] [PubMed] [Google Scholar]
- 11f. Leung D. H., Bergman R. G., Raymond K. N., J. Am. Chem. Soc. 2007, 129, 2746–2747; [DOI] [PubMed] [Google Scholar]
- 11g. Leung D. H., Bergman R. G., Raymond K. N., J. Am. Chem. Soc. 2006, 128, 9781–9797; [DOI] [PubMed] [Google Scholar]
- 11h. Wiester M. J., Mirkin C. A., Inorg. Chem. 2009, 48, 8054–8056; [DOI] [PMC free article] [PubMed] [Google Scholar]
- 11i. Oliveri C. G., Gianneschi N. C., Nguyen S. T., Mirkin C. A., Stern C. L., Wawrzak Z., Pink M., J. Am. Chem. Soc. 2006, 128, 16286–16296. [DOI] [PMC free article] [PubMed] [Google Scholar]
- 12. Wood D. M., Meng W., Ronson T. K., Stefankiewicz A. R., Sanders J. K. M., Nitschke J. R., Angew. Chem. Int. Ed. 2015, 54, 3988–3992; [DOI] [PubMed] [Google Scholar]; Angew. Chem. 2015, 127, 4060–4064. [Google Scholar]
- 13. Voss N. R., Gerstein M., Nucleic Acid Res. 2010, 38, W555–W562. [DOI] [PMC free article] [PubMed] [Google Scholar]
- 14. Mecozzi S., J. Rebek, Jr. , Chem. Eur. J. 1998, 4, 1016–1022. [Google Scholar]
- 15. Grimme S., Bannwarth C., Shushkov P., J. Chem. Theory Comput. 2017, 13, 1989–2009. [DOI] [PubMed] [Google Scholar]
- 16. Cremers J., Richert S., Kondratuk D. V., Claridge T. D. W., Timmel C. R., Anderson H. L., Chem. Sci. 2016, 7, 6961–6968. [DOI] [PMC free article] [PubMed] [Google Scholar]
- 17. van der Veen L. A., Keeven P. H., Schoemaker G. C., Reek J. N. H., Kamer P. C. J., van Leeuwen P. W. N. M., Lutz M., Spek A. L., Organometallics 2000, 19, 872–883. [Google Scholar]
- 18. Dingwall L. D., Lee A. F., Lynam J. M., Wilson K., Olivi L., Deeley J. M. S., Gaemers S., Sunley G. J., ACS Catal. 2012, 2, 1368–1376. [Google Scholar]
- 19.
- 19a. Freye S., Hey J., Torras-Galán A., Stalke D., Herbst-Irmer R., John M., Clever G. H., Angew. Chem. Int. Ed. 2012, 51, 2191–2194; [DOI] [PubMed] [Google Scholar]; Angew. Chem. 2012, 124, 2233–2237; [Google Scholar]
- 19b. Riddell I. A., Smulders M. M. J., Clegg J. K., Hristova Y. R., Breiner B., Thoburn J. D., Nitschke J. R., Nat. Chem. 2012, 4, 751–756; [DOI] [PubMed] [Google Scholar]
- 19c. Ye W., Ho D. M., Friedle S., Palluccio T. D., Rybak-Akimova E. V., Inorg. Chem. 2012, 51, 5006–5021. [DOI] [PubMed] [Google Scholar]
- 20. Nappa M., Valentine J. S., J. Am. Chem. Soc. 1978, 100, 5075–5080. [Google Scholar]
- 21. van Leeuwen P. W. N. M., Claver C., Rhodium Catalyzed Hydroformylation (Catalysis by Metal Complexes), Kluwer, Dordrecht, 2002. [Google Scholar]
- 22.
- 22a. Van Der Veen L. A., Boele M. D. K., Bregman F. R., Kamer P. C. J., Van Leeuwen P. W. N. M., Goubitz K., Fraanje J., Schenk H., Bo C., J. Am. Chem. Soc. 1998, 120, 11616–11626; [Google Scholar]
- 22b.The ratio between the two stretching frequencies is also modulated upon H/D exchange, which is likely due to a shift in the baseline between experiments.
- 23. Scarso A., Trembleau L., Rebek J., J. Am. Chem. Soc. 2004, 126, 13512–13518. [DOI] [PubMed] [Google Scholar]
Associated Data
This section collects any data citations, data availability statements, or supplementary materials included in this article.
Supplementary Materials
As a service to our authors and readers, this journal provides supporting information supplied by the authors. Such materials are peer reviewed and may be re‐organized for online delivery, but are not copy‐edited or typeset. Technical support issues arising from supporting information (other than missing files) should be addressed to the authors.
Supplementary


