Abstract
Somatic gene recombination of amyloid precursor protein (APP) in human neurons has been identified, encompassing thousands of genomic variants occurring mosaically in normal and sporadic Alzheimer’s disease (AD) brains. Multiple sequencing strategies and junction-specific genomic in situ hybridization revealed APP recombination, lacking introns and having precise exonic junctions, termed genomic cDNAs (gencDNAs), often with multiple recombined junctions contained within a single nucleus. Most variants showed structural changes, particularly deletion of central exons with partial exons fused together, forming intra-exonic junctions, containing single nucleotide variations. APP is a causal gene mutated in forms of AD, and our studies identified variants enriched in sporadic AD neurons, including 10 mutations identical to those in published familial AD, yet arising somatically. Additional studies linked APP neuronal RNA transcription to the appearance of gencDNAs that could be preferentially transcribed to generate myriad gene variants contributing to diversity and function in the normal and diseased brain.
Keywords: genomic mosaicism, somatic mutation, neurodegenerative disease, plasticity, memory, RNA
Introduction
Neuronal diversity in form and function are intrinsic properties of normal and diseased human brains. The basis of this diversity remains largely unknown, but might arise from gene recombination, as speculated in 19671 by analogy to then postulated antibody generation that was later identified2. However, concerted searches3–6 over the past 50 years have failed to identify neuronal gene recombination. Nevertheless, subsequent identification of neuronal genomic mosacism (NGM), arising somatically to produce neuronal cells with distinct if seemingly random genomic changes, suggests neuronal genome dynamism that might include gene recombination. NGM was first identified as aneuploidies and DNA content variation, both representing large copy number variations (CNVs)7–9. Smaller megabase-scale CNVs10,11, LI repeat elements12, and single nucleotide variations (SNVs)13,14 were subsequently documented. Functionally, NGM can influence cell survival15, gene transcription16, and has been used as a human neuronal lineage marker17. However, specific gene rearrangements or recombination in post-mitotic neurons has not been reported, which might in part reflect technical impediments to sequence analyses of mosaic genomes, fundamentally contrasting with clonal amplification of a stereotyped genomic change produced in tumors and cell lines that were used to identify V(D)J recombination in the immune system2.
One exception to the absence of specific genes affected by NGM is APP, which showed mosaic CNVs in normal human brain that were increased in sporadic AD (SAD)18, the most common form of AD and causally unlinked to inherited genes. Notably, constitutive APP mutations and duplications are causative for AD neuropathology present in forms of familial AD (FAD)19–21 and Down syndrome (DS: constitutive trisomy 21 with 3 APP copies,22). APP is also central to the amyloid hypothesis of AD wherein APP is cleaved by β- and γ- secretases to form toxic Aβ peptides, leading to plaque formation and AD23. APP CNVs were identified in SAD studies using single-neuron quantitative PCR (qPCR) that simultaneously assessed proximal and distal exons (3 and 14, respectively), which showed not only increased exonic CNVs but also examples of single neurons with a discordance between predicted exon copy numbers18. This result suggested that APP exons might be independently altered as could be produced by gene recombination, an interpretation independently supported by quantitative (qFISH) that revealed a spectrum of APP fluorescence hybridization signal intensities and morphologies. We therefore began interrogation of APP sequences, structures, and exon copies within individual neuronal genomes of both normal and SAD brains.
Initial attempts to interrogate APP by single-neuron genomic sequencing10,11,14 produced negative results. However, since the germline organization of APP consists of 18 exons spanning ~0.3 Mb and the published resolution of single-neuron sequencing is limited to several Mb10,11,24, this approach appeared to lack sufficient resolving power. An alternative approach consisting of 8 independent lines of evidence were used here to interrogate the detailed genomic structure of APP present mosaically in neurons.
Novel APP RNA variants from small populations of neuronal nuclei
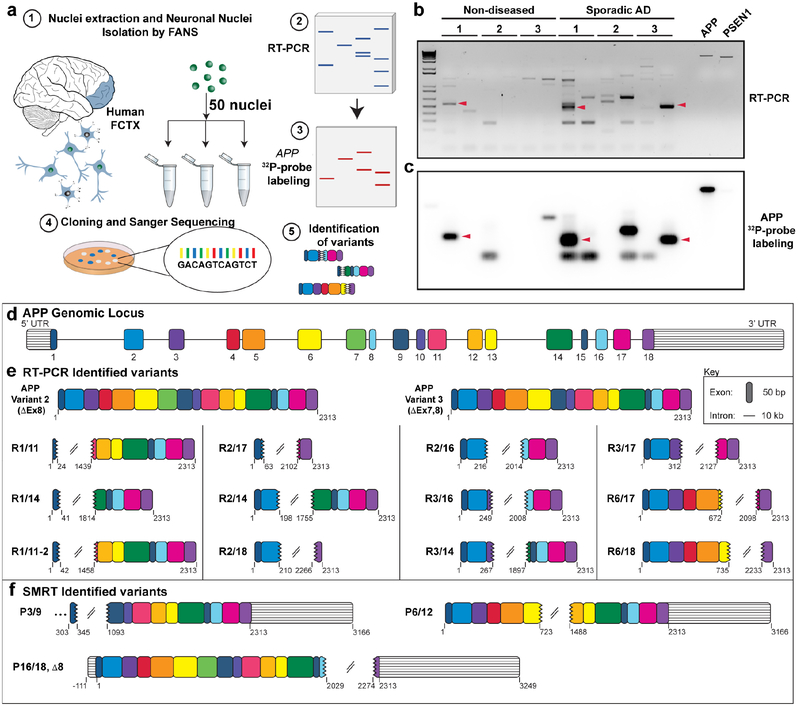
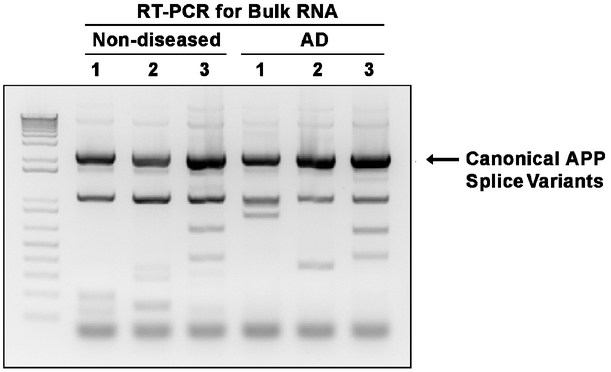
We postulated that APP genomic sequence alterations existing mosaically, could be detected in transcriptionally amplified RNA if assessments were focused on small populations of neuronal nuclei. This approach increased the odds of interrogating mosaic loci from affected neurons18 while reducing template competition from wild-type APP RNA sequences. The postulated target sequences would then be detected by RT-PCR in nuclei isolated by fluorescence activated nuclear sorting (FANS)25. The workflow (Fig. 1a) commenced with FANS to isolate neurons from both non-diseased and verified SAD prefrontal cerebral cortex (Extended Data Table 1), which were run in parallel throughout the study, since APP somatic CNVs were detected in both normal and SAD brains. Groups of 50, NeuN-positive neuronal nuclei were isolated and processed for RT- PCR (Fig. 1a). Validated primers capable of amplifying full-length APP cDNA (APP 770, NM_000484.3) were used, followed by agarose gel electrophoresis. In small population RT-PCR, the expected splice variants APP 751(NM_201413.2) and APP 695 (NM_201414.2) were detected26. However, a range of unexpected, often smaller bands of varied sizes were often identified (Fig. 1b). RT-PCR on bulk RNA always detected the highly expressed canonical APP splice variants as the major product, with rare instances of smaller, unexpected bands (Extended Data Fig.1). These RT-PCR products were Southern blotted with 32P-labeled APP cDNA probes (Fig. 1c), which produced positive bands from duplicate gels, that were cloned and Sanger sequenced. In addition to the known APP splice variants 751 and 695, the new bands yielded novel APP cDNA sequence variants unlike any previously reported, characterized by loss of central exons with proximal and distal exons linked by intra-exonic junctions (IEJs) (Fig. 1d). Twelve novel RNA variant sequences with unique IEJs were identified (Fig.1e). One prevalent form was characterized by an IEJ between the 24th nucleotide of exon 3 and 45th nucleotide of exon 16 (Fig. 1e, “R3/16”). Interestingly, the sequence complementarity of joined exons was found in 11 IEJs ranging in overlap from 2 to 20 nucleotides (Extended Data Fig. 2). To rule-out PCR artifacts, we interrogated two, independently produced long-read RNAseq data sets derived from oligo-dT-primed RNA from whole SAD brain and SAD temporal lobe27,28, which yielded rare variants with similar IEJs (Fig. 1f).
Figure 1. Identification of novel APP RNA variants from small populations of neurons.
(a) (1)50-neuronal nuclei were sorted from human prefrontal cortices (FCTX) by fluorescence-activated nuclear sorting (FANS) and used for (2) RT-PCR. Resulting RT-PCR products were screened by (3) Southern blot with 32P-labeled APP cDNA probes. (4) Bands with positive signals from duplicate gels were cloned and sequenced. (b) Electrophoresis of RT-PCR products from 3 non-diseased and 3 sporadic AD brains. APP and PSEN1 plasmids were run as positive and negative controls for Southern blotting, respectively. (c) Southern blot of RT-PCR products. Arrows indicate examples of corresponding bands from (b) that were cloned and Sanger sequenced. (d) Structure of human APP genomic locus drawn to scale, each exon is labeled with a different color, and the color scheme remains consistent throughout all figures. (e) APP RNA variants identified by RT-PCR. (f) APP RNA variants identified from independent long-read single molecule real-time (SMRT) sequencing data sets.
Novel APP gencDNAs in genomic DNA from small populations of neuronal nuclei
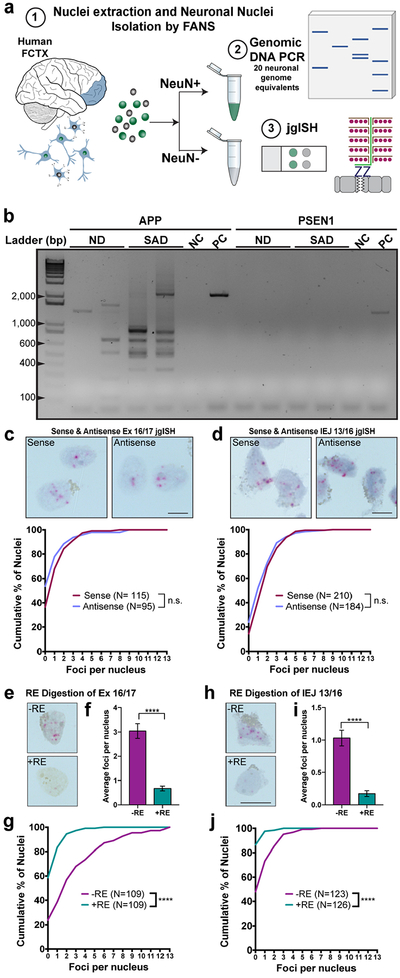
The existence of previously unidentified RNA variants begged the question of whether this transcriptional heterogeneity may arise from mosaic variation in genomic DNA. This possibility was supported by the previously noted discordance of APP exonic copies detected by qPCR and irregular shaped APP loci detected by qFISH18. High-stringency amplification using the same APP primers, previously used for RNA/cDNA analyses, was pursued on thoroughly RNased DNA obtained from sets of 20 neuronal nuclei from both normal and SAD brains (Fig. 2a). Since the wild-type APP genomic locus covers ~0.3 Mb (Fig. 1d), PCR amplification from exon 1 through intervening exons and introns to exon 18 was not technically possible. However, PCR of nuclear genomic DNA generated clear bands that were similar in size to novel variants from RNA-derived RT-PCR products (Fig. 2b,~100–2,300 bp). Interrogation of a second AD related gene, Presenilin 1(PSEN1), did not produce products from genomic DNA (Fig. 2b; 94 Kb). Cloning and Sanger sequencing of these genomic DNA products revealed a range of gencDNAs showing precise exon::exon junctions, central exon deletions, and IEJs, including some species with sequences identical to the novel RNA variants previously identified (Extended Data Fig. 3).
Figure 2. APP gencDNAs identified by DNA polymerase dependent and independent methods.
(a)(1)Neuronal nuclei from human prefrontal cortices (FCTX) were used for (2) genomic DNA PCR and (3) junction-specific genomic in situ hybridization (jgISH). (b) Electrophoresis of genomic DNA PCR products with APP and PSEN1 primer sets using DNA from non-diseased (ND) and sporadic AD (SAD) neurons. Non-template control (NC) and positive control (PC) with indicated plasmids are shown. (c,d) jgISH was performed with sense and anti-sense probes targeting the (c) APP exon 16 and exon 17 junction (Ex 16/17), and (d) the intra-exonic junction between APP exon 3 and exon 16 (IEJ 3/16) on SAD neuronal nuclei. Cumulative frequency distributions showed no significant differences between probes. (e-j) Restriction enzyme (RE) digestion using (e-g) MluCI and (h-j) PstI+MslI to eliminate Ex 16/17 and IEJ 3/16 target sequences, respectively. (e,h) Representative jgISH nuclei. (f,i) Quantification of average foci per nucleus; statistical significance was determined using the unpaired, two-tailed Mann-Whitney test. (g,j) Cumulative frequency distributions represented as the number of foci per nucleus compared using the unpaired, two-tailed non-parametric Kolmogorov-Smirnov test. ****p<0.0001. n.s., not-significant. Error bars are ±SEM. Scale bars, 10μm.
Identification of APP gencDNA sequences in genomic DNA of single nuclei by jgISH
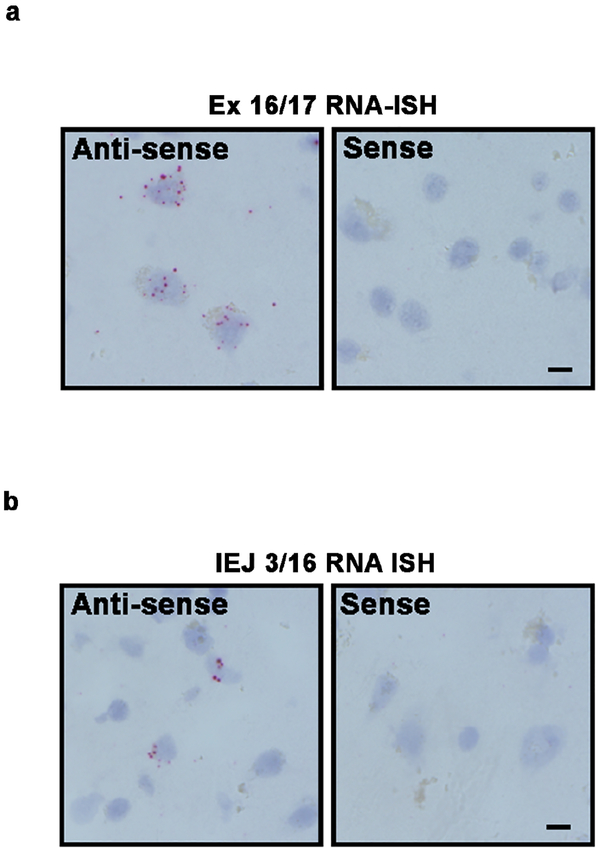
To validate the presence of APP gencDNA junctions within single neuronal genomes without polymerase based amplification, jgISH was developed. Briefly, our method extensively modified sample preparation and hybridization protocols of a commercial RNA-ISH product, BaseScope (ACD, Newark, CA) to recognize genomic DNA sequences. BaseScope technology (Advanced Cell Diagnostics) uses paired ISH probes to eliminate hybridization artifacts and can detect recombination events with single base pair accuracy. All probes passed multiple specificity requirements involving both positive and negative controls (Extended Data Table 2). Two jgISH probes were used: one that recognized most identified gencDNAs via the exon16::exon 17 junction (Ex 16/17), which spans the Aß coding region of APP; and one that recognized the newly identified IEJ formed between exons 3 and 16 (IEJ 3/16), representing one APP variant. All bound probes were enzymatically visualized, appearing as red dots of varied diameter. Both sense and anti-sense jgISH probes produced similar results in RNase treated SAD neuronal nuclei (Fig. 2c,d). By comparison, RNA signals were only detected using the anti-sense probes (Extended Data 4a,b); therefore sense probes were exclusively used for genomic DNA detection. Critically, jgISH sense probe signals were eliminated by specific restriction enzyme digestion of genomic DNA that eliminated the sequence recognition site (Fig. 2e–j). Taken together, our jgISH protocol detected specific genomic junctions without polymerase dependent template amplification. Moreover, use of Ex16/17 and IEJ 3/16 probes identified the predicted mosaic presence of these gencDNA sequences in neuronal nuclei (Fig. 2c–j).
Thousands of distinct APP gencDNAs from small populations of neuronal nuclei
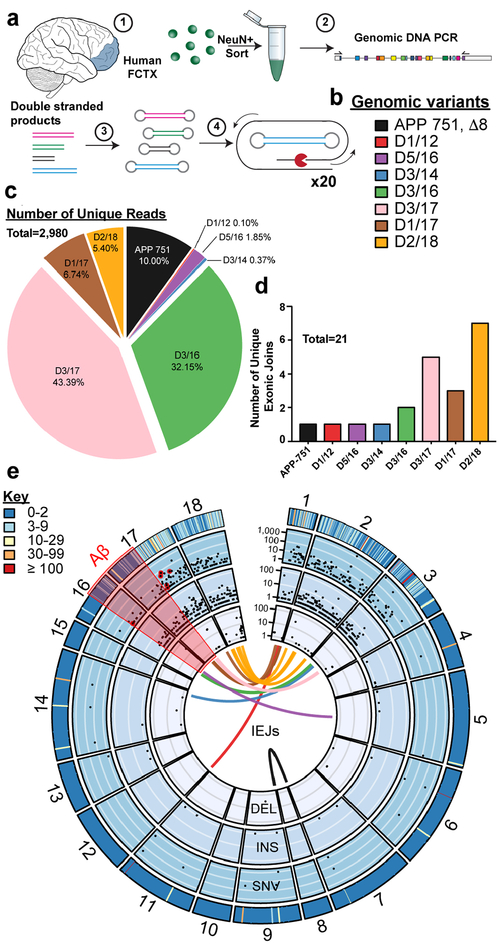
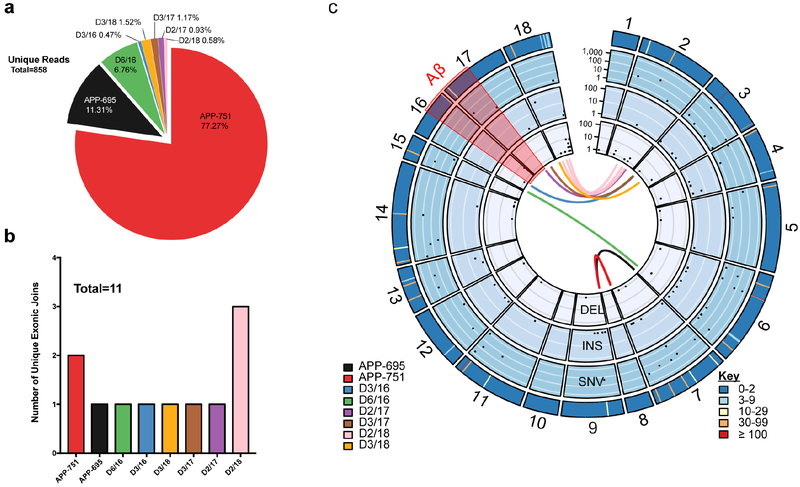
The selectivity of jgISH probes for short stretches of recombined DNA sequences left open the question of overall APP gencDNA diversity, which required a distinct technical approach employing single molecule real-time (SMRT) sequencing. SMRT circular consensus sequencing (CCS) allows for high-certainty long-read calls produced by multiple passes over the same template that is comparable in fidelity to Sanger sequencing29. To better assess APP gencDNA forms beyond low-throughput cloning and Sanger sequencing, the previous PCR approach was scaled-up using multiple independent reactions on small neuronal populations from brains (Fig. 3a), utilizing a DNA polymerase with 100× higher fidelity compared to native Taq (Invitrogen, Platinum SuperFi DNA Polymerase). The resulting samples were pooled for library preparation to enable SMRT CCS of single DNA molecules. SMRT libraries yielded high-certainty consensus calling30 (20 CCS subreads with 99.9999% accuracy, median Phred score of 93). Remarkably, 2,980 unique sequences including 21 different IEJs were identified in neuronal nuclei of 2 SAD brains (Fig. 3b–e), and 858 unique sequences including 11 IEJs were found in neuronal nuclei of 1 non-diseased brain (Extended Data Fig. 3). Of additional note, gencDNAs of the canonical neuronal splice variant, APP 751, were also identified in both SAD and non-diseased datasets. SNVs, and insertions and deletions (INDELs) also occurred within APP gencDNAs of both SAD and non-diseased brain (Fig. 3e and Extended Data Fig. 5c).
Figure 3. Thousands of unique gencDNAs identified by SMRT sequencing from SAD brains.
(a)(1)Neuronal nuclei from SAD prefrontal cortex (FCTX) were sorted and used for (2) genomic DNA PCR. Multiple reactions were pooled for (3)library preparation to enable (4) high fidelity sequencing (SMRT 20× CCS calling). (b) All intra-exonic junctions (IEJs) identified. (c) Total number and proportion of unique reads from each identified IEJ form. (d) Number of unique IEJs forms. (e) A concentric circle plot of the APP locus (exon numbers along perimeter) depicting IEJs (connecting lines inside the circles), deletions (DEL) (first inner circle), insertions (INS) (second inner circle), and single nucleotide variations (SNVs) (third inner circle). Black dots indicate the abundance of DELs, INSs, and SNVs on a log(10) scale at the specified exon location. The outermost circle depicts the sum count (key) of unique changes. The Aβ region is highlighted in red, and known familial AD mutations are circled in red.
Proof-of-concept linkage between gencDNAs and AD in neurons
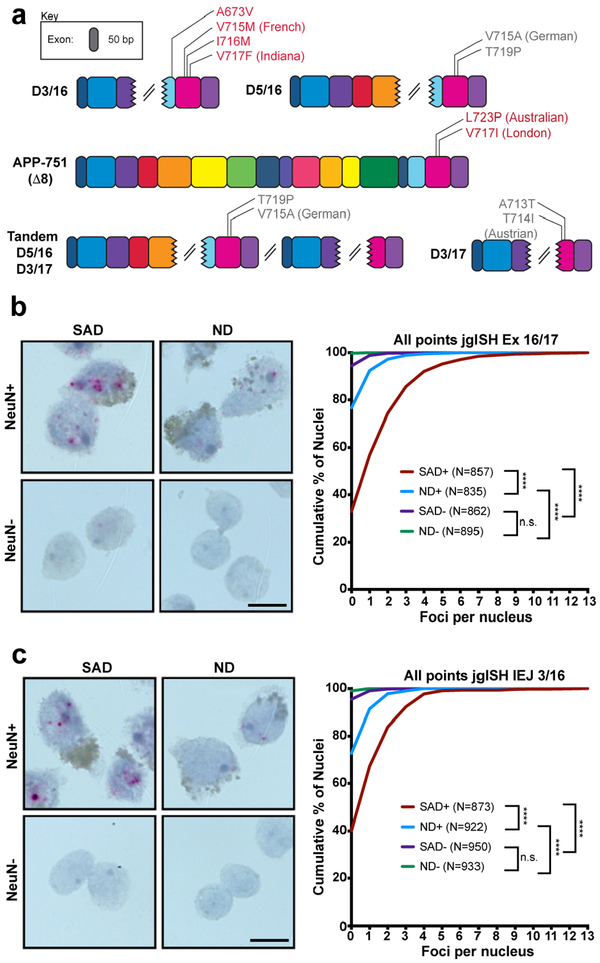
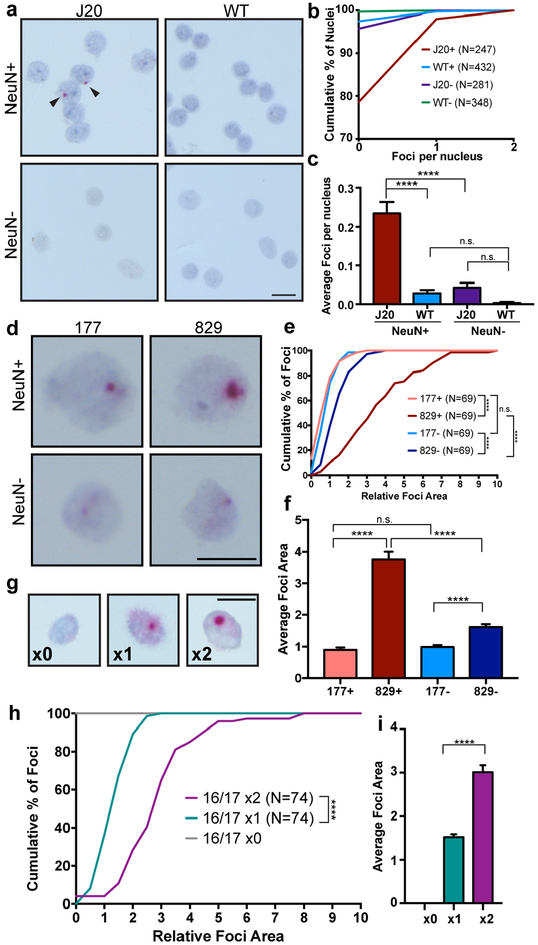
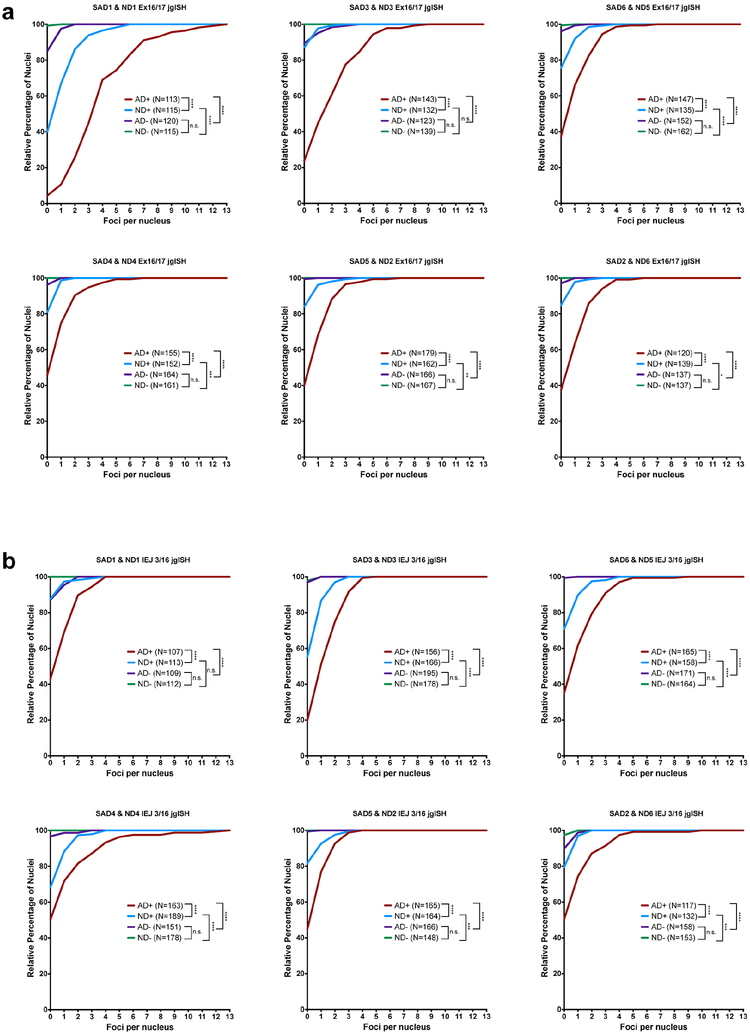
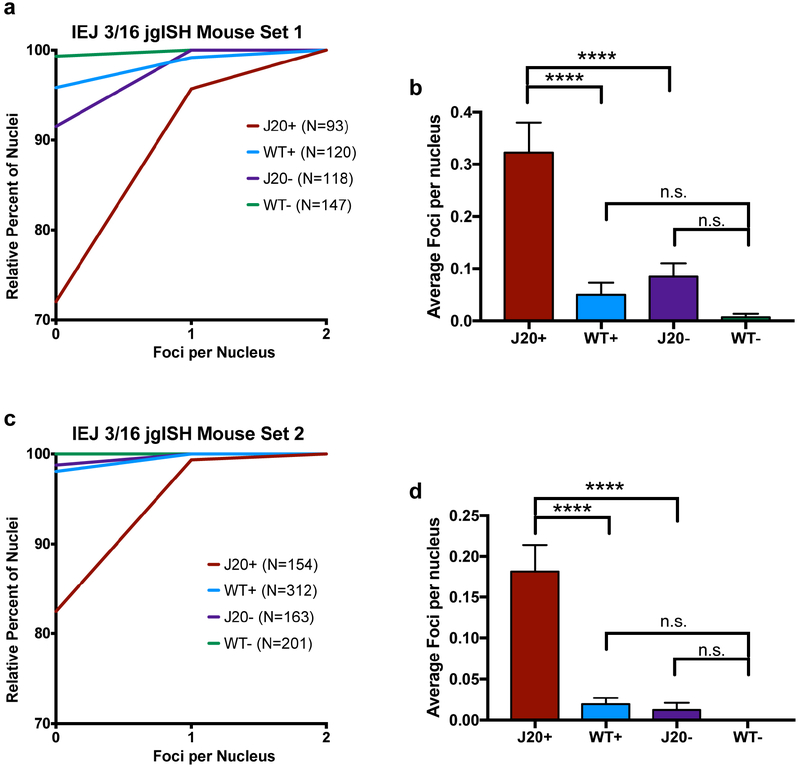
In view of myriad APP mutations and variants that drive FAD, we assessed gencDNA forms of mosaic neuronal recombination for potential relevance to SAD. This possibility was supported by the remarkable presence of 10 different SNVs in gencDNA variants from SAD but not non-diseased neurons that were identical to previously reported pathogenic FAD APP mutations, including the well-known Indiana mutation19 (Fig. 3e, 4a). Further relationships of identified gencDNA variants to SAD were therefore assessed by comparing non-diseased and SAD neurons using jgISH. Two gencDNA junctions, Ex 16/17 and IEJ 3/16, were examined in neurons from 6 clinically and neuropathologically verified SAD brains (Extended Data Table 1) and compared to 6 non-diseased brains (Fig. 4b,c, Extended Data Fig. 6). The number of red foci in AD neurons was 3–5 fold higher than in non-diseased neurons. Rare foci were observed in non-neuronal (NeuN-negative) nuclei that were not statistically significant between cells from SAD and non-diseased brain, despite being from the same brains that had revealed disease-related changes in neurons. These results raised the question of whether a well-characterized mouse model of AD, the J20 mutant APP transgenic mouse31-in which, interestingly, the employed Swedish and Indiana cDNA transgenes resemble APP gencDNAs - might give rise to IEJs. Recombination of APP at both Ex 16/17 and IEJ 3/16 was indeed present in the J20 neurons (Fig. 5a–c, Extended Data Fig. 7). These data are consistent with some form of additional processing of the J20 transgene cDNAs to produce the variant 3/16 IEJ, linking at least one of the identified thousands of gencDNAs to the J20 model phenotype that includes CNS deficits and amyloid plaques. Positive signals in SAD neurons will require larger human SAD cohorts to solidify the APP gencDNA variant relationships to SAD forms, however, their dominant appearance in all proof-of-concept samples supports further study.
Figure 4. Proof-of-concept correlation between gencDNAs and Alzheimer’s disease.
(a)10 different familial AD mutations present in APP gencDNAs. In-frame (red) and out-of-frame (grey) mutations are indicated based on the known APP reading frame analysis. (b,c) Nuclei sorted from 6 ND and 6 SAD cortices were analyzed by (b) Ex 16/17 and (c) IEJ 3/16 jgISH. Cumulative frequency distribution plots of the number of foci per nucleus showed statistical significance (nonparametric Kruskal-Wallis test with Dunn’s multiple corrections). ****P<0.0001. n.s., not-significant. Error bars are ±SEM. Scale bars, 10μm.
Figure 5. Evidence for the involvement of APP transcription in gencDNA generation.
(a) Representative IEJ 3/16 jgISH of nuclei isolated from the cortex of an AD mouse model (J20 transgenic, with neuron specific expression of human APP cDNA containing Swedish and Indiana mutations) versus WT littermates. (b,c) Two quantification methods depict increased IEJ presence in J20 neuronal nuclei; (b) Cumulative frequency distribution depicting the foci per nucleus and (c) average number of foci per nucleus. (d) Representative nuclei isolated from 177 and 829-day J20 cortices showed (e,f) increased foci size with age depicted as (e) cumulative distribution of foci area and the (f) average foci area. (g) Synthetic DNA targets containing the Ex 16/17 junction sequence were introduced by retroviral transduction in NIH-3T3 cells, and the target sequence (provirus) identified by Ex 16/17 jgISH. A concatamer (x2) showed increased foci size, represented as a (h) cumulative distribution and (i) average foci area. Statistical significance was calculated using non-parametric Kruskal-Wallis test (c,f) and unpaired, two-tailed Kolmogorov-Smirnov test (e,h). ****p<0.0001. n.s., not-significant. Error bars are ±SEM. Scale bars, 10μm.
GencDNA production increases with age in J20 neurons
The J20 mouse31 produces neurobehavioral and neuropathological changes with age, including the formation of Aβ plaques. The mutant APP transgenes are driven by a neuron specific platelet-derived growth factor-beta (PDGF-β) promoter to produce selective, high expression in neurons, with little or no expression within non-neuronal cells31. Importantly, the specific human APP jgISH probes do not recognize the endogenous mouse APP locus, allowing assessment of the human transgene along with APP variants, which revealed predominant signals within neuronal nuclei, contrasting with low levels in non-neuronal nuclei from the same animals as well as wildtype controls (Fig 5a–c, Extended Data Fig. 7). The enrichment of IEJ 3/16 signals in mouse J20 neurons implicate the involvement of neuron-specific RNA transcription in generating new variant sequences that in human neurons ranged from gencDNAs with intact APP 751 and 695, to the thousands of identified variant gencDNA sequences. Moreover, jgISH analyses of J20 neurons aged 177 vs. 829 days identified age-related increases in Ex 16/17 foci sizes in neurons (Fig. 5d–f. The size of foci reflects increased DNA copy number, as demonstrated by control experiments in which retroviral-mediated insertion of DNA target sequences with increasing 16/17 copies allowed semi-quantitation of jgISH foci sizes relative to target copy number (Fig. 5g–i). Since PDGF-β drives neuronal gene expression, and foci size increases in neurons during postnatal life even after cerebral cortical neurogenesis has ceased32,33, these results support neuronal gene transcription in generating gencDNAs.
DISCUSSION
Neuronal APP gene recombination was identified in the normal and SAD brain. It was characterized by the mosaic presence of thousands of distinct, genomically integrated gencDNAs that appeared as full and especially partial length APP coding sequences, containing precise exon::exon junctions, IEJs, INDELs, and SNVs. At least 8 independent lines (Extended Data) of evidence identified mosaic APP genomic recombination which included the following primary methodologies: 1) PCR and Sanger sequencing that identified 13 structural APP variants from both RNA and genomic DNA (gencDNAs), 2) high-fidelity long read SMRT sequencing that identified thousands of unique recombination species, and 3) polymerase-free visualization of IEJs and exon::exon junctions that were enriched in SAD neurons with sense-strand jgISH probes.
GencDNAs show cell-type enrichment in human brain with multiple copies occurring in individual neurons. In the J20 AD mouse model, gencDNAs increased in vivo with age, providing evidence of an active, somatic process taking place in post-mitotic neurons. APP gencDNAs bear some resemblance to, yet are fundamentally distinct from, 1) processed pseudogenes and 2) L1 repeat elements that may encode active reverse transcriptase34. Processed pseudogenes were originally defined as evolutionary, non-coding, germline remnants of transcriptionally processed RNA35. However, some may be actively transcribed, as identified in cancer cells36. L1 elements are thought to have origins in ancient retroviruses and are predominantly inactive. However, a small subset is thought to be capable of retrotransposition in mitotic tissues including neural progenitor cells of the developing brain37, although the actual rate of bona fide retrotransposition in neurons continues to be actively investigated using a variety of innovative strategies12,38,39. By comparison, neuron-enriched gencDNAs contain thousands of genomic variants, including a range of structural and SNV changes, of an important neuronal gene. Despite these differences, we note that some of the same molecular machinery, including reverse transcriptase activity, could be shared amongst processed pseudogenes, L1 elements, and APP gencDNAs, albeit accessed at different cellular and developmental stages.
APP gencDNA production via gene transcription in neurons is consistent with activity-dependent neuronal processes. Based upon the genomic presence of cDNA-like sequences, including APP 751 and 695, the identified gene recombination event likely involves spliced RNA intermediates that are then introduced into genomic DNA. Reverse transcription, previously investigated in the production of processed pseudogenes and neuronal L1 retrotransposition events, presents a unique mechanism to facilitate the generation of gencDNA species in vivo. It is notable that the high rates of SNVs, including FAD mutations, are consistent with the high error rates of HIV reverse transcriptases, which exhibit 1/100th the fidelity of replicative DNA polymerases40. Incorporation of reverse transcribed RNAs into genomic DNA likely also requires double-strand DNA breaks. In this light, the normal41–44 and AD brain45 show myriad double-stranded DNA breaks in adult neurons that might provide points of genomic integration for gencDNAs. However, other mechanisms like microhomology-mediated end joining (MMEJ), may be involved and this issue awaits further study.
An unresolved question is the involvement of APP gencDNAs in SAD. APP has a proven genetic link to DS and rare cases of FAD, and encodes Aß, whose presence in plaques is central to all forms of AD. In SAD, APP exonic CNVs were previously identified18, but in light of the current data, appear to reflect a small part of a larger universe of mosaic APP exon variation, including structural alterations and SNVs. Our proof-of-concept data demonstrated a 3–5 fold statistically significant increase in gencDNAs in all 6 SAD brains examined. Even more remarkable was the identification of 10 different somatic SNVs concentrated around the Aβ region previously identified as pathogenic in FAD, which were not seen in non-diseased controls. Other SNVs identified in our data that lie in the same region may also be pathogenic. Notably, somatic APP variants that have not yet been associated with FAD might be discovered in the future or could be pathogenic in SAD, but might produce lethal phenotypes in the germline.
The age-related increase of gencDNAs in J20 mice likely has relevance for age-related pathology observed in AD. The marked enrichment of gencDNAs in neurons compared to non-neuronal populations in both J20 mice and human brain supports a role for neuronal APP transcription in gencDNA generation. We speculate that additional gencDNA diversity, likely requiring many decades, could access the broader range of AD neuropathology that is absent from the J20 model. Furthermore, regulatory events affecting APP transcription, including transcriptional APP activation by ApoE446 - the strongest SAD risk factor gene - could have significant bearing on the generation of APP gencDNAs. The presence of varied Aß peptide forms might reflect differential enzymatic effects on some of the identified gencDNA variant translation products, and some products may conceivably be pathogenic independent of secretase processing, in view of their small size yet maintenance of Aβ sequences. These possibilities suggest that therapeutic antibodies directed against single forms of Aβ could miss disease variants and/or might engage biologically important translation products, resulting in adverse events. The array of diverse RNA variant species we observe might also have functional significance beyond translation47. The actual role of APP gencDNAs and their products in AD will require further study.
The presence of some APP gencDNAs in non-diseased neurons likely reflects normal functions mediated by APP, which covers a gamut of possibilities48, notably involvement in synaptic function where the large diversity of identified APP variants is reminiscent of the thousands of splice variants associated with a synaptic cell adhesion molecule, DSCAM49. APP gencDNAs might provide an increased repertoire of synaptic modifiers that can be genomically encoded in response to appropriate transcriptional activity. Such a mechanism might allow recording of specific RNA variants into the genome as gencDNAs, which could then allow preferential expression of specific RNA variants. Such a mechanism for APP may have pathological consequences as we suggest for AD, but more broadly, could provide neurons in the brain with a transcription-based mechanism to retain information over long periods of time. Such a process could have relevance to known neuronal functions that have already been shown to be dependent on transcriptional activity including Hebbian plasticity50, synaptic wiring49, and cognitive function51. Thus, gencDNAs and their production may represent both a “recording” as well as a “playback” mechanism for expressing a “symphony” of gencDNA variants in addition to wildtype gene forms. It would be surprising if APP was the only gene to undergo this form of recombination, which altogether might impact distinct, normal brain functions as well as contribute to neurological and psychiatric diseases.
Materials and Methods
Human brain tissue and J20 mouse
Fresh frozen human brain tissue was provided by the University of California San Diego (UCSD) Alzheimer’s Disease Research Center (ADRC), the University of California Irvine (UCI) Institute for Neurological Impairments and Disorders (MIND), and the University of Maryland (UMB) Brain and Tissue Bank (BTB). J20 transgenic mice (B6/Cg-Tg(PDGFB - APPSwInd)20Lms/2JMmjax), were purchased from The Jackson Laboratory and housed under humane conditions in animal facilities in accordance with IACUC approval and protocols at The Sanford Burnham Prebys Medical Discovery Institute.
Nuclei extraction and fluorescence-activated nuclear sorting (FANS)
Human and mouse brain nuclei isolation were performed as described previously18. For in situ hybridization analyses, isolated nuclei were fixed in 1:10 diluted buffered formalin (Fisher Healthcare) for 5 min. Fixed or unfixed nuclei were then labeled with anti-NeuN rabbit monoclonal antibody (1:800) (Millipore, Germany) and Alexa Fluor 488 donkey anti-rabbit IgG (1:500) (Life Technology, Carlsbad, CA), and counterstained with propidium iodide (50μ/ml) (Sigma, St. Louis, MO). Diploid NeuN positive and negative nuclei were gated by PI and immunofluoresence, and sorted into appropriate populations for RT-PCR or genomic DNA PCR and in situ hybridization. FANS was performed by FACS-Aria Fusion in house, or at the flow cytometry cores of TSRI and SBP with a FACS-Aria II.
RNA extraction and RT-PCR
RNA extraction from 50-nuclei populations and bulk tissues were performed using Quick-RNA MicroPrep (Zymo Research, Irvine, CA) and RNAeasy Mini kits (Qiagen, Valencia, CA), respectively, according to manufacturer’s protocol. OneStep Ahead RT-PCR (Qiagen, Valencia, CA) was used for RT-PCR with APP sense primer 5’-ATGCTGCCCGGTTTGGCA-3’ and APP anti-sense primer 5’-CTAGTTCTGCATCTGCTCAAAGAACTTG-3’. Low annealing stringency PCR was carried out with the following thermal cycling steps: 95°C 15 sec, 55°C 15 sec, and 68°C 2.5 min.
Southern Blotting
RT-PCR products were run on an agarose gel, denatured and transferred to a positively charged nylon membrane. UV crosslinked membranes were incubated with denatured and purified 32P- labelled APP cDNA probes at 42°C overnight. Blots were washed four times with increasing washing stringency. Images were developed by Typhoon (GE Healthcare Life Sciences) or Fujifilm FLA-5100 phosphorimager.
DNA extraction and Genomic DNA PCR
DNA extraction from isolated neuronal nuclei populations was performed using DNAeasy and QIAamp DNA Mini kits (Qiagen, Valencia, CA) according to manufacturer’s instruction. High annealing stringency PCR for APP was performed by FastStart PCR master (Sigma, St. Louis, MO) with 95°C 30 sec, 65°C 30 sec, and 72°C 2.5 min, and Platinum SuperFi DNA polymerase (Life Technology) with 98°C 10 sec, 65°C 10 sec, and 72°C 1.5 min. For PSEN1 PCR, the primer sequences were: sense 5’ - ATGACAGAGTTACCTGCACC-3’ and anti-sense 5’-CT AGAT AT AAAAT T GAT GGAA −3’. Thermal cycling steps were 95°C 30 sec, 52°C 30 sec, 72°C 2 min, and 98°C 10 sec, 52°C 10 sec, 72°C 1 min for FastStart PCR master and Platinum SuperFi DNA polymerase, respectively.
Junction-specific genomic in situ hybridization (jglSH) and BaseScope RNA-ISH
For jgISH pretreatment, sorted nuclei were dried on Plus Gold slides (Fisher Scientific, Pittsburgh, PA). Nuclei were then treated with RNase cocktail enzyme mix (1:50) (Thermo Fisher) at 40°C for 60 minutes, followed by 1:10 dilution buffered formalin fixation at room temperature for 5 min. After washing by distilled water twice, slides were treated with hydrogen peroxide at room temperature for 10 min, target retrieval reagent at 95°C for 15 min, followed by protease treatment at 40°C for 10 min. Restriction enzyme was applied after protease treatment for 2 hr if needed. DNA was denatured (2XSSC, 70% formamide and 0.1% sodium dodecyl sulfate) at 80°C for 20 min. After cooling down the slides to room temperature, BaseScope probes were applied and incubated with nuclei at 40°C overnight. Samples were then ready for signal developing. For BaseScope RNA-ISH pretreatment,10 μη fresh frozen human tissue sections were fixed by 1:10 dilution buffered formalin on ice for 10 min. After washing by PBS twice, tissue sections were soaked in serial diluted ethanol 50%, 70% and 100% 5 min for each step. Slides were then treated with hydrogen peroxide at room temperature for 10 min, followed by protease at room temperature for 20 min. BaseScope probes were incubated with tissue sections at 40°C for 2 hr. Hydrogen peroxide,10X target retrieval buffer, proteases, custom BaseScope probes (Ex16/17 targeting ACATGACTCAGGATATGAAGTTCATCATCAAAAATTGGTGT TCTTTGCA; IEJ 3/16 targeting TGCCAAGAAGTCTACCCTGAACTGCAGATCACCAAGA TGGATGC, including sense and anti-sense probes) and BaseScope Reagent Kit-RED using for signal developing were all purchased from Advanced Cell Diagnosis (ACD, Newark, CA). Nuclei or tissue sections were counterstained with hematoxylin. Zeiss AX10 Imager.M2 microscope and ZEN2 software were used for image acquisition. Images were thresholded, and foci number/size were quantified using ImageJ for statistical analysis.
SMRT sequencing
Neuronal DNA were used as template for APP PCR by Platinum SuperFi DNA polymerase with high annealing stringency (98°C 10 sec, 65°C 10 sec, and 72°C 1.5 min). Multiple PCR reactions were pooled and purified by DNA Clean and Concentrator-5 (Zymo Research, Irvine, CA) for SMRT sequencing library preparation. PCR products were repaired using SMRTbell template prep kit version 2.0 (PacBio) and purified using AMPure PB beads (PacBio). Adapters were ligated to DNA to create SMRTbell libraries. Sequencing polymerase was annealed and the SMRTbell library was loaded using Magbead binding. Raw bam sequencing files were converted to fastq format using the ccs2 algorithm in SMRTLink Version 4.0. Reads were only included in the analyzed fastq file if 1) there were more than 20 passes of the sequencing polymerase over the DNA molecule in the zero mode waveguide well and 2) the read was calculated to possess a >0.9999 predicted accuracy.
Genomic data analyses with customized bioinformatic algorithms
Novel algorithms were developed to detect and analyze exon rearrangement in genes of interest. The algorithms are specifically designed to analyze long-read sequences generated by Pacific Biosciences Sequel platform. A series of quality control (QC) procedures were performed prior to sequence processing to ensure high quality of reads being analyzed.
Quality control: Consensus sequence and read quality.
PacBio circular consensus sequences (CCS) reads with less than 20 passes were filtered out to ensure overall sequence quality. Quality score and read length distributions are examined: for APP gene PCR enriched sequences, average median read-wide Phred score is 93 and read length ranged from 64 to 2470 nucleotides. For our analysis, we only analyzed reads for which the median Phred score was >85.
Quality control: Sequencing artifacts.
Due to the intrinsic limit of PacBio SMRT (Single Molecule Real-Time) sequencing technology, errors in homopolymers (i.e. sequence ATTTG could be read as ATTTTG or ATTG in addition to ATTTG) are specially handled with a method combining quality score information and reference sequence at the beginning of a homopolymer. The CCS FASTQ files encoded uncertainty in the homopolymer run length in the first Phred score of each run. If this Phred score is lower than our threshold of 30, then this position was marked as a likely sequencing artifact and not a real variant.
PGR primer filter.
The reads were checked to ensure the correct start and end sites with forward and reverse PCR primer sequences. BLAST (command line tool “blastn” 2.6.0+) is used to align primer sequences in either orientation to each read with word size 13, gap open penalty 0 and gap extension penalty 2. Any read where both primers are not detected was filtered out. Furthermore, reads on the negative strand are reverse complemented in this step. BLAST seed length was optimized to avoid ambiguity and ensure sensitivity.
Alignment to APP reference sequences.
Ensembl reference sequence for APP protein was downloaded from the GRCh38 reference human genome assembly using the UCSC Genome Browser (http://genome.ucsc.edu/cgi-bin/hgGateway) with RefSeq accession number NM 000484.3. Since the PCR primers start at the start codon and end with the stop codon, sequences of exons 1 and 18 were trimmed to these positions so only the coding sequence of each of the 18 exons was kept and stored as a FASTA file. Then, we used BLAST to look for local alignment between 18 exons and each quality-filtered CCS read; blastn parameters used: -outfmt 6, -wordsize 25, -gapopen 0, -gapextend 2. We used these resulting alignment coordinates to mark regions of each read covered by exons. This allowed us to analyze exon arrangements, lengths and patterns of exon-exon joins.
Single nuckotide variant and INDEL analysis.
First, we used reference sequences of APP exons to replace low quality homopolymer runs within each read with their reference APP exon counterpart. Then, we analyzed BLAST local alignments between each exon (or part of an exon) and the read sequence, nucleotide by nucleotide position, to look for alignment mismatches. If the mismatch position is a different nucleotide, we assigned it as a single nucleotide variant (SNV), if the mismatch position was a hyphen “-” in the exon sequence, we assigned it as an insertion and if the mismatch position was a hyphen “-” in the read sequence we assigned it as a deletion.
Construction and retroviral transduction of human APP exon 16/exon 17 concatamers:
Phosphorylated oligonucleotides (Integrated DNA Technologies) composed of human APP exon 16 and exon 17 sequences with BamHI and BglII restriction sites on the 5’ ends, were annealed, and ligated into the BamHI site of the retroviral expression vector S-003-AB LZRSpBMN-linker-IRES-EGFP. Single and concatamerized oligonucleotide inserts were identified by PCR using primers flanking the BamHI insertion site, and identified clones were sequenced to confirm insert copy number (GENEWIZ). Helper-free ecotropic virus was produced by transfecting DNA constructs (Lipofecatime 2000, Thermo Fisher Scientific) with single or multiple copies of the oligonucleotide inserts into the retrovirus packaging line Phoenix-ECO. 48 hours post-transfection, retroviral supernatants were harvested and 2 ml of selected virus was used for transduction of NIH-3T3 cells in 6 well plates. Retroviral transduction was carried out by removing the cell growth medium, replacing it with 2 ml of retroviral supernatant containing 4 μg/ml polybrene, and spinning at 25°C for 1 hour at 2800 r.p.m. 48 hours post-transduction, the percentage of GFP+ cells, as identified by flow cytometry, was used to evaluate the transduction efficiency. The following primers were used to produce the retroviral constructs: 16/17 Bam: 5’- GATCCACATGACTCAGGATATGAAGTTCATCATCAAAAATTGGTGTTCTTTGCAA-3’, and 16/17 BglII Rev: 5’- GATCTTGCAAAGAACACCAATTTTTGATGATGAACTTCATATCCTGAGTCATGTG-3’.
Cell culture
NIH-3T3 were purchased from ATCC. Cells were maintained in Dulbecco’s modified Eagle’s medium (Invitrogen) containing 5% fetal bovine serum (Invitrogen)at 37°C under 5% CO2.
Extended Data
Extended Data Figure 1. RT-PCR for bulk RNA detects canonical APP splice variants as major products.
Bulk RNA from 3 non-diseased and 3 sporadic Alzheimer’s disease prefrontal cortices was used for APP RT-PCR. The major products detected were canonical APP splice variants.
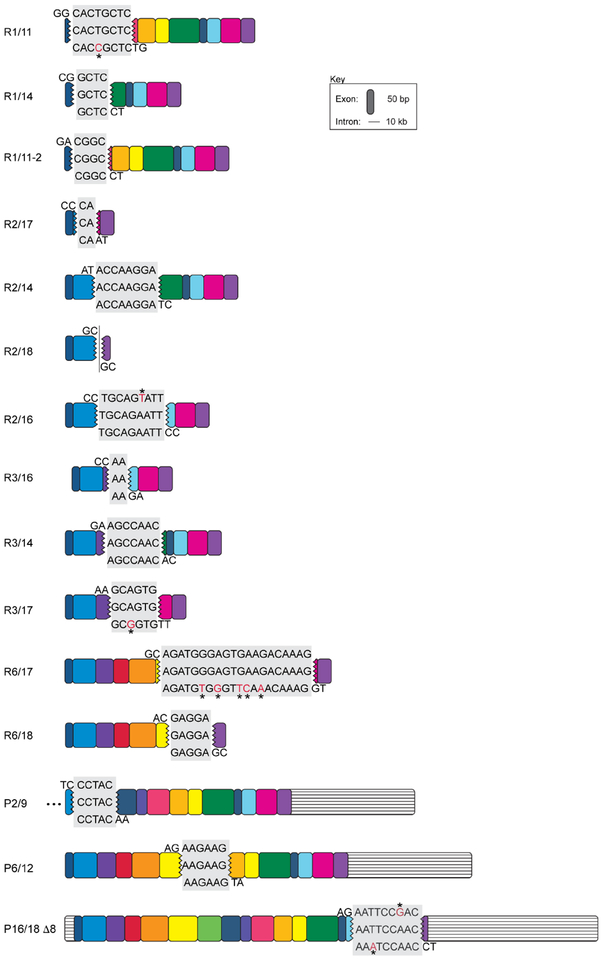
Extended Data Figure 2. Sequence homology of novel APP RNA variants at intra-exonic junctions.
All novel APP RNA variants with sequence homology at intra-exonic junctions are shown. The homology sequences of proximal and distal exons are shaded in gray. The middle sequence is the identified variant, top and bottom sequences are publically available coding sequences from NM一000484.3 from the respective exons. Nucleotide variations are indicated in red with an asterisk. RNA variants identified by Sanger sequencing and PacBio data sets were shown with R and P, respectively.
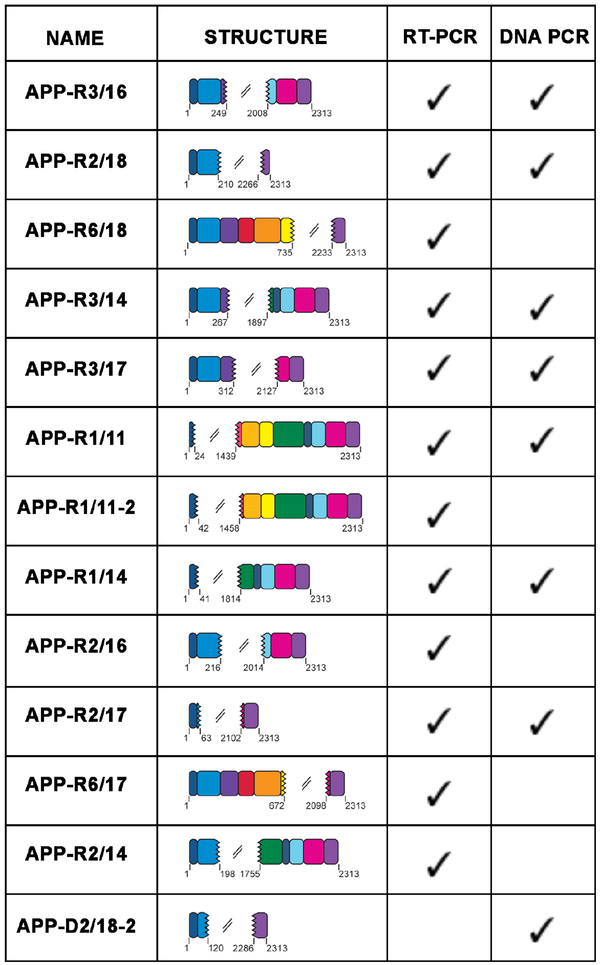
Extended Data Figure 3. Identical APP gencDNAs were identified in both RT-PCR and DNA PCR.
The 13 variants identified first by RT-PCR (APP-R) and DNA PCR (APP-D) are represented. Seven were identified in both methods, five by RT-PCR only, and one by DNA PCR only.
Extended Data Figure 4. RNA-in situ hybridization with sense and antisense jgISH probes on human tissue sections.
(a) Ex 16/17 and (b) lEJ 3/16 sense RNA-in situ hybridization on human prefrontal cortex tissue and anti-sense probes were used for sections. Scale bars:10 μm
Extended Data Figure 5. Unique gencDNAs identified in non-diseased brain.
(a) Total number and proportion of unique reads from each identified IEJ form. (b) Number of unique IEJs forms. (c) A concentric circle plot of the APP locus (exon numbers along perimeter) depicting IEJs (connecting lines inside the circles), deletions (DEL) (first inner circle), insertions (INS) (second inner circle), and single nucleotide variations (SNVs) (third inner circle). Black dots indicate the abundance of DELs, INSs, and SNVs on a log(10) scale at the specified exon location. The outermost circle depicts the sum count (key) of unique changes. The Aβ region is highlighted in red.
Extended Data Figure 6. Data from individual brains represented as an average in Figure 4.
(a,b) Nuclei sorted from 6 ND and 6 SAD cortices were analyzed by (a) Ex 16/17 and (b) IEJ 3/16 jgISH. Cumulative frequency distribution plots of the number of foci per nucleus showed statistical significance (nonparametric Kruskal-Wallis test with Dunn’s multiple corrections). * p<0.05, **p<0.01, *** p<0.001, **** p<0.0001. n.s., not-significant. Error bars are ±SEM.
Extended Data Figure 7. Data from individual mouse cortices represented as an average in Figure 5.
(a,b) J20–1, WT-1 (c,d) J20–2, WT-2. Two quantification methods depict increased IEJ presence in J20 neuronal nuclei; (a,c) Cumulative frequency distribution depicting the foci per nucleus and (b,d) average number of foci per nucleus.
Extended Data Table 1. Brain Information.
All brains were from the pre-frontal cortex and obtained from the UCSD ADRC, Tissue Bank for Developmental Disorders at University of Maryland, and UC Irvine. F=Female, M=Male, U=Unknown.
| Brain Name | Braak | Sex | PMI (Hours) | Age (years) |
|---|---|---|---|---|
| SAD-1 | 6 | F | 6 | 88 |
| SAD-2 | 6 | F | 12 | 88 |
| SAD-3 | 6 | F | 6 | 84 |
| SAD-4 | 6 | F | 4 | 86 |
| SAD-5 | 6 | M | 5 | 83 |
| SAD-6 | 6 | F | 10 | 72 |
| ND-1 | 1 | M | U | 87 |
| ND-2 | 1 | F | 72 | 83 |
| ND-3 | U | M | U | 83 |
| ND-4 | 1 | F | 12 | 80 |
| ND-3 | 1 | F | 18 | 93 |
| ND-6 | 2 | M | 12 | 94 |
| ND-7 | U | M | 12 | 69 |
| SAD-7 | 5 | F | 3.7 | 77 |
Extended Data Table 2. BaseScope 1 probe controls in this study.
jglSH positive and negative control and experiments list. Exp=Experimental, Neg=negative control, Pos=positive control.
| Junction | Target | Sample | Type | Probes | Figure Panel |
|---|---|---|---|---|---|
| Ex 16/17 | DNA | Human nuclei +RNase | Exp | Sense | 2c, 4b |
| Exp | Anti-sense | 2c | |||
| Human nuclei +RNase +/− restriction enzyme (MluCI) | Neg | Sense | 2e | ||
| Sense | 2e | ||||
| WT mouse nuclei +RNase | Neg | Sense | 5g, d | ||
| Mouse nuclei +RNase + Ex 16/17 DNA concatamer | Pos | Sense | 5g | ||
| RNA | Human tissue | Neg | Sense | EDT 4a | |
| Pos | Anti-sense | EDT 4a | |||
| IEJ 3/16 | DNA | Human nuclei +RNase | Exp | Sense | 2d, 4c |
| Exp | Anti-sense | 2d | |||
| Human nuclei +RNase +/− restriction enzyme (PSTI & MslI) | Neg | Sense | 2f | ||
| Sense | 2f | ||||
| WT Mouse nuclei +RNase | Neg | Sense | EDT 4b | ||
| RNA | Human tissue | Neg | Sense | EDT 4b | |
| Pos | Anti-sense | 5a |
Acknowledgments
We thank Dr. Cornelis Murre for discussions. We thank the University of California San Diego (UCSD) Alzheimer’s Disease Research Center (ADRC), the University of California Irvine (UCI) Institute for Neurological Impairments and Disorders (MIND), and the University of Maryland (UMB) Brain and Tissue Bank (BTB) for providing human brain specimens. We thank Brian Seegers from the Scripps Research Institute flow cytometry core and Yoav Altman from the Sanform Burnham Prebys Medical Discovery Institute (SBP) flow cytometry core for their assistance. We thank Harold Lee from Pacbio for his assistance in implementing SMRT methodologies. Essential resources for this work were generously provided through the Shaffer Family Foundation, Bruce Ford & Anne Smith Bundy Foundation, and SBP institutional funds. M.H.L is funded by the PRAP fellowship from the Ministry of Science and Technology, Taiwan (105-2917-1-564-085) and G.E.K was funded by the NIH training grant 5T32AG000216–24.
References
- 1.Dreyer WJ, Gray WR & Hood L The genetic, molecular and cellular basis of antibody formation: some facts and a unifying hypothesis. Cold Spring Harbor Symp. Quant. Biol 32, 353–367 (1967). [Google Scholar]
- 2.Hozumi N & Tonegawa S Evidence for somatic rearrangement of immunoglobulin genes coding for variable and constant regions. Proc Natl Acad Sci U S A 73, 3628–3632 (1976). [DOI] [PMC free article] [PubMed] [Google Scholar]
- 3.Chun JJ, Schatz DG, Oettinger MA, Jaenisch R & Baltimore D The recombination activating gene-1 (RAG-1) transcript is present in the murine central nervous system. Cell 64,189–200 (1991). [DOI] [PubMed] [Google Scholar]
- 4.Buck L & Axel R A novel multigene family may encode odorant receptors: a molecular basis for odor recognition. Cell 65,175–187 (1991). [DOI] [PubMed] [Google Scholar]
- 5.Wu Q & Maniatis T A striking organization of a large family of human neural caderhin-like cell adhesion genes. Cell 97, 779–790 (1999). [DOI] [PubMed] [Google Scholar]
- 6.Hattori D, Millard SS, Wojtowicz WM & Zipursky SL Dscam-mediated cell recognition regulates neural circuit formation. Annu Rev Cell Dev Biol 24, 597–620, doi: 10.1146/annurev.cellbio.24.110707.175250 (2008). [DOI] [PMC free article] [PubMed] [Google Scholar]
- 7.Rehen SK et al. Chromosomal variation in neurons of the developing and adult mammalian nervous system. Proc Natl Acad Sci US A 98,13361–13366 (2001). [DOI] [PMC free article] [PubMed] [Google Scholar]
- 8.Westra JW et al. Neuronal DNA content variation (DCV) with regional and individual differences in the human brain. J Comp Neurol 518, 3981–4000, doi: 10.1002/cne.22436 (2010). [DOI] [PMC free article] [PubMed] [Google Scholar]
- 9.Rehen SK et al. Constitutional aneuploidy in the normal human brain. J Neurosci 25, 2176–2180 (2005). [DOI] [PMC free article] [PubMed] [Google Scholar]
- 10.McConnell MJ et al. Mosaic copy number variation in human neurons. Science 342, 632–637, doi: 10.1126/science.1243472 (2013). [DOI] [PMC free article] [PubMed] [Google Scholar]
- 11.Gole J et al. Massively parallel polymerase cloning and genome sequencing of single cells using nanoliter microwells. Nature biotechnology 31,1126–1132, doi: 10.1038/nbt.2720 (2013). [DOI] [PMC free article] [PubMed] [Google Scholar]
- 12.Erwin JA et al. Ll-associated genomic regions are deleted in somatic cells of the healthy human brain. Nat Neurosci 19,1583–1591, doi: 10.1038/nn.4388 (2016). [DOI] [PMC free article] [PubMed] [Google Scholar]
- 13.Hazen JL et al. The Complete Genome Sequences, Unique Mutational Spectra, and Developmental Potency of Adult Neurons Revealed by Cloning. Neuron 89,1223–1236, doi: 10.1016/j.neuron.2016.02.004 (2016). [DOI] [PMC free article] [PubMed] [Google Scholar]
- 14.Lodato MA et al. Somatic mutation in single human neurons tracks developmental and transcriptional history. Science 350, 94–98, doi: 10.1126/science.aab1785 (2015). [DOI] [PMC free article] [PubMed] [Google Scholar]
- 15.Peterson SE et al. Aneuploid cells are differentially susceptible to caspase-mediated death during embryonic cerebral cortical development. J Neurosci 32,16213–16222, doi: 10.1523/JNEUR0SCI.3706-12.2012 (2012). [DOI] [PMC free article] [PubMed] [Google Scholar]
- 16.Kaushal D et al. Alteration of gene expression by chromosome loss in the postnatal mouse brain. J Neurosci 23, 5599–5606 (2003). [DOI] [PMC free article] [PubMed] [Google Scholar]
- 17.Evrony GD et al. Cell lineage analysis in human brain using endogenous retroelements. Neuron 85, 49–59, doi: 10.1016/j.neuron.2014.12.028 (2015). [DOI] [PMC free article] [PubMed] [Google Scholar]
- 18.Bushman DM et al. Genomic mosaicism with increased amyloid precursor protein (APP) gene copy number in single neurons from sporadic Alzheimer’s disease brains. Elife 4, doi: 10.7554/eLife.05116 (2015). [DOI] [PMC free article] [PubMed] [Google Scholar]
- 19.Murrell J, Farlow M, Ghetti B & Benson MD A mutation in the amyloid precursor protein associated with hereditary Alzheimer’s disease. Science 254, 97–99 (1991). [DOI] [PubMed] [Google Scholar]
- 20.Mullan M et al. A pathogenic mutation for probable Alzheimer’s disease in the APP gene at the N-terminus of beta-amyloid. Nat Genet 1,345–347, doi: 10.1038/ng0892-345 (1992). [DOI] [PubMed] [Google Scholar]
- 21.Hooli BV et al. Rare autosomal copy number variations in early-onset familial Alzheimer’s disease. Mol Psychiatry 19, 676–681, doi: 10.1038/mp.2013.77 (2014). [DOI] [PubMed] [Google Scholar]
- 22.Wiseman FK et al. A genetic cause of Alzheimer disease: mechanistic insights from Down syndrome. Nat Rev Neurosci 16, 564–574, doi: 10.1038/nrn3983 (2015). [DOI] [PMC free article] [PubMed] [Google Scholar]
- 23.Selkoe DJ & Hardy J The amyloid hypothesis of Alzheimer’s disease at 25 years. EMBO Mol Med 8, 595–608, doi: 10.15252/emmm.201606210 (2016). [DOI] [PMC free article] [PubMed] [Google Scholar]
- 24.Cai X et al. Single-cell, genome-wide sequencing identifies clonal somatic copy-number variation in the human brain. Cell Rep 10, 645, doi: 10.1016/j.celrep.2015.01.028 (2015). [DOI] [PubMed] [Google Scholar]
- 25.Lake BB et al. Neuronal subtypes and diversity revealed by single-nucleus RNA sequencing of the human brain. Science 352, 1586–1590, doi: 10.1126/science.aaf1204 (2016). [DOI] [PMC free article] [PubMed] [Google Scholar]
- 26.Dawkins E & Small DH Insights into the physiological function of the beta-amyloid precursor protein: beyond Alzheimer’s disease. J Neurochem 129, 756–769, doi: 10.1111/jnc.12675 (2014). [DOI] [PMC free article] [PubMed] [Google Scholar]
- 27.Kujawa Steve, E. J, Eng Kevin, Hon Ting, Tseng Elizabeth, Wenger Aaron, Giorda Kristina, Wang Jiashi, & Jarosz Mirna. A Method for the Identification of Variants in Alzheimer’s Disease Candidate Genes and Transcripts Using Hybridization Capture Combined with Long-Read Sequencing. (2017). [Google Scholar]
- 28.The Alzheimer brain Iso-Seq dataset was generated by Pacific Biosciences, Menlo Park, California, and additional information about the sequencing and analysis is provided at https://downloads.pacbcloud.com/public/dataset/Alzheimer_IsoSeq_2016/. The data used in the present study was retrieved from PacBio’s online database at https://downloads.pacbcloud.com/public/dataset/Alzheimer_IsoSeq_2016/. (2016). [Google Scholar]
- 29.Roberts RJ, Carneiro MO & Schatz MC The advantages of SMRT sequencing. Genome biology 14, 405, doi: 10.1186/gb-2013-14-6-405 (2013). [DOI] [PMC free article] [PubMed] [Google Scholar]
- 30.Eid J et al. Real-time DNA sequencing from single polymerase molecules. Science 323, 133–138, doi: 10.1126/science.1162986 (2009). [DOI] [PubMed] [Google Scholar]
- 31.Mucke L et al. High-level neuronal expression of abeta 1–42 in wild-type human amyloid protein precursor transgenic mice: synaptotoxicity without plaque formation. J Neurosci 20, 4050–4058 (2000). [DOI] [PMC free article] [PubMed] [Google Scholar]
- 32.Ming GL & Song H Adult neurogenesis in the mammalian brain: significant answers and significant questions. Neuron 70, 687–702, doi: 10.1016/j.neuron.2011.05.001 (2011). [DOI] [PMC free article] [PubMed] [Google Scholar]
- 33.Bhardwaj RD et al. Neocortical neurogenesis in humans is restricted to development. Proc Natl Acad Sci U S A 103, 12564–12568, doi: 10.1073/pnas.0605177103 (2006). [DOI] [PMC free article] [PubMed] [Google Scholar]
- 34.Esnault C, Maestre J & Heidmann T Human LINE retrotransposons generate processed pseudogenes. Nat Genet 24, 363–367, doi: 10.1038/74184 (2000). [DOI] [PubMed] [Google Scholar]
- 35.Harrison PM, Zheng D, Zhang Z, Carriero N & Gerstein M Transcribed processed pseudogenes in the human genome: an intermediate form of expressed retrosequence lacking protein-coding ability. Nucleic acids research 33, 2374–2383, doi: 10.1093/nar/gki531 (2005). [DOI] [PMC free article] [PubMed] [Google Scholar]
- 36.Kalyana-Sundaram S et al. Expressed pseudogenes in the transcriptional landscape of human cancers. Cell 149, 1622–1634, doi: 10.1016/j.cell.2012.04.041 (2012). [DOI] [PMC free article] [PubMed] [Google Scholar]
- 37.Muotri AR et al. Somatic mosaicism in neuronal precursor cells mediated by L1 retrotransposition. Nature 435, 903–910, doi: 10.1038/nature03663 (2005). [DOI] [PubMed] [Google Scholar]
- 38.Upton KR et al. Ubiquitous L1 mosaicism in hippocampal neurons. Cell 161, 228–239, doi: 10.1016/j.cell.2015.03.026 (2015). [DOI] [PMC free article] [PubMed] [Google Scholar]
- 39.Evrony GD, Lee E, Park PJ & Walsh CA Resolving rates of mutation in the brain using single-neuron genomics. Elife 5, doi: 10.7554/eLife.12966 (2016). [DOI] [PMC free article] [PubMed] [Google Scholar]
- 40.Preston BD, Poiesz BJ & Loeb LA Fidelity of HIV-1 reverse transcriptase. Science 242, 1168–1171 (1988). [DOI] [PubMed] [Google Scholar]
- 41.Madabhushi R et al. Activity-Induced DNA Breaks Govern the Expression of Neuronal Early-Response Genes. Cell 161, 1592–1605, doi: 10.1016/j.cell.2015.05.032 (2015). [DOI] [PMC free article] [PubMed] [Google Scholar]
- 42.Wei PC et al. Long Neural Genes Harbor Recurrent DNA Break Clusters in Neural Stem/Progenitor Cells. Cell 164, 644–655, doi: 10.1016/j.cell.2015.12.039 (2016). [DOI] [PMC free article] [PubMed] [Google Scholar]
- 43.Blaschke AJ, Weiner JA & Chun J Programmed cell death is a universal feature of embryonic and postnatal neuroproliferative regions throughout the central nervous system. J Comp Neurol 396, 39–50 (1998). [DOI] [PubMed] [Google Scholar]
- 44.Blaschke AJ, Staley K & Chun J Widespread programmed cell death in proliferative and postmitotic regions of the fetal cerebral cortex. Devehpm 122, 1165–1174 (1996). [DOI] [PubMed] [Google Scholar]
- 45.Suberbielle E et al. Physiologic brain activity causes DNA double-strand breaks in neurons, with exacerbation by amyloid-beta. Nat Neurosci 16, 613–621, doi: 10.1038/nn.3356 (2013). [DOI] [PMC free article] [PubMed] [Google Scholar]
- 46.Huang YA, Zhou B, Wernig M & Sudhof TC ApoE2, ApoE3, and ApoE4 Differentially Stimulate APP Transcription and Abeta Secretion. Cell 168, 427–441 e421, doi: 10.1016/j.cell.2016.12.044 (2017). [DOI] [PMC free article] [PubMed] [Google Scholar]
- 47.Jain A & Vale RD RNA phase transitions in repeat expansion disorders. Nature 546, 243–247, doi: 10.1038/nature22386 (2017). [DOI] [PMC free article] [PubMed] [Google Scholar]
- 48.Zheng H & Koo EH The amyloid precursor protein: beyond amyloid. Molecular murodegemration 1,5, doi: 10.1186/1750-1326-1-5 (2006). [DOI] [PMC free article] [PubMed] [Google Scholar]
- 49.Hattori D et al. Robust discrimination between self and non-self neurites requires thousands of Dscaml isoforms. Nature 461, 644–648, doi: 10.1038/nature08431 (2009). [DOI] [PMC free article] [PubMed] [Google Scholar]
- 50.Guzman-Karlsson MC, Meadows JP, Gavin CF, Hablitz JJ & Sweatt JD Transcriptional and epigenetic regulation of Hebbian and non-Hebbian plasticity. Neurophamacology 80, 3–17, doi: 10.1016/j.neuropharm.2014.01.001 (2014). [DOI] [PMC free article] [PubMed] [Google Scholar]
- 51.West AE & Greenberg ME Neuronal activity-regulated gene transcription in synapse development and cognitive function. Cold Spring Harbor perspectives in biohgy 3, doi: 10.1101/cshperspect.a005744 (2011). [DOI] [PMC free article] [PubMed] [Google Scholar]


