

Abstract
Magnetic nanoparticles (MNPs) have been extensively explored as magnetic resonance imaging (MRI) contrast agents. With the increasing complexity in the structure of modern MNPs, the classical Solomon-Bloembergen-Morgan and the outer-sphere quantum mechanical theories established on simplistic models have encountered limitations for defining the emergent phenomena of relaxation enhancement in MRI. We reviewed recent progress in probing MRI relaxivity of MNPs based on structural features at the molecular and atomic scales, namely the structure-relaxivity relationships, including size, shape, crystal structure, surface modification, and assembled structure. We placed a special emphasis on bridging the gaps between classical simplistic models and modern MNPs with elegant structural complexity. In the pursuit of novel MRI contrast agents, we hope this review will spur the critical thinking for design and engineering of novel MNPs for MRI applications across a broad spectrum of research fields.
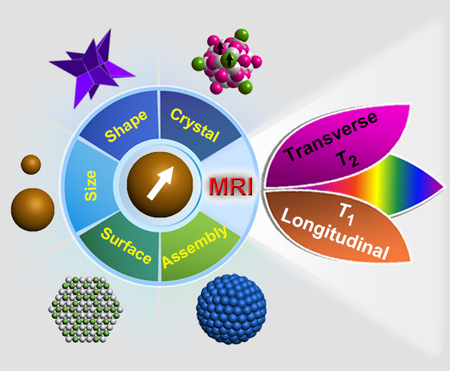
Graphical Abstract
1. Introduction
The broad interest in manipulating structural characteristics of nanomaterials to practice novel functionality remains a central theme in nanoscience.[1] A major focus has been focused on inorganic nanoparticles including inorganic/organic hybrid nanostructures owing to their variable structural features and diversified functions.[2] The family of magnetic nanoparticles (MNPs) is among the most widely explored nanomaterials due to their potential applications in a variety of research fields.[3] The unique physiochemical and magnetic properties of MNPs have spurred great research interest in developing MNPs with controllable size, shape, composition, crystal structure, surface modification, and architecturally assembled structure.[4] Moreover, advances in materials science and nanotechnology have propagated the evolution of MNPs from simple substances to metal oxides and alloys, which have endowed these MNPs with distinct magnetic properties.[5] More importantly, it has been shown that the magnetic moment per atom and the magnetic anisotropy of MNPs can be different from those in bulk species.[6] Therefore, investigations into the structural characteristics of MNPs are highly desirable, particularly for magnetism mediated applications including data storage and biomedicine.[7]
Magnetic resonance imaging (MRI) is a noninvasive, non-ionizing, and radiation-free tool widely used in clinical diagnosis.[8] Under an external magnetic field in MRI equipment, magnetic nuclei become aligned to allow resonance through a radiofrequency pulse. 1H has the highest gyromagnetic ratio in nature and is the most abundant magnetic nucleus in the human body, which is therefore the most commonly studied subject in MRI. MRI outputs the computation results of nuclear relaxation of different chemical and physical environments, which can be correlated to pathological differences in biological samples. Although it is possible to achieve good-contrast images of tissues for diagnosis by manipulating pulse sequences alone, MRI is best utilized in concert with contrast agents which are able to highlight the anatomic and pathologic features of regions-of-interest.[9] MNPs are introduced to generate a local magnetic field, which in turn disturbs the nuclear relaxation of magnetic nuclei in the surroundings.[10] MNPs can accelerate the relaxation process and shorten the relaxation time of protons nearby, enhancing the signal contrast between the surroundings and distal background in MR images. Distinct from other imaging media (e.g., optical probes, radiotracers) which are the direct sources of imaging signal, MRI contrast agents are applied to affect the signal output of magnetic nuclei nearby.
The mechanism of relaxation enhancement by MNPs is related to the dynamic interactions of water molecules with the magnetic centers, in which the magnetic properties of MNPs play a predominant role.[11] The MRI contrast enhancement effect of MNPs is attributed in large part to their structural features.[12] The increased structural complexity requires more meticulous control over the fabrication process, and accordingly, furnishes more dedicated functional capacities. Compared to early strategies of making nanomaterials,[13] modern synthetic approaches enable us to achieve the synthesis of various nanoparticles with controllable structural features. Indeed, the need for uniformity and unique structures of nanomaterials lies beyond the aesthetic demand.[14] For example, size can influence the magnetization of MNPs due to the modification of exchange interactions through surface effects, which in turn governs the magnetic moment of MNPs.[15] On the other hand, the magnetic switching property of MNPs is strongly associated with their shape due to the presence of shape anisotropy.[16] Taken together, advances in nanoscience and nanotechnology have improved our understanding of the relationship between the increasingly complex structural features of MNPs and their MRI performance.[17]
A plethora of review articles have been published on a general interest of summarizing different types of MNPs as MRI contrast agents.[7b, 18] Unfortunately, there is a lack of a comprehensive review article elaborating on the structure-relaxivity relationships of MNPs for MRI.[19] The Solomon-Bloembergen-Morgan (SBM) theory and the outer-sphere quantum mechanical theory have been the guiding principles for the design of MRI contrast agents over the past decades.[20] However, the classical theories were established on simplistic models, which lag behind the increasing complexity of MRI relaxation enhancement effect by MNPs with elegant structural complexity.[10, 21] Therefore, we attempted to summarize the latest achievements and propose future challenges for exploring structural features of MNPs for MRI applications, with a focus on size, shape, crystal structure, surface modification, and assembled structure. Specifically, the correlation between the T1 and T2 relaxivities as well as the gap between classical models and current structures will be discussed. We hope this topic will stimulate interest in the rational design of MNPs for sophisticated MRI applications, which is significance in the interdisciplinary fields of chemistry, physics, materials science, biomedical engineering, and nanomedicine.
2. Classical theories
The classical theories describing nuclear relaxation and the derived relaxation models were developed around a half century ago.[22] Later on, the SBM and the outer-sphere diffusion theories were developed to interpret the interactions between magnetic nuclei and electronic spins, which have been the guiding principles for the design of many MRI contrast agents.[10, 21] These theories involving complex mathematical equations can be found in other reviews.[23] Here, we will briefly describe the two theories from the vantage points of physical facts to help readers understand the origin of theories in classical models.
2.1. Solomon-Bloembergen-Morgan theory
The SBM theory regarding dipole-dipole interactions was originally developed by Bloembergen, Purcell, and Pound in 1948,[24] which is arguably the most important mechanism responsible for the T1 and T2 relaxations of water protons in nature. However, the dipolar interaction in its original definition was limited to proton-proton interactions until Solomon, Bloembergen, and Morgan extended the theory to include proton-electron interactions in 1961.[21a, 21b] Due to the smaller mass and much larger dipole magnetic moment of electron spin over proton spin, proton-electron interaction is significantly stronger than proton-proton interaction. This is evident from the fact that proton-electron interaction occurring between water protons and paramagnetic ions shows greater impact on the relaxation of protons.
The dipolar interaction is governed by four key factors including the type of spins, the distance between spins, the angle between spins, and the relative motion of spins.[25] The classical models employed two hydrogen protons to engage a dipole-dipole interaction. The mathematical equations can be found in a good number of classical papers and follow-up publications.[21c, 21d] To simplify, the dipole interaction is directly dependent on the gyromagnetic ratio (γ) of protons to the fourth power (γ2 × γ2), and is inversely dependent on the distance (d) between protons to the sixth power (d6) and the spectral density, which is related to the relationship between the correlation time (τc) and the Larmor frequency. Molecules may undergo three kinds of motion: vibration, translation, and rotation. Vibrational motion is too fast to influence relaxation and translational motion is averaged out in a homogenous field, only rotational motion is considered in nuclear magnetic relaxation because it occurs in a range of frequencies that cover the Larmor frequency of protons. This situation is applicable in many biological systems. For example, water molecules that are bound to proteins or macromolecules may have shorter T1 relaxation time than that of free water molecules.[26] The restricted motion of water molecules also diminishes the averaging effect, reducing their T2 relaxation time.[27] In a typical MRI, the signals from bounded water with short relaxation time are primarily responsible for the enhanced imaging contrast observed for solid organs like the brain and liver. Notably, electron spins have γ over 600 times larger than proton spins, which yields an over 360,000 fold difference between electro-proton and proton-proton interactions.[28] This fundamental property explains why paramagnetic materials are so effective in enhancing proton relaxations.
In contrast to proton-proton interactions, proton-electron interactions between water protons and paramagnetic ions/molecules are the central mechanism behind paramagnetic materials as T1 contrast agents. In a classical model, water protons interacting with paramagnetic centers are classified into inner-sphere, second-sphere, and outer-sphere mechanisms (Fig. 1).[29] The inner-sphere mechanism involves the direct coordination of water protons with paramagnetic ions and after dissociation, the interaction with bulk water protons, denoted as chemical exchange.[29] The definition of chemical exchange describes the transfer of a nucleus from one part of a molecule to another, which can occur both intra-molecularly or inter-molecularly. This effect influences the spectral line widths and is observable in NMR. As such, the chemical exchange causes field-dependent shortening of both T1 and T2 relaxation times. The inner-sphere mechanism dominates the T1 relaxation enhancement in paramagnetic contrast agents which is modeled as followings:
| (eq. 1) |
| (eq. 2) |
| (eq. 3) |
| (eq. 4) |
| (eq. 5) |
where c is the concentration of metal ions (in mM); PM is the mole fraction of the metal ions, which equal to 1.8 × 10⁻⁵ when c is expressed in mM; q is the number of coordinating water molecules in the first coordination sphere; T1m is the longitudinal relaxation time of the inner-sphere bounded water protons; τM is the proton residence lifetime; γ is the gyromagnetic constant for protons (2.675 × 10⁸ T−1 s−1); g is the electronic g-factor (g = 2); S is the total electron spins of the metal ion; μB is the Bohr magneton (9.274 × 10⁻²⁴ J T−1); rM–H is the distance between the metal ion and proton; τCi is the correlation time (i = 1, 2); ωH is the proton Larmor frequency; ωS is the angular electronic frequency; τR is the molecular tumbling time; Tie is the electronic relaxation times (i = 1, 2); Δ is the zero field splitting (ZFS) energy; τv is the splitting correlation time. Three key factors have been identified in most of synthetic molecular contrast agents: τR, τM, and q.[26] Generally, the T1 relaxivity of a given molecular contrast agent is positively correlated with τR, 1/τM, and q.[30] Most clinically relevant molecular contrast agents have q = 1 to compromise for the physiological stability of the chelating paramagnetic metals.[20a, 31]
Figure 1.

Schematic diagram of MNPs interacting with water molecules in the vicinity. The inner-sphere and second-sphere mechanisms illustrate direct chemical exchange and hydrogen bonding models of water molecules with MNPs, respectively, which are mainly correlated with the longitudinal relaxation (T1, recovery of longitudinal magnetization) of water molecules. The outer-sphere mechanism describes diffusion and dephasing of water molecules, corresponding to the transverse relaxation (T2, loss of transverse magnetization). MNPs with different structural features are summarized in categories of relaxation enhancement effect on water protons, including size, shape, surface features, crystal structure, surface modification, and assembled structure.
Second-sphere mechanism describes water protons that are not directly coordinated with the paramagnetic centers, but with the second coordination sphere of the paramagnetic molecules through hydrogen bonds (Fig. 1).[32] Therefore, the contribution of second-sphere mechanism to the relaxivity is usually negligible and is limited to some extreme cases that have no inner-sphere coordination of water molecules.[33] For example, Chen et al. investigated the r1 relaxivities of vanadyl complexes such as vanadyl ethylenediaminetetraacetate and diethylenetriaminepentaacetate that have no inner-sphere contribution to proton relaxivity.[34] It was found that the outer-sphere model did not adequately explain the relaxivity profiles, as the observed relaxivities were best explained with a model that included both second-sphere and outer-sphere contributions. Finally, the authors demonstrated that the second-sphere mechanism can have about 10–30% contribution to the r1 relaxivities in the absence of the inner-sphere contribution.[34]
Other than the inner-sphere and second-sphere mechanisms, the outer-sphere mechanism also describes molecules experiencing relaxation enhancement without direct coordination of the magnetic center/molecules.[35] The landmark model for outer-sphere relaxation was first developed by Hwang and Freed in 1975 and was subsequently refined by Freed in 1978.[21c, 21d] The outer-sphere theory aims to address the relative translational diffusion and rotational motions of water molecules with respect to magnetic centers. Therefore, this effect is less important in paramagnetic ions/molecules due to the weak magnetization behavior and the fast molecular tumbling effect.[35–36] Moreover, it is challenging to discern the second-sphere and outer-sphere components in a real system. In most cases, both of these contributions are often ignored because of the presence of an inner-sphere component (q ≠ 0). The outer-sphere mechanism in superparamagnetic nanostructures and slow-motion systems will be discussed in the following section.
2.2. Outer-sphere diffusion model
The quantum-mechanical outer-sphere theory was originally applied to relaxation phenomenon in weakly magnetized particles.[29] For paramagnetic metal complexes, it was theoretically calculated that the diffusion of water molecules contributes little to the relaxation enhancement in those models.[20a, 21b] The translational diffusion of bulk water non-coordinated with magnetic centers is the major source of water movements. Development in nanoscience and nanotechnology, especially the superparamagnetic NPs with single-domain or multiple-domain structures, have enabled discovery of novel phenomena of relaxation enhancement in MRI. Superparamagnetic NPs with large magnetic susceptibility at room temperature are able to produce a local magnetic field under an externally applied magnet.[11, 20b] As a result, the local magnetic field perturbs the phase coherence of water protons nearby, which shortens the T2 relaxation time (Fig. 1). The T2 relaxation, also called spin-spin relaxation, is derived from the predominant spin-spin interaction during water diffusion.
The quantum-mechanical theory is also valid for superparamagnetic NPs, provided that the particles are small enough to satisfy the conditions for the motional averaging regime (MAR).[37] The T2 relaxivity by MAR theory is given as the following:
| (eq. 6) |
where γ is the gyromagnetic constant of protons (2.675 × 10⁸ T−1s−1); τD is the diffusion time required for a water molecule to diffuse a distance of r; Δωr is the rms angular frequency shift for a distance at the particle surface; μc is the Curie moment of MNP; V* is the effective volume fraction; MS is the saturation magnetic moments; r is the radius of magnetic core; D is the diffusion coefficient of water molecules; L is the thickness of impermeable coating layer on MNP. The MAR states that the time (τD) for a water molecule diffusing a distance of r in any direction is shorter than the reciprocal of rms angular frequency shift at the particle surface (1/Δωr), that is τDΔωr < 1, where τD is also expressed as r2/D (r is the particle radius and D is the water molecular diffusion coefficient).[38] In other words, the MAR indicates that proton relaxation is not complete before encountering a significantly different magnetic environment when moving around magnetic particles. On the contrary, in paramagnetic molecular systems, both the magnetic center and water molecules move too fast to undergo an efficient dephasing process.[29] Therefore, proton relaxation in MAR is highly dependent on the size of particles when other parameters are constrained. Apparently, water molecules could be much easier to move to a significantly different magnetic field around smaller particles in a given time interval compared to that around larger particles. As a result, larger particles are more efficient in perturbing the spin phase coherence of water protons, leading to a shorter T2 relaxation time compared with smaller particles. Taken together, for MNPs in MAR, the r2 relaxivity is positively correlated with Ms and r of MNPs and is inversely related to the D of surrounding water molecules.
However, when the size of magnetic particles reaches a threshold where it no longer satisfies the condition of τDΔωr < 1, proton relaxation around large particles becomes governed by static dephasing regime (SDR) or slow-motion regime (SMR).[38–39] In SDR, protons are fully dephased before they diffuse a critical distance to reach a significantly different magnetic field, provided that the magnetic particles are large enough or the magnetic field is strong enough. In other words, the SDR applies to the situation where the relaxation signal decay occurs faster than the ability of diffusion to average out the phases of different nuclei. Therefore, the SDR model does not consider T2 relaxation refocusing and the diffusion of water molecules is thus ignored. Vuong et al. defined the lower and upper limits of the SDR model as 1 < τDΔωr < 5 and τDΔωr = 20, respectively.[40] Between 5 < τDΔωr < 20, the relaxivity of magnetic particles is independent of particle size.[40] The transition between MAR and SDR in the lower spectrum can be found by computer simulations.[37] As the particle size increases beyond SDR, echo-limited regime (ELR) is applied, where the relaxation is independent of both particle size and echo time in the measurement settings.[37b, 41] This phenomenon is mostly recorded in computer simulations and was occasionally observed in magnetic clusters under extreme conditions.[42]
2.3. Limitations and opportunities
Both the SBM theory and the outer-sphere diffusive theory are based on several assumptions regarding simplistic solid sphere models, such as the use of Redfield assumption (or slow-motion model).[21a, 21b, 24] Moreover, the SBM theory assumes that electronic relaxation is not correlated with molecular reorientation (spatial motion) and that the electronic spin system is dominated by the electronic Zeeman interaction.[43] The first assumption identifies a single correlation time τR, while neglecting the effects of anisotropic reorientation and internal motion of magnetic molecules. This is not true for many real samples, such as in polymers coordinated with multiple magnetic centers. The second assumption is based on the notion that electronic Zeeman interaction is much stronger than the zero-field splitting, whereas a parallel theory in the zero-field splitting limit was published later on.[44] The SBM theory, therefore, provides us with a plausible solution to theoretically understand existing contrast agents and a point of departure for research aiming at modulating the relaxivity of magnetic molecules. Indeed, the SBM theory has been extensively used as a guiding principle to direct the development of most paramagnetic molecular complexes as T1 contrast agents. However, the use of the SBM theory to interpret the process of T1 relaxation in MNP systems seems to be inadequate.
The solid sphere model used to simulate the outer-sphere diffusive theory, which fits only single-domain MNPs, has also found its inherent limitation in understanding T2 relaxation of MNPs with structural complexity. For example, anisotropic shaped MNPs within the single-domain regime possess multiple magnetization poles, by which the induced magnetic field is obviously more complicated than that of spherical ones with single poles.[45] As a result, it may take a shorter time for water protons around anisotropic shaped MNPs to meet in a “single-encounter” than in the case of spherical MNPs of equivalent size. It was found that the shape of iron oxide nanoparticles (IO NPs) also plays a major role in T2 relaxation enhancement.[46] This phenomenon becomes more significant in the case of magnetically assembled structures with reduced symmetry of induced local magnetic fields due to the field coupling between adjacent MNPs.
Over the past decades, MNPs with different physicochemical characteristics have been explored, serving as numerous experimental models to explore their potentials in different applications.[3e, 5] In the field of MRI, which deals with a meticulously dynamic process of electron-nuclei interactions, the structural features of MNPs are of paramount importance. Recent progress has outlined a vital blueprint to analyze the structure-relaxivity relationships between different structural features and MRI relaxation enhancement effect of MNPs (Fig. 1). We will retrospectively summarize the efforts made on the exploration of MNPs with different sizes, shapes, crystal structures, surface modifications, and assembled structures, and more importantly, discuss their coherence and divergence from the classical models.
3. Size
Dating back to the debates of defining ‘nano’, the parameter of size was first considered before quantum confinement theory came into consideration. The relationship between size of MNPs and magnetic properties has been widely reported.[47] However, the role of particle size of MNPs on their MRI performance remains unclear, with both positive and negative effects being reported in literature. On the other hand, due to the fact that the SBM theory was established on paramagnetic metal chelating systems, the gap between paramagnetic systems and MNPs for size effect needs to be considered.[48] The difficulty in resolving the size effect from literature stems from the different scanning parameters and scanners used in different MRI studies. Here, we separated the discussion of size effect on T1 and T2 relaxivity of MNPs. It is worth noting that T1 and T2 relaxivities show a level of interdependence. Factors that influence T1 will also influence T2 relaxivity in MRI.
3.1. Effect on T2 relaxivity
The magnetization of a given sample is an arithmetic sum of all the magnetic moments in the sample divided by the sample volume, which in principle is independent of the grain size.[49] However, the electronic configuration of atoms on the outer surface of MNPs is not the same as the inner surface, known as the surface spin-canting effect.[50] As a result, the magnetic moment of MNPs is an integrated sum of the long-range ordered magnetic spins at the center and the spin canted spins at the boundary of MNPs. In general, the thickness of the spin-canting layer on maghemite is known to be 0.5–0.9 nm depending on the crystallinity, giving rise to size-dependent magnetic moment as well as T2 relaxivity of MNPs (Fig. 2A).[50b] The outer-sphere diffusive theory at the MAR, which covers the majority of currently studied single-domain MNPs, identified two factors regarding the size effect that are related to the T2 relaxation enhancement of MNPs: saturated magnetization (Ms) and diameter (r).[46b]
Figure 2.

Size effect on T2 relaxivity of MNPs. (A) Cartoon showing size-dependent magnetization effect of MNPs. (B-E) TEM images, MR phantoms, relaxation times, and magnetizations of Fe3O4 nanocrystals with different diameters of 4, 6, 9, and 12 nm, respectively. Adapted with permission from ref. [51]. Copyright 2005, American Chemical Society. (F and G) The scaling law of T2 relaxivity of samples in MAR (τDΔωr < 1) and out of MAR (τDΔωr > 1), respectively, summarized from the literature. Adapted with permission from ref. [40a]. Copyright 2012, John Wiley & Sons, Inc.
Larger sized MNPs have higher r2 value in the MAR. For example, the Cheon group studied IO NPs of 4, 6, 9, and 12 nm, which showed size-dependent Ms of 25, 43, 80, and 102 emu/g iron, respectively (Fig. 2B–E).[51] Their r2 values were positively correlated with the diameter of the IO NPs. The size-dependent T2 relaxivity is universal for various kinds of MNPs, including alloyed and doped MNPs,[52] showing good agreement between theoretical predictions and the large body of data reported in the literature (Fig. 2F and G).[40a] The size-dependency of r2 value was also reported in lanthanide-based magnetic NaDyF4 NPs, while the r1 values showed negligible change when different sizes were evaluated.[53]
The size-dependency of T2 relaxivity ends when MNPs reach the critical size limit of MAR. The SDR takes over, and the diffusion of protons surrounding MNPs is unable to average out the different phases of nuclei under static field inhomogeneity.[40a] In this regime, the diffusion of protons surrounding MNPs is still related to the dephasing of magnetic nuclei but is no longer dependent on the size of MNPs. The theory of SDR also plays an important role in MRI signal formation by gradient echo sequences. In the range of ELR, T2 relaxivity decreases as the size of MNPs decreases, which is attributed to the limited proton diffusion in a time interval between a pulse-echo pair.[40a] The size threshold of ELR is dependent on the magnetic properties of MNPs, and is usually observed in multi-domain MNP clusters.[54]
3.2. Effect on T1 relaxivity
It is well known that the T1 relaxation enhancement effect described in the SBM theory is based on models of paramagnetic molecules. Compared with paramagnetic molecules, MNPs are considered as strongly magnetized systems where the outer-sphere contribution to T1 relaxivity may not be ruled out. On the one hand, surface exposed metal ions on MNPs are inversely related to size, which can be described in surface-to-volume ratio (Fig. 3A). Smaller sized MNPs provide a higher number of surface-exposed magnetic metals for water proton coordination and chemical exchange. On the other hand, T1 recovery of magnetization is highly susceptible to strong T2 dephasing effect during the transition of the longitudinal signal to the transverse direction during T1 measurement.[55] It is worth noting that paramagnetism of MNPs is a key factor for T1 relaxation enhancement owing to the presence of transverse field fluctuation near the Larmor frequency, which also explains why superparamagnetic MNPs do not show T1 contrast especially at high magnetic field. It was reported that IO NPs with sizes around 3 nm in diameter showed efficient T1 contrast ability.[56] Hyeon et al. reported the large scale synthesis of 3 nm sized IO NPs for efficient T1 MRI of blood pool imaging in rats (Fig. 3B–E).[57] Recently, the same group showed that small iron oxide nanoclusters are efficient T1 contrast agents for high-resolution magnetic resonance angiography in beagle dogs and rhesus macaques.[58] Furthermore, dynamic MRI enabled the detection of cerebral ischemia in these large animal models, demonstrating the clinical potential of small iron oxide nanoclusters as next-generation MRI contrast agents.[58]
Figure 3.

Size effect on T1 relaxivity of MNPs. (A) Cartoon showing size-dependent surface-to-volume ratio of MNPs. Red color indicates spin-canting layer on the surface. (B and C) TEM images of 3 nm-sized ultra-small SPIONs, and the spin-canting models in comparison with SPIONs of 12, 2.2, and 1.5 nm. (D and E) MR phantom study of the 3 nm-sized ultra-small SPIONs and T1 relaxivity curves of SPIONs of different sizes. Reprinted with permission from ref. [57]. Copyright 2011, American Chemical Society. (F) r1 values and r2/r1 ratios of exceedingly small sized IO NPs as a function of the particle size (< 5 nm). Reprinted with permission from ref. [61]. Copyright 2017, American Chemical Society. (G and H) Size-dependent T1 relaxivity curves and MR phantoms of FeCo NPs of 4 and 7 nm in diameter in comparison with Feridex and Magnevist agents. Reprinted with permission from ref. [52b]. Copyright 2006, Nature Publishing Group.
Size-dependent r1 values have been reported in many types of MNPs, such as MnO[59] and NaGdF4[60] NPs. T1 relaxivity is, however, not solely determined by the size-dependent surface-to-volume ratio of MNPs. Reducing the size of MNPs gives rise to greatly increased surface energy which further reduces the colloidal stability in an ambient environment. To balance the T1 MRI ability and colloidal stability of MNPs, Zhou et al. synthesized gadolinium-embedded IO NPs with a critical size of 4.8 nm in diameter.[52c] The satisfactory T1 relaxivity, which was attributed to the elevated level of interior spin-canting effect as well as the enhanced colloidal stability, enabled efficient MRI of subcutaneous tumor xenografts in living subjects.[52c] More recently, Shen et al. systematically analyzed the T1 relaxivity of a series of small-sized IO NPs, indicating that precisely controlled IO NPs with a diameter of 3.6 nm exhibited the highest r1 value among seven samples with sizes below 5 nm (Fig. 3F).[61] Meanwhile, the lowest r2/r1 ratio for the 3.6 nm sized IO NPs facilitated highly efficient T1 contrast imaging.
It should be noted that decreasing the size of MNPs will not alter the dominating value of T2 relaxivity with respect to T1 relaxivity in MNPs. The r1 value is still smaller than the r2 value in any small-sized IO NPs. The appearance of T1 signal happens when T2 shortening effect is diminished. This is the fundamental basis of signal processing and measurement in MRI. Therefore, it is conceivable that tuning the size of MNPs may influence the T1 and T2 contrasts in MRI. In fact, tuning the balance between T1 and T2 contrast ability in MNPs is an area of intense research.[62] Size-dependent T1, T2, and T1-T2 dual-modal contrasts have been reported in different types of MNPs, including pure iron oxide, metal-doped iron oxide, and FeCo alloy nanoparticles (Fig. 3G and H).[52b, 52d, 63] Taking IO NPs for example, a diameter of 5 nm leads to T1-T2 dual-modal MRI contrasts, whereas T1 contrast dominates at size below 3 nm and T2 contrast dominates when the size reaches around 10 nm in clinically relevant magnetic fields.[64] The tunable T1-dominated, T2-dominated, and T1-T2 dual-modal MRI were also reported for manganese engineered IO NPs with controllable sizes.[52d] Notably, the ability of MNPs in generating either T1 or T2 MRI contrast is also dependent on the optimization of imaging parameters at different sequences.[65]
Alternatively, large T1 contrast enhancement of superparamagnetic IO NPs (SPIONs) was achieved by using ultra-low magnetic field (ULF) MRI without compromising with the size effect.[66] The authors operated the ULF-MRI at a magnetic field at around 0.13 mT which is about four orders of magnitude lower than a typical clinical MRI field of 1.5 T. The SPIONs with diameters from 11 to 22 nm were tested and the highest r1 value of 615 mM−1 s−1 was obtained for the 18 nm sized SPIONs. It is interesting that large sized SPIONs achieved strong T1 contrast enhancement at ULF-MRI by tailoring the magnetic nanoparticle fluctuation rate. At ULF, the unsaturated magnetic moment of SPIONs greatly diminishes the undesirable negative contrast effect which is considered as the dominating effect to the low T1 contrast enhancement at high magnetic field.
4. Shape
Controlling the shape of colloidal nanoparticles is not only an aesthetic demand, but also a starting point for functional design applications, such as catalysis, plasmonics, sensing, and magnetism.[67] MNPs consist of assemblies of separate but strongly interacting magnetic moments.[68] The classical electrodynamic theory demonstrated that only ellipsoidal shaped bodies have homogenous magnetization, whereas distorting the shape requires additional energy to stabilize the particle anisotropy.[69] The shape of MNPs is a determining factor of the strength and character of magnetic anisotropy. Moreover, dealing with the strong metal-oxygen bonds and diverse crystal packing structures in metal oxide crystals (e.g., IO NPs) requires more rigorous control over the synthetic approaches.[2d, 4a] As such, investigating shape regulated magnetic properties of MNPs and the potential impact on MRI relaxivity is highly desirable.
4.1. Cubes
Benefiting from the development of synthetic approaches for novel nanomaterials over the past few decades, MNPs with shapes deviating from ellipsoid conformations have been achieved.[4a, 70] The reported nonellipsoidal or nonspherical shapes of IO NPs include, but are not limited to cube,[71] concave,[72] octapod,[46b] tripod,[46d] plate,[30] flower,[73] octahedron,[74] tetrahedron,[46c] ring,[75] and rod.[76] It is intuitive to ask how and to what extent does the shape influence the magnetic properties of MNPs. Previous theoretical simulations indicated that MNPs attain their lowest energy state in quasiuniform magnetization.[77] In general, non-spherical MNPs produce a local magnetic field that extends farther out in the directions parallel to the particle magnetization and are more closely condensed to the particle in the perpendicular directions compared to equivalent spherical ones.[78]
Taking cubes as an example, the magnetic spins spread at the corners of a cube like a flower state (Fig. 4A–F).[16b, 45, 79] Therefore, water diffusion and relaxation around a magnetic cube greatly benefit from the emerging complexity of the induced local magnetic field, causing irreversible dephasing in routine Carr-Purcell-Meiboom-Gill (CPMG) sequences in MRI. This effect mainly contributes to the T2 relaxivity, resulting in enhanced r2 values for IO cubes compared with spheres of equivalent size and magnetic moment. The Hyeon group reported uniform ferrimagnetic iron oxide nanocubes (FIONs) with a critical edge length of 22 nm, which exhibited an extremely high r2 value of 761 mM−1 s−1 under a 3 T clinical scanner (Fig. 4G–J).[46a] After being coated with phospholipid polyethylene glycols, the FIONs showed highly sensitive MRI of single cells and transplanted pancreatic islets in small rodents and large animals.[80] Core-shell type cubic IO NPs with antiferromagnetic core and ferrimagnetic shell can provide both effective MRI relaxivity and hyperthermia effect.[81] After oxidation, cubic Fe1-xO@Fe3-xO4 nanoparticles with a size of 16 nm showed a high r2 value of 509 mM−1 s−1 at 300 MHz.[81]
Figure 4.

Cubic MNPs and their magnetic properties and MRI performance. (A-D) TEM images and M-H curves (measured at 300 K) of cubic and spherical Zn0.4Fe2.6O4 NPs. (E and F) Simulated magnetic spin states of cube and sphere, respectively. The color map indicates the degree of spin canting against external magnetic field where red represents nondeviated spins and blue indicates highly canted spins. Reprinted with permission from ref. [16b]. Copyright 2012, American Chemical Society. (G) TEM image of 22 nm sized cubic WFIONs. (H-J) M-H curves, MR phantoms, and r2 values of cubic IO NPs with different sizes, respectively. Reprinted with permission from ref. [46a]. Copyright 2012, American Chemical Society. (K) Magnetite nanocubes with an average size of about 9.7 nm serving as both T1 and T2 contrast agents as shown in the phantom study. Reprinted with permission from ref. [83b]. Copyright 2015, The Royal Society of Chemistry.
The cubic shape also features specific facets exposed on the surface. This provides an exceptional model for investigating the effect of surface structure on T1 relaxivity of MNPs.[46c, 82] Due to the well-defined shape and surface structure, the enhanced T1 relaxivity and T1-T2 dual-modal contrast abilities of IO nanocubes were reported by many research groups (Fig. 4K).[52e, 83] We will further elaborate the effect of surface structure in a latter section.
4.2. Octapods
The Gao group reported on novel octapod shaped IO NPs by a chloride ion-assisted synthetic method in a size-controllable manner (Fig. 5A–F).[46b] The octapod IO NPs with an edge length of 30 nm exhibited an ultrahigh r2 relaxivity of 679.3 ± 30 mM−1 s−1 at 7 T. This led to MR contrast imaging of orthogonal liver tumors in small mice with high sensitivity and in low doses. In this case, the effective radius of octapod IO NPs, by simulating the octapod IO NP as a sphere on its edge length, was found to be about 2.4 times larger than that of spherical IO NPs with equivalent solid volume (Fig. 5G). This further indicates that the shape effect of nonspherical MNPs may generate a larger area of effective spin perturbation than that of spherical MNPs with equivalent Ms values. Although in the classic outer-sphere diffusive theory the volume fraction factor was included, the radius applied to define the T2 relaxivity of MNPs was simulated based on a sphere. Of note, it was the first time that the effective radius of MNPs was investigated for the octapod shaped IO NPs.[46b] More recently, Pradeep et al. found that tripod shaped IO NPs also showed enhanced T2 relaxivity, which shows good agreement with the previous study.[46d]
Figure 5.

Octapod IO NPs and shape effect on T1 and T2 relaxivities. (A-C) TEM and HRTEM image of octapod-30 IO NPs (inset: geometric model). Scale bar: 100 nm (A), 20 nm (B), and 2 nm (C). (D-F) Comparisons of MR phantoms, M-H curves, and r2 values of octapod IO NPs and spherical IO NPs with equivalent geometric volume, respectively. (G) Schematic models of octapod and spherical IO NPs with identical geometric volume, where octapod IO NPs have larger effective radius (R) than that of spherical IO NPs (r). R = 2.4 r. Reprinted with permission from ref. [46b]. Copyright 2013, Nature Publishing Group. (H) TEM images and (I) r1 values of DNA-Gd decorated Au spheres and stars. Reprinted with permission from ref. [85]. Copyright 2016, American Chemical Society. (J) The enhanced T1 relaxivity of DNA-Gd complex decorated Au stars are attributed to the enhanced second-sphere contribution due to the shape effect. Reprinted with permission from ref. [84]. Copyright 2015, American Chemical Society.
Non-magnetic NPs with different shapes may alter the water interacting behaviors of paramagnetic metals decorated on the surface. The Meade and Odom groups showed that the r1 relaxivity of Gd species can be improved by conjugating them onto non-magnetic Au nanostars (Fig. 5H–J).[84] Significantly, Au nanostars decorated with Gd chelates showed greatly enhanced r1 relaxivity of 54.7 mM−1s−1 at 60 MHz and at 37 °C, which is among the highest for Gd(III) nanoconjugates with one inner-sphere water molecule (q = 1).[84] Using nuclear magnetic relaxation dispersion (NMRD) analysis, it was shown that the shape and surface curvature in Au nanostars played a major role in sequestrating water molecules in close proximity to the Gd complexes. In this respect, Gd-Au nanostars facilitate longer access to second-sphere water molecules and thereby generate relaxation enhancement greater than that can be achieved by using small-molecule contrast agents alone. The structure-property relationship between the relaxivity and the shape distribution of the Gd-Au nanostars further indicated that r1 value increases with increasing the amount of branched Au particles.[85]
4.3. Plates
The platelet structures of MNPs have also attracted considerable interest.[86] Ferromagnetic exchange interactions have been observed on the ultrathin layered structure of magnetic crystals, which provide an opportunity to tailor the spin exchange interactions in developing magnetic devices.[87] Specifically, magnetic nanoplates featuring MRI contrast ability have been reported.[88] In a previous report, manganese oxide nanoplates with surface passivated Mn3+, evidenced by X-ray photoelectron spectroscopy, showed higher r1 value (2.06 mM−1s−1 at 3 T) compared with those dominated with Mn4+ ions.[59c] Recently, the Pearson product moment correlation method was employed to show that the high r1 value of manganese oxide nanoplates is strongly correlated with the number of paramagnetic manganese ions exposed on the surface.[88e] It is plausible that the conformation change from a sphere to a plate affects the density of surface exposed metal ions, resulting in favorable coordination and chemical exchange of water protons.
The Murray group reported that triangular gadolinium oxide (Gd2O3) nanoplates showed ultrahigh r2 value, but very low r1 value, 140 and 1.41 mM−1s−1 at 9.4 T, respectively.[88f] Although paramagnetic Gd2O3 nanoparticles were mostly studied as T1 contrast agents, the Gd2O3 nanoplates with such high r2 value may serve as effective T2 contrast agents. Similarly, the enhanced T2 relaxivity was observed in magnetite nanoplates.[30, 82] However, magnetite nanoplates also exhibited size-dependent magnetization effect, thus the correlation between T2 relaxivity and the aspect ratio of nanoplates needs to be further validated.[30] The surface structure of magnetic nanoplates and the effect on MRI relaxivity will be further discussed in a latter section. Future studies regarding the evaluation of shape anisotropy and T2 relaxivity of MNPs are thus desirable, which will benefit from better preparation strategy and structural analysis technology. In a brief summary, two important factors relating to shape effect on MRI relaxivity of MNPs include enhanced effective radius and well-defined surface structure compared with sphere ones.
4.4. Other shapes
Great progress in controlling the shape of MNPs has been made.[46c, 89] For example, hollow shaped manganese oxide nanoparticles (HMONs) have been widely studied and the MRI relaxivity was compared with solid water-soluble manganese oxide nanoparticles (WMONs).[90] The results showed that both T1 and T2 relaxivities of HMONs were markedly higher than those of WMONs, by factors of 5.8 and 4.4, respectively.[90] It was demonstrated that the increased number of manganese ions exposed on the surface of HMONs play an important role.[91] Similarly, hollow IO NPs (HIONs) were developed as T2 MRI contrast agents.[92] However, the implication of HIONs was limited by the low r2 and r1 values which are likely due to the low magnetic moment of the dominating maghemite (Fe2O3) phase in as-synthesized HIONs.[93]
An interesting study was reported on designing magnetic heterotrimers as tunable T1 and T2 MRI contrast agents.[94] In this work, each heterotrimer consists of an IO nanoparticle, a Pt nanocube, and an Au nanoparticle which were fused in a row via solid-state interfaces (Fig. 6A). The Au nanoparticle was then covalently decorated with Gd chelators (Fig. 6B). The size of Au nanoparticles was controlled by seed-mediated epitaxial growth and the distance between IO and Au nanoparticles was mediated by the size of Pt nanocube at the center of the heterotrimers (Fig. 6C–G). In this way, the magnetic field coupling between Gd species and IO nanoparticle could be manipulated by controlling the distance between them to achieve dual-enhanced T1 and T2 contrasts (Fig. 6H and I).[94]
Figure 6.

Heterogeneous structure and the effect on T1 and T2 relaxivities. (A-C) Schemes showing heterogeneous nanostructures with core-shell and dumbbell shapes for magnetic coupling of T1 and T2 contrast agents. (D-G) TEM images of four types of heterogeneous nanostructures: Gd-Au-IONPs, Gd-HNTs, Gd-DB-HNTs, and Gd-XDB-HNTs, respectively. (H and I) MR phantom study of the four heterostructures reveals structure-dependent T1 and T2 contrasts with different concentrations. Reprinted with permission from ref. [94]. Copyright 2014, American Chemical Society.
By controlling the reaction temperature during thermal decomposition of iron oleate complex in the presence of sodium oleate, IO nanoplates, tetrahedrons, octahedrons, cubes, multi-dendrites, and coalesced superstructures can be obtained in one system.[46c] More interestingly, magnetite phase enveloped IO nanostructures (plates, tetrahedrons, octahedrons, and cubes) showed enhanced r2 values, whereas the others with a majority of Wüstite phase showed relatively low r2 values due to the low magnetic moment.[46c] However, the comparison of T2 relaxivity between different samples requires special consideration of the crystallization and magnetization effect.[38, 40a, 42b] Weakly magnetized antiferromagnetic β-FeOOH nanorods can be oxidized into strongly magnetized superparamagnetic Fe3O4 nanorods, leading to a significantly high r2 value of 608 mM−1s−1 at 3 T.[89d]
5. Crystal structure
Magnetic property arises from the specific arrangement of magnetic atoms and the alignment of magnetic moments. Such a delicate, yet complicated process relies heavily on several factors regarding crystal structure of the materials, such as the crystal phase, crystallinity, superexchange effect, domain boundary, and crystalline anisotropy. In the following sections, we will elaborate on the relationship between different crystal characteristics and magnetic properties, and their effects on T1 and T2 relaxivities.
5.1. Crystal phase
Although iron oxide crystals with a complex monoclinic structure were recently obtained at ambient conditions,[95] spinel or inverse spinel structures of magnetite phase (Fe3O4) are still among the most stable and the most abundant magnetic materials compared to cubic Wüstite (FeO) or maghemite (Fe2O3). The unique spinel formulation of A2+B23+O42− allows the magnetic atoms to form long-range-order spin states due to the superexchange effect. The degree of spin order within crystals directly contributes to the magnetization effect and the induced magnetic field. Therefore, the crystal phase and the crystallinity dictate the magnetization and consequently the MRI relaxivity of magnetic nanomaterials. Due to the similarity of the crystal phases, mechanistic studies on the formation of magnetite, maghemite, or Wüstite phase of IO NPs remain a daunting task. Although it is technically different to isolate the mixed phases in IO NPs, it is important to recognize their influence on the degree of spin order within the crystals. In literature, there have been significant variations in the reported r2 values of IO NPs of similar sizes, which is likely due to the differences in the crystal phases.
Crystallinity refers to the degree of structural order in solid materials, which is very sensitive to the environment during the crystal formation. For example, the intrinsic spin-canting effect, especially on the surface of magnetic crystals, would destroy the long-range-order of magnetic spins and therefore decreases the magnetic moments.[50] Crystallinity is usually accompanied with the variation of crystal phase in different materials. Magnetite phase is compliant with a thermodynamic process during particle formation.[96] Meanwhile, the kinetic growth of particles can lead to the production of a Wüstite phase, which can happen simultaneously during the thermodynamic process, resulting in particles with mixed phases.[46c, 97] The correlations between crystal phase as well as crystallinity and T2 relaxivity of magnetic nanomaterials in MRI follow a general rule that higher degree of magnetic spin order within crystals leads to greater T2 relaxivity. Examples of tuning crystallinity in order to regulate the magnetization of MNPs can be found in the evolution of synthetic methods from water solvent to high boiling temperature organic solvents.[4a] The crystallinity and the consequent magnetization of MNPs benefits from the burst nucleation and steady-state growth at high reaction temperatures.[70b]
Metallic iron possesses the highest theoretical magnetic moment (~228 emu/g Fe); however, it is very challenging to stabilize iron nanoparticles under ambient conditions due to the high oxidative potential.[98] It has been reported that the formation of Fe/Fe3O4 or Fe/MFe2O4 (M = Fe, Co, and Mn) core-shell structures are able to retard the oxidation of iron in the core (Fig. 7A–F).[99] For example, the Sun group reported an all crystalline body-centered cubic (bcc) Fe/Fe3O4 nanoparticles with increased stability in physiological solutions.[100] The modified bcc-Fe/Fe3O4 nanoparticles showed a r2 of 220 mM−1s−1 at 1.5 T, which is 2-fold higher than that of the typical contrast agent Feridex (110 mM−1s−1) obtained by a hydrothermal method.[100] Recently, iron carbide (FeCx) nanoparticles have been explored as high-performance T2 contrast agents (r2 = 464.02 mM−1s−1 at 7.0 T) due to the high magnetic moment (Ms of 125.4 emu/g) and great stability against oxidation under ambient environments (Fig. 7G–J).[101]
Figure 7.

Crystal phase and magnetization effect on T2 relaxivity. (A and B) TEM and HRTEM images of 16 nm iron/iron oxide core/shell nanoparticles. (C-E) XRD, M-H curve, and r2 values for the iron/iron oxide core/shell nanoparticles, respectively. Reprinted with permission from ref. [99a]. Copyright 2011, John Wiley & Sons, Inc. (F) The r2 values map for different samples as a function of both the particle size and the magnetization measured at 0.47 T. Solid lines are calculated using the outer-sphere theory. Dotted line indicates the boundary of r2 values for ferrite MNPs. Reprinted with permission from ref. [99b]. Copyright 2011, John Wiley & Sons, Inc. (G-I) TEM, M-H curves, and T2 relaxivity of the Fe5C2 NPs. Reprinted with permission from ref. [101d]. Copyright 2014, John Wiley & Sons, Inc. (J) Stability of the Fe5C2 NPs compared with amorphous Fe NPs. Reprinted with permission from ref. [101c]. Copyright 2014, The Royal Society of Chemistry.
Chou and co-workers reported antiferromagnetic α-iron oxide-hydroxide (α-FeOOH) nanocolloids with individual diameters of 2–3 nm, which showed very low magnetic moment at room temperature (0.05 emu/g at 2 T).[102] The relatively high r1 value of 2.12 mM−1s−1 and low r2/r1 ratio of the α-FeOOH nanocolloids measured at 4.7 T demonstrated effective T1 contrast imaging of cells in vitro and vascular and urinary systems in vivo.[102a] Furthermore, encapsulating α-FeOOH nanocolloids into worm-like mesoporous silica nanoparticles (WMSN) resulted in FeOOH/WMSN nanocomposites, which showed a further increase in the r1 value.[102b] In another example, synthetic antiferromagnetic nanoparticles (SAF-NPs) were prepared by separating two thin layered ferromagnetic alloys by a nonmagnetic spacer layer.[103] Roosbroeck et al. demonstrated that the SAF-NPs exhibited improved T2 relaxivity over ferromagnetic IO NPs due to the antiferromagnetic coupling between ferromagnetic layers, which mimic ferromagnetic behavior while overcoming the superparamagnetic size limit.[103] Moreover, both theoretical and experimental results confirmed that the SAF-NPs have neither superparamagnetic size limit nor SDR limit in T2 relaxivity values, which make them competitive state-of-the-art contrast agents for MRI.[103–104]
5.2. Crystal dopants
5.2.1. Lattice substitution
Artificially engineering the crystal structure of colloidal particles through dopant control has long been realized as an effective way to synthesize new materials.[105] For example, Co ion doping into (Fe1-xCox)3BO5 nanorods dramatically changed the magnetic ordering from antiferromagnetic order at low temperature to ferromagnetic above room temperature.[106] In a typical spinel or inverse spinel structure of magnetite, Fe(II) and Fe(III) ions are distributed in either octahedral (Oh) or tetrahedral (Td) voids. Whereas the magnetic spins in Oh voids align in parallel, those in Td voids align antiparallel to an external magnetic field. Therefore, the net magnetization represents the remaining spin magnetization after the antiferromagnetic coupling.
The Cheon group artificially engineered the magnetism of IO NPs through doping of different transition metal ions into the crystal voids (Fig. 8A–D).[105b] Due to the fact that magnetic net spins of Mn2+, Fe2+, Co2+, and Ni2+ are 5, 4, 3, and 2 μB, respectively, MnFe2O4 nanoparticles exhibited the highest magnetic moment (110 emu/mass of magnetic atoms) and r2 relaxivity (358 mM−1s−1 at 1.5 T) among the other ferrites under equivalent conditions.[105b] Furthermore, doping non-magnetic metal Zn2+ ions into magnetite led to the formation of spinel structures of (ZnxFe1-x)Fe2O4 nanoparticles, in which Zn2+ mainly occupied the Td sites while some Fe3+ moved to the Oh sites of the spinel matrix (Fig. 8E–G).[105a] The crystal structure of Zn doped IO NPs was confirmed by extended X-ray absorption fine structure analysis. This strategy drastically enhanced the magnetic moment of IO NPs to as high as 175 emu/g with respect to magnetic metals in the case of (Zn0.4Mn0.6)Fe2O4 nanoparticles, while up to 860 mM−1 s−1 was achieved for the r2 relaxivity.[105a] In a recent study, the successful post-synthetic fabrication of metal-doped magnetite nanoparticles through cation exchange approach was reported (Fig. 8H and I).[107] For example, superparamagnetic zinc doped octapod IO NPs showed a very high r2 relaxivity of 754.2 mM−1 s−1 at 7 T, enabling ultra-sensitive contrast imaging of early hepatic tumors and metastatic lesions as small as 0.4 mm.[107] In another study, an ultra-high r2 value of 904 mM−1 s−1 (at 7 T) was obtained for 18.5 nm sized manganese-doped magnetite nanoparticles with the formula of MnxFe3–xO4 (x = 0.43).[108]
Figure 8.

Crystal doped structure and the effect on T2 relaxivity. (A) TEM images of MnFe2O4 (MnMEIO), Fe3O4 (MEIO), CoFe2O4 (CoMEIO), and NiFe2O4 (NiMEIO). (B) Mass magnetization values and schematic cartoons of the spin alignment phenomenon of magnetic ions in the spinel structure of the four MNPs. (C and D) MR phantoms and calculated T2 relaxivity coefficient of the four MNPs and CLIO NPs. Reprinted with permission from ref. [105b]. Copyright 2007, Nature Publishing Group. (E-G) The Zn K edge EXAFS spectra, magnetic spin alignment diagrams, and r2 values of the Zn2+ doped IO NPs with different ratios. Reprinted with permission from ref. [105a]. Copyright 2009, John Wiley & Sons, Inc. (H and I) Cation exchange strategy for fabricating ZnIO and MnIO NPs and their r2 values as a function of the shape, respectively. Reprinted with permission from ref. [107]. Copyright 2016, American Chemical Society.
5.2.2. Crystal embedding
Due to the mismatch between the coordination environment, crystallization condition, and atomic sizes, doping metal ions into IO NPs may lead to phase separation of different components. Zhou et al. synthesized gadolinium-embedded iron oxide (GdIO) spherical nanoparticles with a diameter of about 14 nm, which exhibited partial paramagnetism compared with pure magnetite nanoparticles of equivalent size (Fig. 9A and B).[62b] Structural analysis indicated that Gd species formed tiny Gd2O3 crystals within the main body of the iron oxide crystal matrix. Surprisingly, the GdIO nanoparticles showed synergistically enhanced T1-T2 dual-modal contrasts, with enhanced r1 and r2 values over small Gd2O3 nanocrystals and IO NPs with respect to each of the metal masses, respectively (Fig. 9C). More importantly, the T1-T2 dual-modal MRI contrast agents hold great potential in MRI detection of lesions with improved accuracy and precision in a self-confirmed manner.[55, 109] A similar phenomenon was also observed for europium-engineered iron oxide (EuIO) nanocubes, in which both r1 and r2 values were tunable based on size and doping ratio of the EuIO nanocubes.[52e] Additionally, decreasing the size of GdIO nanoparticles significantly reduced the r2 relaxivity and thus the T1 contrast was predominant in MRI (Fig. 9D).[52c] The 4.8 nm sized GdIO nanoparticles showed a high r1 value of 7.85 mM−1 s−1 and a low r2/r1 ratio of 5.24 at a strong magnetic field (7 T) (Fig. 9E and F). After coating with zwitterionic dopamine sulfonate molecules, ultrasmall GdIO nanoparticles exhibited ‘stealth’ functionality with low nonspecific adsorption in biological medium. These particles showed improved retention time in blood, efficient tumor passive targeting and rapid renal clearance.[52c]
Figure 9.

Crystal embedded structure and the effect on T1 and T2 relaxivities. (A) The paradigm of T1-T2 dual-modal contrast agents based on nanoentity with T1 materials embedded into T2 materials. (B and C) The M-H curves and T1-T2 dual-modal MR phantoms of the GdIO NPs. Reprinted with permission from ref. [62b]. Copyright 2012, John Wiley & Sons, Inc. (D) Small sized (below 5 nm in diameter) GdIO NPs with inner spin-canting effect. (E and F) The r1 and r2 values and MR phantoms of small sized GdIO NPs with different diameters below 5 nm. Reprinted with permission from ref. [52c]. Copyright 2013, American Chemical Society.
5.3. Surface structure
5.3.1. Metal exposure
The isotropic growth nucleus leads to formation of spherical nanoparticles in compliance with the growth thermodynamics and kinetics.[110] Spherical nanoparticles may have a large amount of structural defects on the surface; on the contrary, controlling the growth rate of different facets leads to nanostructures with well-defined surface structure.[111] It is highly desirable to explore the relationship between surface structure and activity of nanomaterials in different applications.[112] For example, the catalytic activity of noble metal nanoparticles has long been connected to the surface structures of different exposed facets of nanostructures.[113] In MRI, the process regarding T1 relaxation enhancement by magnetic metals shares some basic behaviors with that of catalysis, such as coordination, chemical exchange, and dissociation of protons with metal centers. However, the mechanistic investigation of T1 relaxation enhancement effect in MNPs has been rarely studied due to a lack of suitable models (Fig. 10A).
Figure 10.

Surface structure and the effect on T1 and T2 relaxivities. (A) Schematic illustration of proton interaction phenomena in magnetic systems relating to T1 and T2 relaxations. (B-D) TEM and HRTEM images of Fe3O4 nanoplates with different sizes and thicknesses, but with the same atomic structures as the Fe3O4(111) facet. (E-G) The r1 and r2 values and MR phantoms of the Fe3O4 nanoplates, where the r1 values are correlated to the surface exposed Fe3O4(111) facet. Reprinted with permission from ref. [30]. Copyright 2014, American Chemical Society. (H-J) TEM and HRTEM images, surface structure and water proton chemical exchange models, and the r1 values of the GdIO nanoplates. Reprinted with permission from ref. [82]. Copyright 2015, American Chemical Society.
The Gao group reported the controllable synthesis of magnetite nanostructures with different surface exposed facets.[46c] Magnetite nanoplates, truncated octahedrons, and tetrahedrons contain were synthesized with Fe3O4{111} facets bound on the surface, while magnetite nanocubes were obtained with Fe3O4{100} facets. The Fe3O4{111} and Fe3O4{100} facets have different metal exposure densities of 0.114 and 0.053 Å−2, respectively. More importantly, well-defined surface structure of these MNPs would attain lower level of surface defects compared with spherical MNPs. These magnetic nanostructures exhibited 2.5–4.2 times higher r1 values compared with that of equivalent nanospheres, demonstrating the critical role of metal-rich facets in T1 relaxation enhancement of MNPs. Given the different sizes and surfa-to-volume ratios, the tendency of r1 values between the Fe3O4{111} and Fe3O4{100} facets was unclear for these nanostructures.
In an attempt to investigate the interplay between T1 and T2 contrasts in IO nanoplates, magnetite nanoplates with hexagonal shape were obtained with controlled aspect ratios (Fig. 10B–D).[30] These IO nanoplates showed thickness dependent T1-T2 on and off states. For example, the IOP-8.8, IOP-4.8, and IOP-2.8 were demonstrated to be T1-T2 OFF-ON, ON-ON, and ON-OFF types in a seesaw manner, respectively (Fig. 10E–G). Unfortunately, the change of r1 values of different Fe3O4{111} nanoplates does not follow the tendency of surface-to-volume ratio, in which the IOP-2.8 showed an even lower r1 value (14.36 mM−1s−1) compared with those of IOP-8.8 and IOP-4.8 samples (38.11 and 43.18 mM−1s−1, respectively). This may be due to the spin-disorder at the corner of such ultrathin nanoplates.[30] To further test the effect of surface exposed metals on T1 relaxivity, GdIO nanoplates with Fe3O4{100} facets and embedded Gd ions exposed on the surface were obtained (Fig. 10H–J).[82] Due to the small size (10 nm in length and 2 nm in thickness), the GdIO nanoplates exhibited excellent T1 contrast at various magnetic fields ranging from 0.5 to 7 T. After being coated with zwitterionic dopamine sulfonate molecules, the GdIO nanoplates showed excellent efficiency in contrast enhanced magnetic resonance angiography in a rat model. Overall, these results indicated that large-area exposed metal-rich surface could greatly facilitate the chemical exchange of surrounding water molecules, opening up new venues for the rational design of high-performance T1 contrast systems for MRI and sensing applications.
5.3.2. Coordination
Other magnetic nanoplates, such as manganese oxide and Gd2O3, have been studied with enhanced T1 relaxivity. The Hyeon group reported that ultrathin manganese oxide nanoplates with a thickness of about 1 nm exhibited a high r1 value of up to 5.5 mM−1s−1 compared with MnO spherical nanoparticles (r1 values of 0.41 to 2.38 mM−1s−1) at a 1.5 T clinical MR scanner, because of the high concentration of manganese ions exposed on the surface.[88e] However, this factor is not generalizable to Gd2O3 oxide nanoplates. The Murray group reported that tripodal and triangular Gd2O3 nanoplates with {111} facets exposed on surface showed very low r1 values.[88f] To investigate the coordination chemistry, the Gao group studied Gd2O3 nanoplates with {100} or {111} facets exposed on the surface (Fig. 11A and B).[114] Crystal structural analysis revealed that Gd2O3{100} facets have more exposed gadolinium ions than Gd2O3{111} facets (Fig. 11C and D). The metal exposure on Gd2O3{100} facets may greatly facilitate proton coordination compared to Gd2O3{111} facets with potential steric hindrance. The Gd2O3{100} nanoplates showed an approximately 4-fold higher r1 value compared to that of oxygen-terminated Gd2O3{111} nanoplates (Fig. 11E and F).[114] The density functional theory simulation results further revealed that the enhanced T1 relaxivity can be attributed to water bridge coordinations on the metal-rich surface of Gd2O3{100} nanoplates.[114] More interestingly, the possibility of water hopping on such a metal-rich surface was discussed through detailed modeling and analysis,[115] which may impact future works on MRI relaxivity.
Figure 11.

Surface coordination behavior and the effect on T1 relaxivity. (A and B) TEM and HRTEM images of the Gd2O3{100} and Gd2O3{111} nanoplates, respectively. (C-E) The proposed surface coordination models, and calculated coordination phenomena and the binding energies for water molecules on the Gd2O3{100} and Gd2O3{111} facets. (F) The r1 values for the two Gd2O3 nanoplates under different magnetic fields. Reprinted with permission from ref. [114]. Copyright 2016, The Royal Society of Chemistry. (G) Proposed schemes for the oxygen vacancy on surface and the interaction with water molecules. (H and I) The T1 relaxivities and MR phantoms of the PEG-NaxGdWO3 nanorods with different oxidation levels. Reprinted with permission from ref. [119]. Copyright 2017, American Chemical Society.
5.3.3. Surface vacancy
For a long time, it has been known that several properties of solid materials are controlled not only by their geometric and electronic structures but also by faults or defects in the structure.[116] Investigating the relationships between the chemical, electrical, and optical properties and the defects of materials have garnered remarkable interest in materials science, namely defect engineering.[117] In other words, the atomic nature of point defects in materials, especially oxides, is essential for the understanding of their structure-property relationships. For example, surface oxygen deficiency has been widely explored for designing a variety of new materials including catalytic reactions and photothermal conversion.[118]
Inspired by this rationale, Ni et al. reported Gd3+-doped tungsten bronzes and investigated the effect of surface oxygen vacancy on the T1 relaxivity (Fig. 11G).[119] The concentration of oxygen vacancies in the NaxWO3 (PEG-NaxGdWO3) nanorods were controlled by adding hydrogen peroxide and monitored by electron spin resonance spectrum.[119] The r1 value of the oxygen-deficient PEG-NaxGdWO3 nanorods was as high as 80 mM−1s−1 at 0.7 T and 32.1 mM−1s−1 at 3.0 T, and was dependent on the concentration of surface oxygen vacancy (Fig. 11H and I).[119] This study provided a novel strategy to modulate the critical parameters of proton relaxation on solid nanomaterials, which may be of great important to stimulate the design of novel MNPs for MRI applications.[120]
6. Surface modification
MNPs synthesized through solvothermal methods usually require multi-step surface modification to meet the criteria of stability, biocompatibility, and targeting ability for biomedical applications.[121] Research interest in surface engineering of MNPs has gained momentum over the past decades.[122] The numerous strategies for surface engineering of MNPs have been extensively reviewed in a great number of publications.[7a, 123] Here, we mainly focus on several approaches of surface modification that would influence the MRI relaxivity of MNPs.
6.1. Anchoring structure
Strategies for surface functionalization of MNPs share the same rules with those for other nanomaterials. Generally, stabilizing MNPs in solvent requires surface ligands to avoid inter-particle agglomeration, which are either attached to MNPs through chemical coordination or coated on MNPs through physical forces (e.g., van der Waals, electrostatic).[121a, 123b] The former requires an anchoring moiety that is able to chelate with the surface ions of MNPs. Although various kinds of chelating molecules for surface functionalization of MNPs have been developed, the anchoring behavior of molecules on MNPs is rarely studied.
The Pierre group reported the systematic study of surface functionalization of MNPs using different anchoring moieties, and the influence on magnetic properties of MNPs was studied (Fig. 12A–C).[124] The results showed that IO NPs coated with PEG polymers via a catecholate-type anchoring moiety (e.g., dopamide and 2,3-dihydroxybenzamide) maintained the magnetic moment, whereas other anchoring moieties (e.g., phosphonate, carboxylate, and dopamine) decreased the magnetic moment of IO NPs. The T2 relaxivity correlated to the anchoring nature of surface molecules on IO NPs, due to the alternation of surface spin canting effect through specific coordination. More recently, the Gao group showed the binding affinity of anchoring ligands is strongly correlated to the magnetic moment of IO NPs (Fig. 12D–F).[125] In particular, higher binding affinity of the anchoring ligands leads to lower magnetic moment of the resulted IO NPs, in which π-π and p-π conjugations between the anchoring ligands (e.g., catechol and hydroxamate groups) and IO NPs were identified as the main reason of enhancing the magnetization effect of IO NPs. These examples have provided new strategies to customize the magnetic properties and MRI performance of MNPs through alternating the chemical structure of surface ligands.
Figure 12.

Anchoring structure and the effect on T1 and T2 relaxivities. (A) Different ligands for surface anchoring of Fe3O4 NPs, including oleic acid (0), oleic acid-soap (1), dopamide-PEG (2), DHB-PEG (3), PO3-PEG (4), CO2-PEG (5), and dopamine (6). (B and C) The M-H curves and transverse relaxivity study of the Fe3O4 NPs with different anchoring molecules. Reprinted with permission from ref. [124]. Copyright 2011, John Wiley & Sons, Inc. (D-F) Chemical structures of PEG with different anchoring groups, TEM images, and digital photos, and the r1 and r2 values of Fe3O4 nanoparticles (3.6 and 10.9 nm in diameter) after surface modification. Reprinted with permission from ref. [125]. Copyright 2014, John Wiley & Sons, Inc.
6.2. Organic polymers
6.2.1. Water diffusivity
For MNPs, polymeric coating on the surface can have profound effect on the relaxivity in MRI. The T2 relaxivity is highly dependent on the interactive behavior between the magnetic field induced by MNPs and the surrounding water molecules. The magnetic field induced by MNPs dramatically decreases with the distance away from the core, which indicates that a dense layer of surface coating of polymers may exclude water molecules from undergoing effective diffusion around the magnetic field. For example, the magnetic field on dextran-coated cross-linked iron oxide (CLIO) nanoparticles, with a core size of 4.35 nm and coating thickness of 10.8 nm, decreases to only 2.3% at the outer surface of the dextran layer.[126] On the other hand, the unique folding and winding structures may result in the decreased diffusion efficiency of water molecules within the polymers, which could be optimized to enhance the T2 relaxivity of MNPs.
The Bao group reported that T2 relaxivity of MNPs is highly related to the surface coating polymers, where the T2 relaxivities of two SPIOs with core sizes of 5 and 14 nm, respectively, and five PEG chain lengths with respective molecular weights of 550, 750, 1000, 2000 and 5000 Da were studied (Fig. 13A).[127] Interestingly, both 5 and 14 nm sized SPIOs have a critical PEG size, at which the T2 relaxivity was significantly different from the others. The highest r2 value (385 ± 39 mM−1s−1) was obtained for SPIOs with a core size of 14 nm and PEG molecular weight of 1000 Da. The correlation between coating thickness of the PEG layer and r2 value of SPIOs were described by the core/shell ratio, assuming that the coating layer was water impermeable. This work indicated that surface coating of PEG layers may immobilize water molecules in a region much larger than that considered by the classical theory.[127] In another work, Monte Carlo simulations suggested that the effect of surface coating thickness on the T2 relaxivity is determined by two competing factors: the physical exclusion of water protons away from MNPs and the increased residence time of water molecules within the polymer layer.[128]
Figure 13.

Organic surface coating effect on T1 and T2 relaxivities. (A) The T2 relaxivity of SPIOs with different sizes and PEG coating on the surface. Reprinted with permission from ref. [127]. Copyright 2010, American Chemical Society. (B and C) Surface modification and the T2 relaxivity study of MNPs using hyperbranched multivalent mPEG-g-PEI and phosphorylated mPEG. Reprinted with permission from ref. [129]. Copyright 2014, John Wiley & Sons, Inc. (D) Optimized binding structure and the binding energy of different monomers for fabricating PEG, PAA, and PEI polymers. (E and F) The relaxivities of NaGdF4 NPs coated with different polymers and dispersed in different medium. Reprinted with permission from ref. [134]. Copyright 2017, American Chemical Society. (G-I) TEM image, T1 relaxivity, and MR phantom of NaGdF4 NCs coated with different polymer ratios. Reprinted with permission from ref. [135]. Copyright 2016, American Chemical Society.
Liu et al. employed hyperbranched polyethylene glycol-g-polyethylenimine (mPEG-g-PEI) polymers to modify MNPs (Fig. 13B).[129] The mPEG-g-PEI polymers are not only water permeable, but also able to hinder the diffusion of water molecules inside the hyperbranched network, compared with phosphorylated mPEG polymers. As a result, mPEG-g-PEI coated spherical MNPs with an average diameter of 6 nm exhibited a remarkably increased r2 value of 331.8 mM−1s−1 at 3 T, which was four times higher than that of mPEG coated MNPs (Fig. 13C).[129] This finding rules out the otherwise predominant contribution of core/shell ratio in T2 relaxivity of MNPs due to the water permeable feature of the mPEG-g-PEI polymers.[129]
Proteins of various forms have also been explored as coating materials for surface modification of MNPs.[7c, 62c, 130] Casein is the main ingredient (∼80%) of bovine milk which belongs to a family of phosphoproteins. IO NPs coated with casein showed a significantly higher r2 value than those coated with synthetic polymers, 273 vs. 109 mM−1s−1, for spherical IO NPs with a diameter of 15 nm measured at 3 T.[131] This result was attributed to the high permeability and affinity of casein to water molecules, which greatly facilitate the access and diffusion of water molecules in the surroundings. Moreover, the hydrated functional groups on casein could enhance the exchange efficiency between hydrated water molecules and bulky ones. More recently, casein coated Fe5C2 nanoparticles showed a strikingly high r2 value of 973 mM−1s−1 for 22 nm sized Fe5C2 nanoparticles measured at 7 T.[132] The content of κ-casein, the most soluble variant of the casein family members, was responsible for the enhanced T2 relaxivity over non-coated nanoparticles.[132]
6.2.2. Water retention
It is generally accepted that T1 relaxivity benefits from direct chemical exchange effect. Due to the tunable molecular weights and chemical properties, polymer coating on the surface of MNPs provides a facile way of enhancing the T1 relaxivity. For example, the T1 relaxivity of Gd-based metal-organic-frameworks (MOF) coated with a range of polymers were studied, including poly[N-(2-hydroxypropyl) methacrylamide (PHPMA), poly(N-isopropylacrylamide) (PNIPAM), and polystyrene (PSty).[133] The T1 relaxivity of the Gd-MOF increased with the molecular weight of hydrophilic polymers (i.e., PHPMA and PNIPAM) on the surface. Compared with unmodified Gd-MOF nanoparticles (r1 = 9.86 mM−1s−1), the PHPMA (molecular weight of 19370 g/mol) coated Gd-MOF nanoparticles exhibited the highest r1 value of 105.36 mM−1s−1 measured at 1.5 T. This may be attributed to the increased water retention within the hydrophilic polymer matrix. The hydrophobic polymer (PSty) on the surface of Gd-MOF significantly decreased the r1 value, while the molecular weight of PSty had minimal impact on the r1 value of the Gd-MOF nanoparticles.[133] In another work, poly(acrylic acid) (PAA) polymers were used to cap small-sized NaGdF4 nanoparticles due to the strong hydrogen bonding capacity. The PAA (molecular weight of 2000 Da) coated 2.1 nm sized NaGdF4 nanoparticles exhibited a high r1 value of 15.5 mM−1s−1 at 0.5 T (Fig. 13D–F).[134]
The distance of water molecules to the surface of MNPs can be customized by controlling the structure of surface coating polymers. For example, PEG-phospholipids (DSPE-PEG) were employed for surface micellization of NaGdF4 nanoparticles (Fig. 13G–I).[135] By tuning the polymer to nanoparticle ratio, the size of NaGdF4 micelles was controlled. The compact micelles showed high r1 value up to ∼80 mM−1s−1 per Gd3+ determined at 1.41 T. Due to the fact that the dipole-dipole interaction between outside water molecules and Gd3+ ions is strongly distance dependent (1/r6), the greatly enhanced T1 relaxivity achieved by compact micelles was thus attributed to the decreased distance from surrounding water molecules to the surface of NaGdF4 nanoparticles.[135–136] Furthermore, the dependency of T1 relaxivity of MNPs on the surface coating structure was also explored as T1 MRI activatable systems for sensing a wide range of biological stimuli, such as pH and enzymes.[137]
6.3. Inorganic layer
6.3.1. Magnetic dilution
The surface of MNPs can be modified with an inorganic layer which can further extend the property and functionality of MNPs. Non-magnetic inorganic materials, such as silica,[138] gold,[139] and metal oxides[99a] have been extensively engineered for theranostics in combination with the intrinsic MRI property of MNPs.[140] However, a dense inorganic layer may compromise the magnetic field induced by MNPs and block the interaction of MNPs with its surroundings. Therefore, it is conceivable that both T1 and T2 relaxivity could decrease in MNPs following coating with a dense inorganic layer on the surface. This phenomenon is often referred to as “magnetic dilution”, which is largely dependent on the coating thickness on MNPs.[141] Thicker coating lead to lower r1 and r2 values.[30] Owing to the advanced synthetic approaches, a wide range of architectures can be obtained through depositing inorganic materials on the surface of MNPs, including core-shell,[141c, 141d, 142] yolk-shell,[143] satellite,[144] and Janus/dumbbell structures.[145] For example, Lin et al. reported a yolk-shell structured magneto-plasmonic hybrid nanoparticle (MPHN) consisting of Fe3O4 core and Au shell with a hollow cavity and pores (Fig. 14A–D).[143a] The unique structural features of MPHNs enable efficient water accessibility to the magnetic core, leading to greatly preserved T2 relaxivity when compared with that of core-shell structures (Fig. 14E and F).[143a]
Figure 14.

Inorganic surface coating effect on T1 and T2 relaxivities. (A-D) TEM images and the simulation of the induced magnetic field distribution of core-shell (E and F) and yolk-shell (I and K) Fe3O4@Au NPs. (L and M) The T1 relaxivity and MR phantom of the core-shell and yolk-shell Fe3O4@Au NPs with Fe3O4 NPs as a control. Reprinted with permission from ref. [143a]. Copyright 2017, John Wiley & Sons, Inc. (G-J) TEM images and r1 and r2 values of IO nanoplates coated with small molecules DMSA or SiO2 layer. Reprinted with permission from ref. [30]. Copyright 2014, American Chemical Society. (K) Scheme of the synthesis of HMnO@mSiO2 NPs. (L and M) TEM and T1 relaxivity of the HMnO@mSiO2 NPs. Reprinted with permission from ref. [138b]. Copyright 2011, American Chemical Society.
Among the various inorganic materials, silica has attracted much attention for surface modification due to the merits of easy functionalization, biological safety, and flexible hierarchical formulations.[146] A dense layer of silica on the surface of magnetite nanoplates significantly reduced the T1 relaxivity (Fig. 14G–J).[30] Specifically, mesoporous silica on the surface of MNPs may permit optimal access of water molecules to the surface, which would boost both the T1 and T2 relaxation enhancement effects. For example, Kim et al. developed mesoporous silica coated hollow manganese oxide (HMnO@mSiO2) nanoparticles which showed much higher r1 values when compared with dense silica or PEG coated HMnO nanoparticles (Fig. 14K–M).[91b] The increased surface area to volume ratio in mesoporous silica facilitated the chemical exchange of water protons near the surface of magnetic centers. Meanwhile, diffusion of water molecules was restricted in the mesoporous framework, which contributed to the effective electronic spin relaxation of water protons, namely the geometrical confinement effect.[147] Similar results have also been reported for Mn ions incorporated mesoporous structures,[138c, 148] manganese oxide encapsulated hybrid silica frameworks,[149] and gadolinium-based mesoporous silica complexes.[147, 150] Moreover, other materials (e.g., zeolites, titania) were also reported as candidates for fabricating magnetic core-porous shell nanoparticles, providing great opportunities to incorporate new functions and applications.[151]
The magnetic field induced by MNPs drops significantly over the distance to the surface. A non-magnetic layer on the surface of MNPs seems unable to alter the magnetic field distribution around the MNPs. However, a water-resistant interlayer situated between the near surface of MNPs and the surrounding water molecules may dilute the effective magnetic field distribution. According to a study on strongly magnetized nanoparticles (τCPΔωr > 1, where τCP is half the echo-time for a single spin-echo sequence, and Δωr is the rms angular frequency shift for a distance at the particle surface), the magnetic field gradients near the surface are too strong to allow efficient refocusing by normal pluses.[11, 37a] This indicates that the spin relaxation near the inner surface of strongly magnetized MNPs is too fast to be detected by MRI setups. Therefore, MNPs coated with a thin inorganic layer may have a negligible impact on T2 relaxivity although the changes in T1 relaxivity may be significant.[30, 141b]
6.3.2. Magnetic coupling
Bi-magnetic core-shell structures may give rise to many useful magnetic coupling effects, such as exchange bias and exchange-spring magnetism.[152] In particular, exchange-coupled MNPs with a magnetically hard core (e.g., CoFe2O4) and soft shell (e.g., MnFe2O4) were developed for highly efficient magnetic hyperthermia therapy.[16b, 153] Among the various bi-magnetic core-shell nanoparticles,[154] the metallic iron core and iron oxide shell (Fe@Fe3O4) nanoparticles have attracted considerable interest for MRI because of practicality and functionality.[99, 155] The outer layer of Fe3O4 shell is designed to prevent the oxidation of inner iron substances and the subsequent loss of magnetic moment, which maintains the Ms and r2 value of Fe@Fe3O4 nanoparticles under ambient conditions. A recent study reported that bi-magnetic Zn0.5Mn0.5Fe2O4@Fe3O4 core-shell nanoparticles showed an outstanding r2 value up to 300 mM−1s−1 at 1.5 T, which was attributed to the presence of magnetically dead layer on the core.[156] Depending on the structural features of the core-shell interface, the presence of “frozen spins” at the interface of bi-magnetic core-shell structures can impact the coercivity (HC) and the exchange-bias field (HE).[157]
The inorganic core-shell structure of bi-magnetic MNPs can be extended to the cases of MNPs decorated with magnetic ions on the surface. The rationale of this combination is that paramagnetic metal ions (e.g., Gd3+, Mn2+) exhibit T1 relaxivity through the facilitated direct chemical exchange with surrounding water molecules, whereas superparamagnetic MNPs show T2 relaxivity mainly through the induced magnetic field. Therefore, it was assumed that MNPs may not lose their T2 relaxivity after being decorated with paramagnetic metal ions; meanwhile, the T1 relaxivity is expected to increase due to the presence of paramagnetic centers on the surface. However, the presence of high T2 decaying effect of the MNP core may affect the T1 relaxivity, which often requires a non-magnetic interlayer (e.g., silica) to dilute the negative impact between the MNP core and surface metal ions. Tuning the distance between the magnetic core and shell can be engineered as an activatable MRI system for sensing pH change (Fig. 15A and B).[158] Moreover, tuning the thickness of the interlayer offers an opportunity to balance the contrast imaging property of these bi-magnetic core-shell structures from being T2 dominant to T1-T2 dual-modal contrast agents (Fig. 15C–G).[141c, 141d] Recently, the phenomenon of distance-dependent magnetic resonance tuning has been developed as an MRI-based ruler for nanometre-scale distance measurement (Fig. 15H–L), providing a valuable tool for detecting molecular interactions (e.g., cleavage, binding, folding and unfolding) in in vitro and in vivo systems.[158–159] Furthermore, the concept of fabricating such core-shell nanoparticles to achieve T1-T2 dual-modal contrasts has been realized in Fe3O4@MnO and Fe3O4@ Gd2O3 nanoparticles.[55, 83a, 160]
Figure 15.

Surface coating of MNPs with magnetic layer and the effect on T1 and T2 relaxivities. (A and B) The paradigm of an activatable T1 contrast probe where the Gd-DTPA complexes are encapsulated in the outer surface layer of IO NPs. Reprinted with permission from ref. [158]. Copyright 2012, American Chemical Society. (C and D) The cartoon model, TEM image, and elemental mapping picture of MNPs coated with SiO2 layer and Mn-MOF on the surface (mAFIA). (E-G) MR phantoms and the T1 and T2 relaxivities of the mAFIA NPs, compared with Magnevist and Feridex. Reprinted with permission from ref. [141c]. Copyright 2014, American Chemical Society. (H) Schematic illustration of distance-dependent magnetic resonance tuning system where the ON and OFF state of the enhancer is dependent on the distance to the quencher. (I-L) The nanoscale ruler and the resultant variation in the T1 MRI relaxation as a function of distance or proton Larmor frequency. Reprinted with permission from ref. [159]. Copyright 2017, Nature Publishing Group.
7. Assembly
Assembly is a phenomenon where the building blocks in a system assemble together to form a larger unit through either spontaneous interactions or external forces.[161] The concept of self-assembly of units at different scales (e.g., molecules, nanoparticles) has gained popularity in chemistry and materials science.[162] MNPs can achieve self-assembly through either surface engineered molecular interactions or externally applied magnets.[163] A variety of assembled structures from single MNPs have also found their unique implications in MRI; that is, the T2 relaxivity of assembled MNPs is greatly enhanced with respect to that of single MNPs.[164] Gillis et al. assumed that a smaller quantity of larger particles provides a greater effect on relaxivity than an abundance of smaller particles with the same mass.[10] However, the underlying mechanism of the enhanced T2 relaxivity upon assembly of MNPs is still unclear and the previous model used in the classical theories seems to be inappropriate to simulate assembled MNPs. The microscopic coupling effect across the interfaced and crystalline coupled nanodomains of MNPs is highly important for attaining collective magnetic properties.[68] In the subsequent sections, we will discuss the factors of assembly state, diffusion coefficient, multi-domain structure, and magnetic field inhomogeneity
7.1. Assembly state
The consideration of assembly state brings two questions to the forefront: (i) what the fraction ratio of MNPs in the assembled structure is; and (ii) what the spatial order of MNPs in the assembled structure is. The first question usually refers to real systems where the assembly is triggered by molecular or biological targets.[165] An increase in concentration of targets leads to higher degrees of assembled MNPs with pre-modified functions (Fig. 16A). Remarkably, the T2 relaxation time of assembled MNPs is linearly correlated with the assembly state in an optimized range,[166] which has motivated the design of numerous magnetic resonance switch systems for sensing a wide range of molecular interactions and biological processes.[3c, 167] Relying on this rationale, diagnostic magnetic resonance (DMR) platform has been developed into easy-to-use sensing system for point-of-care clinical utility (Fig. 16B).[168]
Figure 16.

Assembly state and the effect on T2 relaxivity. (A and B) Illustration of magnetic relaxation switching (MRSw) assay and the changes in NMR signal after the aggregation of MNPs. Reprinted with permission from ref. [168]. Copyright 2012, Ivyspring International Publisher. (C) Schematic illustration of the assembled micelle formation of MNPs. Reprinted with permission from ref. [170c]. Copyright 2005, John Wiley & Sons, Inc. (D and E) The r2 values of SPIO clusters as a function of the cluster size. Reprinted with permission from ref. [54]. Copyright 2012, American Chemical Society. (F and G) The assembly state dependent aggregating architectures of MNPs in the presence of targets. The T2 relaxation time increases in assembled structures and then decreases in clustered structures. Reprinted with permission from ref. [172]. Copyright 2011, American Chemical Society.
The second question arises from artificially engineered self-assembly of MNPs through well-defined molecular or physical interactions between MNPs.[169] For example, during the self-assembly of amphiphilic polymers, hydrophobic MNPs are expected to partition into the hydrophobic core of resultant micelle structures through the universal hydrophobic-hydrophobic interactions (Fig. 16C).[170] Furthermore, surface modification of MNPs with hybrid hydrophobic and hydrophilic polymers leads to controllable self-assembly into vesicular structures with increased complexity and functionality.[171] More importantly, different from target triggered assembly of MNPs, molecularly engineered MNPs may undergo an entropy-driven self-assembly process which leads to a controllable size of the assembled structures.[70a] This allows us to investigate the relationship between the relaxivity and the assembly state of MNPs. The Weller group presented a detailed report on the relaxivities of SPIO-based clusters with narrow size distribution.[54] Tri-block PEI-b-PCL-b-PEG polymers were employed to encapsulate SPIOs of 9.8 nm in diameter, which produced SPIO clusters with various sizes ranging from 51 to 141 nm by DLS measurements (Fig. 16D). The r2 values of the SPIO clusters showed size dependent relationships, which matched well the theoretical concepts of the three regimes (i.e., MAR, SDR, and ELR).[29, 37a] For example, the maximum r2 value reached ~250 mM−1s−1 for clusters with size ~80 nm measured at 1.41 T, which was also the SDR limit of the SPIO-based clusters (Fig. 16E). However, SPIO clusters made from small crystals of 4 nm in diameter showed no SDR in their measurement range (up to 180 nm in hydrodynamic diameter) due to the weak magnetization effect.
Although it is generally accepted that target-induced clustering of MNPs results in a decrease of T2 relaxation time of the system, an opposite phenomenon involving target-induced increase of T2 relaxation time was reported at the initial target-binding step.[172] For example, monovalent targets that bind onto MNPs may not result in clustering of MNPs, where the presence of surface-binding targets on MNPs may prevent water molecules from reaching the proximal MNPs (Fig. 16F and G). A series of model targets, such as small molecules, proteins, and nucleic acid sequences, have been tested on MNPs, and an increased in T2 relaxation time was consistently observed for all samples.[172] The authors thus proposed an extension of outer-sphere relaxation theory to elicit the critical role of molecular architectures resulting from MNPs and model targets.[172–173]
7.2. Diffusion coefficient
The diffusion coefficient of water molecules (Dw) is one of the key parameters in T2 relaxivity of MNPs according to the outer-sphere regime theory. This factor has also been recognized in MNP clusters with enhanced T2 relaxivity. Pothayee et al. found that hydrophilic space between MNPs in clusters is critical in T2 relaxivity.[174] Magnetic block ionomer clusters (MBIClusters) were prepared through chemically conjugating MNPs coated with amino-terminated poly(ethylene oxide-b-acrylate) (H2N-PEO-b-PAA) copolymers (Fig. 17A). The MBIClusters with an estimated intensity average spacing of ~50 nm between MNPs resulted in high r2 value up to 604 mM−1s−1 at 1.4 T, which was attributed to the water penetration behavior within the vicinity of MNPs (Fig. 17B). Paquet et al. reported on hydrophilic hydrogel clusters encapsulated with IO NPs, where the T2 relaxivity was modulated by the coating thickness and the pH-dependent swelling of the surface polymers.[175] Moreover, Monte Carlo simulations showed good agreement between the lower diffusivity of water molecules inside the clusters and the enhanced T2 relaxivity.[175] Interestingly, the water diffusivity mediated T2 relaxivity was also reported in paramagnetic metal complexes encapsulated in hydrophilic polymeric structures.[176]
Figure 17.

Diffusion coefficient and the effect on T1 and T2 relaxivities. (A and B) The MBIClusters with hydrophilic spacing structure and their r1 and r2 values. Reprinted with permission from ref. [174]. Copyright 2013, The Royal Society of Chemistry. (C-E) The structure and the MRI relaxivities of SiMPs and DPNs with porous structure and loaded with 5 nm sized ultrasmall SPIOs. (F and G) Molecular Dynamics simulation for the self-diffusion coefficient of water molecules in a mesopore, indicating that the coefficient reduces as the number of loaded USPIOs increases. Reprinted with permission from ref. [178]. Copyright 2014, John Wiley & Sons, Inc. (H) Scaling behavior of the water diffusion coefficient for different cases. Reprinted with permission from ref. [179]. Copyright 2014, Nature Publishing Group.
Hierarchical structures consisting of an inorganic skeleton and collectively dispersed MNPs have been developed using both porous silica and pore-directed MOFs as matrices.[177] Decuzzi and co-workers reported on sub-micrometer magnetic nanoconstructs by confining ultrasmall 5 nm sized SPIOs into discoidal mesoporous silicon particles or polymeric structures (Fig. 17C and D).[178] Through the confinement effect within the porous matrices, the r2 value of the original ultrasmall SPIOs increased from 107 ± 24 to 270 ± 73 and 835 ± 63 mM−1s−1 for the obtained silicon particles and polymeric structures, respectively (Fig. 17E). The molecular dynamics (MD) simulation further predicted that the decreased diffusion coefficient of water molecules in the geometrically confined structures played a critical role in boosting the T2 relaxivity in MRI (Fig. 17F and G).[178] The water diffusion in nano-confined geometries is different from that in the bulk phase. Chiavazzo et al. further showed that the diffusion coefficient of water molecules can be scaled linearly through a single parameter θ as follows: D(θ)=DB[1+(DC/DB−1)θ], where DB and DC are the diffusion coefficient of bulk and totally confined water molecules, respectively (Fig. 17H).[179] To examine practicality, silicon particles with different levels of SPIO loading were computed and the average relaxivity enhancement was ~2.7, which was in excellent agreement with the experimental value of ~2.52. In addition, core-shell magnetic MOFs with incorporated MNPs have been widely developed as multifunctional platforms for theranostic applications where the enhanced T2 relaxivity is due to a similar mechanism regarding water diffusivity inside the cavity of MOFs.[180]
7.3. Multi-domain structure
Single-domain MNPs are defined by the linear response theory, whereby the magnetizing effect of MNPs is primarily associated with the Néel fluctuations of magnetic spins within the crystal.[181] Typically, IO NPs have a critical size threshold on the order of about 100 nm for the formation of multi-domain structure depending on crystallinity and morphology.[182] In other words, IO NPs larger than the critical size threshold may contain multiple domains inside the crystals. The presence of domain boundaries within multi-domain MNPs separates the spin collections between each domain. Therefore, it is essential to know how the domain structure impacts the MRI relaxivity of multi-domain MNPs.[183] The strategies of synthesizing MNPs with controllable architectures are described in literature.[12a, 184]
Lartigue et al. reported a multi-core maghemite nanoparticle through a polyol-based synthetic procedure and the T2 relaxivity was systematically studied.[185] In this case, the collective dipole-dipole interaction in the multi-core nanoparticles was strikingly different from the matrix-embedded clusters in which the emergent magnetic behavior was dominated by dipole-dipole interactions between different particles. The magnetically cooperative multi-core nanoparticles showed enhanced magnetic susceptibility and decreased surface disorder compared with individuals while preserving their superparamagnetic-like behavior. The enhanced r1 and r2 values for the multi-core nanoparticles were ascribed to the optimized magnetic dynamics, for example, blocking the Néel fluctuations due to the local magnetocrystalline field.[185–186] In other words, the detrimental role of magnetic spin fluctuation that could average out the nuclear relaxation is suppressed in the cooperative multi-core structure, which benefits both T1 and T2 relaxivities. The Chen group further showed that polyvinylpyrrolidone (PVP)-coated IO NPs with sizes of 2, 23, 37, and 65 nm can be synthesized by a simple one-pot pyrolysis method.[187] The r2 values were positively correlated with the size of PVP-IO NPs. However, only a slight difference between that of PVP-IO-37 and PVP-IO-65 NPs was observed, 239.98 vs. 248.89 mM−1s−1 at 7 T, indicating the presence of an SDR limit in the multi-domain MNPs.[187] Furthermore, the PVP-IO-37 NPs exhibited the greatest enhancement in liver contrast due to the optimal cellular uptake rate and biodistribution.
More examples of assembled MNPs with inter-particle coalesced domain structures can be found in the literature.[188] It is noteworthy that the aggregation-based growth of MNP clusters may involve the oriented crystallographic coalescence of single-domain MNPs within clusters.[46c, 189] Therefore, a high-volume fraction is expected in such MNP clusters which may exhibit collective magnetic behavior due to the inter-particle interactions involving superspin (for single-domain MNPs) dipolar and surface-spin exchange interactions. Kostopoulou et al. employed scaling-law analysis and Monte Carlo simulations to decipher the dipolar interactions within colloidal nanoclusters of maghemite, demonstrating a strong correlation between the volume fraction and the emergent spin-glass dynamics.[190] The physical interactions of particles within clustering structures were described elsewhere,[191] where the presence of dipolar and exchange coupling effect needs to be carefully examined.
7.4. Magnetic field inhomogeneity
In MRI, a static magnetic field is required to polarize the magnetic nuclei of samples for signal acquisition. Although MRI manufacturers strive to produce uniform magnetic field, current MRI techniques still suffer from the intrinsic defects of the applied magnet which give rise to the T2* decay of the samples. A general solution is to deploy a spin-echo array to refocus the strong T2* decay caused by the machine itself, which is usually an order-of-magnitude faster than the normal T2 decay caused by atomic and molecular mechanisms in most samples.[192] The emergent magnetic exchange coupling effect upon clustering of MNPs may greatly increase the level of magnetic field inhomogeneity, enhancing the T2 relaxivity in assembled MNPs.
Recently, Zhou et al. reported that the concept of magnetic field inhomogeneity is generalizable from single MNPs to MNP clusters (Fig. 18A).[193] To test this hypothesis, IO clusters consisting of multiple components of IO NPs with different sizes and shapes were fabricated through a controllable self-assembly process. The artificially enhanced local magnetic field inhomogeneity in the multi-component IO clusters showed enhanced T2 relaxivity compared to those of single-component IO clusters (Fig. 18B–D). For example, IO NPs of 5 and 15 nm in diameter were used to produce IO clusters C1, C2, and C3 which consisted of IO-5 NPs only, IO-15 NPs only, and mixed IO-5 and IO-15 NPs, respectively. The r2 values of C1 and C2 were 231.6 ± 9.3 and 358.3 ± 14.2 mM−1s−1, respectively, and increased to 533.4 ± 13.2 mM−1s−1 for C3 at 7 T (Fig. 18E and F). The Landau-Lifshitz-Gilbert simulations were used to decipher the magnetic field distribution around MNPs of different models (Fig. 18G–J). The calculation results showed that the stray field gradient in the C3 model was the largest, which agreed with the enhanced r2 value of the C3 clusters (Fig. 18K and L). In addition, the concept of artificially engineering magnetic field inhomogeneity to enhance T2 relaxivity of IO clusters was further confirmed in IO clusters consisting of IO NPs with shape anisotropy (i.e., cubes and plates). This study shed light on interpreting the relationship between the T2 relaxivity and the magnetic field inhomogeneity induced by MNPs, especially in MNP clusters.[193–194] Previously, Mikhaylov et al. reported that ferri-liposomes consisting of spherical IO NPs with widely dispersed diameters (i.e., ranging from 3 to 14 nm) exhibited ultrahigh r2 value up to 1286 mM−1s−1 by an unknown mechanism.[195] We speculate that this result may be a consequence of enhanced magnetic field inhomogeneity derived from the large size deviations of IO NPs used for fabricating the ferri-liposomes.
Figure 18.

Magnetic field inhomogeneity and the effect on T2 relaxivity. (A) Water proton diffusion and dephasing phenomena around single MNPs and MNP clusters with magnetic coupling. (B-F) TEM and HRTEM images, schematic models, r2 values, and T2 MR phantoms of IO clusters with different components. (G-L) Landau-Lifshitz-Gilbert simulations maps, the stray field and the stray field gradient of different IO cluster models, indicating strong correlation between r2 values and the induced magnetic field inhomogeneity of the IO cluster samples. Reprinted with permission from ref. [193]. Copyright 2017, Nature Publishing Group.
8. Conclusion and perspective
MNPs with diversified structural characteristics have pushed the frontier for high-performance MRI contrast agents. With increased complexity of modern MNPs, more and more unique relaxation enhancement effects in MRI have been discovered. However, the classical theories established on simplified models have been insufficient to decipher those new mechanisms. In this review, we have elaborated on the classical theories regarding the physical explanations of MRI contrast enhancement and discussed major parameters which could influence the MRI relaxivity. It is worth noting that some parameters, such as the size and magnetic moment, have been described in the classical theories. By surveying the literature, we have covered a variety of structural features of MNPs, including size, shape, crystal structure, surface modification, and assembled structure, and outlined their structure-relaxivity relationships of MNPs in MRI. Moreover, the potential gap between the classical theories and novel relaxation enhancement phenomena of MNPs was discussed for each section.
To summarize: (i) size effect on the relaxivity of MNPs is multi-fold: larger size is associated with a larger area influenced by the induced magnetic field, leading to higher r2 value. Meanwhile, the magnetization effect is also positively correlated with the size of MNPs. Therefore, increasing size of MNPs would collectively enhance the T2 relaxivity which is consistent with the classical outer-sphere mechanism. On the contrary, small-sized MNPs with elevated surface-to-volume ratio and prominent paramagnetism may become T1 dominated contrast agents, which also benefit from the diminished T2 relaxivity. (ii) Shape effect is an important parameter for tuning the T1 and T2 relaxivities of MNPs. In general, nonspherical shape leads to larger effective radius for MNPs with respect to equivalent spherical particles, resulting in enhanced T2 relaxivity. In addition, a case study of star-shaped MNPs with high T1 relaxivity may be due to shape regulated elevation of second-sphere contributions. (iii) Crystal structure governs the crystallinity and therefore the magnetization effect of MNPs. This has been previously described in the classical theories for T2 relaxivity. On the other hand, surface structure of MNPs and surface coordination chemistry of water molecules on MNPs are associated with the T1 relaxivity, where generalizing the inner-sphere theory from a chemical exchange model of paramagnetic metal ions to superparamagnetic MNPs is pivotal. (iv) Surface modification of MNPs with either magnetic/non-magnetic or inorganic/organic layer give rise to extra parameters in evaluating the T1 and T2 relaxivities, including magnetic coupling effect within MNPs and diffusion behavior of water molecules in the vicinity of MNPs. (v) Assembly of MNPs from single particles to clustered structures is a simple yet highly effective approach to enhance T2 relaxivity of MNPs. This phenomenon has been demonstrated in many systems where the T2 relaxivity was correlated with the diffusion behavior of water molecules around the magnetic clusters (i.e., MAR, SDR, and ELR). We have summarized four factors derived from the diffusion behavior of water molecules and the magnetic field distribution around MNPs, including assembly state, diffusion coefficient, multi-domain structure, and local magnetic field inhomogeneity.
Despite the tremendous technological advances in the synthesis of MNPs, the bottom-up approach of designing novel MRI contrast agents is still limited in molecular based magnetic materials. One of the major obstacles of studying MNPs is the inability to control the structural features in a well-defined manner. For example, increasing size of MNPs would also increase the saturated magnetization, which complicates the investigation of MRI contrast enhancement when one tries to study individual variables of a system. This situation becomes more awkward when synthesizing critically large sized MNPs with multiple crystal phases and multi-domain structures. Aside from the synthetic part, surface modification of MNPs of different sizes also leads to variable surface coating densities which could become an influencing factor when dealing with the MRI contrast enhancement effect. In our surveyed publications, only a handful of publications claimed single variable parameter for studying relaxation enhancement effect in their work. We highlight those with clearly announced novel mechanism relating to the enhancement of T1 or T2 relaxivities in MRI (Tables 1 and 2). Studied that reported high T1 or T2 relaxivity values but lacked a clear variable parameter were not included in the Tables, which might on the other way encourage further investigations on those systems.
Table 1.
Summary of MNPs with representative mechanisms for T1 relaxivity.
| MNPs | r1 (mM−1s−1) | Field | Mechanism | Reference | |
|---|---|---|---|---|---|
| IO NPs, 3 nm | 4.78 | 3.0 T | size, paramagnetism | 57 | |
| IO NPs, 18 nm | 615 | 0.13 mT | ultra-low field | 66 | |
| Au stars@Gd | 54.7 | 1.5 T | second-sphere contribution | 84 | |
| IO nanoplates | 43.18 | 0.5 T | metal-rich surface | 30 | |
| MnO plates | 2.06 | 3.0 T | surface passivated Mn3+ | 59c | |
| α-FeOOH | 4.03 | 4.7 T | antiferromagnetism | 102a | |
| Gd2O3 plates | 14.5 | 0.5 T | water-bridge coordination | 114 | |
| NaxGdWO3 | 32.1 | 3.0 T | surface oxygen vacancy | 119 | |
| Gd-MOF | 105.36 | 1.5 T | optimized water retention | 133 | |
| HMnO@SiO2 | 0.99 | 11.7 | restricted water diffusion | 91b | |
Table 2.
Summary of MNPs with representative mechanisms for T2 relaxivity.
| MNPs | r2 (mM−1s−1) | Field | Mechanism | Reference | |
|---|---|---|---|---|---|
| IO NPs | N.A. | 1.5 T | size, magnetization | 51 | |
| IO cubes | 761 | 3.0 T | shape, SDR threshold | 46a | |
| IO octapods | 679.3 | 7.0 T | shape, effective radius | 46b | |
| Fe@Fe3O4 | 324 | 1.5 T | high magnetization | 99a | |
| SAF-NPs | 355 | 9.4 T | antiferromagnetic coupling | 103 | |
| MnFe2O4 | 358 | 1.5 T | high magnetization, composition | 105b | |
| IO NPs, 3.6 nm | 48.8 | 3.0 T | surface anchoring ligand | 125 | |
| IO NPs, 14 nm | 385 | 7.0 T | water permeability | 127 | |
| MBIClusters | 604 | 1.4 T | water penetration and diffusion | 174 | |
| Multi-core NPs | 365 | 0.25 T | optimized magnetic dynamics | 185 | |
| IO clusters | 533.4 | 7.0 T | local field inhomogeneity | 193 | |
In the end, investigation of the structure-relaxivity relationships holds great promise for guiding the design of MNPs as high-performance MRI contrast agents and for unveiling the fundamental basis of novel phenomenon of relaxation enhancement by MNPs in MRI. Although it is still challenging to incorporate all the parameters derived from different MNPs into a single theory, which will require multi-disciplinary cooperation from materials scientists, chemists, physicists, and mathematicians, we hope this review is timely to shed light on the understanding of equivocal MRI relaxation enhancement effect by MNPs with diversified structural features. Ultimately, the fundamental analysis of the structure-relaxivity relationships of MNPs in MRI may open up new avenues to innovate sophisticated MNPs for magnetism mediated applications.
Acknowledgements
This work was partially supported by the National Science Foundation of China (81601489, 21771148, 21521004, and 81430041), and by the Intramural Research Program (IRP), National Institute of Biomedical Imaging and Bioengineering (NIBIB), National Institutes of Health (NIH). We cordially acknowledge Dr. Joseph Lau and Dr. Bryant C. Yung for proofreading the manuscript.
Biographies

Zijian Zhou received his PhD in Chemistry (Chemical Biology) from the Xiamen University in 2015. Then he joined the Laboratory of Molecular Imaging and Nanomedicine (LOMIN), National Institute of Biomedical Imaging and Bioengineering (NIBIB) at the National Institutes of Health (NIH), as a postdoctoral fellow. His research interest is cancer nanomedicine including novel imaging agents and strategies for cancer diagnosis, molecular imaging of cancer therapeutic response, and activatable systems for cancer theranostics.

Jinhao Gao obtained his BSc from the Nanjing University in 2004 and his PhD at the Hong Kong University of Science and Technology (HKUST) in 2008. He was a postdoctoral fellow at Stanford University from 2008 to 2010. He is now a Professor of Chemistry at the Xiamen University, China. His main research interests include chemical biology, nanochemistry, MRI contrast agents, molecular imaging, and cancer therapy.

Xiaoyuan (Shawn) Chen received his PhD in Chemistry from the University of Idaho in 1999. He joined the University of Southern California as an Assistant Professor of Radiology in 2002. He then moved to Stanford University in 2004 and was promoted to Associate Professor in 2008. In the summer of 2009, he joined the Intramural Research Program of the NIBIB as a tenured Senior Investigator and Chief of the LOMIN. He is the founding editor-in-chief of the journal Theranostics. He is interested in developing molecular imaging tools for the early diagnosis of disease, monitoring therapy response, and guiding nanodrug discovery/development.
References
- [1].a) Ding S, Yi J, Li J, Ren B, Wu D, Panneerselvam R, Tian Z, Nat. Rev. Mater 2016, 1, 16021; [Google Scholar]; b) M. Luo, S. Guo, Nat. Rev. Mater 2017, 2, 17059; [Google Scholar]; c) N. Karousis I. Suarez-Martinez, C. P. Ewels, N. Tagmatarchis, Chem. Rev 2016, 116, 4850;27074223 [Google Scholar]; d) M. Elsabahy, K. L. Wooley, Chem. Soc. Rev 2012, 41, 2545;22334259 [Google Scholar]; e) R. Liu, H. Y. Zhang, Z. X. Ji, R. Rallo, T. Xia, C. H. Chang, A. Nel, Y. Cohen, Nanoscale 2013, 5, 5644.23689214 [Google Scholar]
- [2].a) Cao X, Tan C, Sindoro M, Zhang H, Chem. Soc. Rev 2017, 46, 2660; [DOI] [PubMed] [Google Scholar]; b) Zhang Y, Hsu BYW, Ren C, Li X, Wang J, Chem. Soc. Rev 2015, 44, 315; [DOI] [PubMed] [Google Scholar]; c) Agranovich VM, Gartstein YN, Litinskaya M, Chem. Rev 2011, 111, 5179; [DOI] [PubMed] [Google Scholar]; d) Kuang Q, Wang X, Jiang Z, Xie Z, Zheng L, Acc. Chem. Res 2013, 47, 308. [DOI] [PubMed] [Google Scholar]
- [3].a) Mosayebi J, Kiyasatfar M, Laurent S, Adv. Healthc. Mater 2017, 6, 201700306; [DOI] [PubMed] [Google Scholar]; b) Revia RA, Zhang M, Mater. Today 2016, 19, 157; [DOI] [PMC free article] [PubMed] [Google Scholar]; c) Lee H, Shin T-H, Cheon J, Weissleder R, Chem. Rev 2015, 115, 10690; [DOI] [PMC free article] [PubMed] [Google Scholar]; d) Lee N, Yoo D, Ling D, Cho MH, Hyeon T, Cheon J, Chem. Rev 2015, 115, 10637; [DOI] [PubMed] [Google Scholar]; e) Reddy LH, Arias JL, Nicolas J, Couvreur P, Chem. Rev 2012, 112, 5818; [DOI] [PubMed] [Google Scholar]; f) Gao JH, Gu HW, Xu B, Acc. Chem. Res 2009, 42, 1097; [DOI] [PubMed] [Google Scholar]; g) Gallo J, Long NJ, Aboagye EO, Chem. Soc. Rev 2013, 42, 7816. [DOI] [PubMed] [Google Scholar]
- [4].a) Wu L Mendoza-Garcia A, Li Q, Sun S, Chem. Rev 2016, 116, 10473; [DOI] [PubMed] [Google Scholar]; b) Wu W, Jiang CZ, Roy VAL, Nanoscale 2016, 8, 19421; [DOI] [PubMed] [Google Scholar]; c) Lu AH, Salabas EL, Schuth F, Angew. Chem. Int. Ed 2007, 46, 1222. [DOI] [PubMed] [Google Scholar]
- [5].Laurent S, Forge D, Port M, Roch A, Robic C, Vander Elst L, Muller RN, Chem. Rev 2008, 108, 2064. [DOI] [PubMed] [Google Scholar]
- [6].Gubin SP, Koksharov YA, Khomutov G, Yurkov G. Y. e., Russ. Chem. Rev 2005, 74, 489. [Google Scholar]
- [7].a) Ulbrich K, Holá K, Šubr V, Bakandritsos A, Tuček J, Zbořil R, Chem. Rev 2016, 116, 5338; [DOI] [PubMed] [Google Scholar]; b) Colombo M Carregal-Romero S, Casula MF, Gutiérrez L, Morales MP, Böhm IB, Heverhagen JT, Prosperi D, Parak WJ, Chem. Soc. Rev 2012, 41, 4306; [DOI] [PubMed] [Google Scholar]; c) Pan Y, Du X, Zhao F, Xu B, Chem. Soc. Rev 2012, 41, 2912. [DOI] [PubMed] [Google Scholar]
- [8].Zhou Z, Chen X, in Magnetic Nanomaterials: Fundamentals, Synthesis and Applications, Wiley-VCH Verlag GmbH & Co. KGaA, 2017, 365. [Google Scholar]
- [9].a) Villaraza AJ, Bumb A, Brechbiel MW, Chem. Rev 2010, 110, 2921; [DOI] [PMC free article] [PubMed] [Google Scholar]; b) Shin T-H, Choi Y, Kim S, Cheon J, Chem. Soc. Rev 2015, 4501; [DOI] [PubMed] [Google Scholar]; c) Pablico-Lansigan MH, Situ SF, Samia ACS, Nanoscale 2013, 5, 4040. [DOI] [PubMed] [Google Scholar]
- [10].Gillis P, Koenig SH, Magnet. Reson. Med 1987, 5, 323. [DOI] [PubMed] [Google Scholar]
- [11].Roch A, Muller RN, Gillis P, J. Chem. Phys 1999, 110, 5403. [Google Scholar]
- [12].a) Deng H, Li X, Peng Q, Wang X, Chen J, Li Y, Angew. Chem. Int. Ed 2005, 44, 2782; [DOI] [PubMed] [Google Scholar]; b) Park J, Joo J, Kwon SG, Jang Y, Hyeon T, Angew. Chem. Int. Ed 2007, 46, 4630; [DOI] [PubMed] [Google Scholar]; c) Bao N, Shen L, Wang Y-HA, Ma J, Mazumdar D, Gupta A, J. Am. Chem. Soc 2009, 131, 12900. [DOI] [PubMed] [Google Scholar]
- [13].Sugimoto T, Matijević E, J. Colloid Interface Sci 1980, 74, 227. [Google Scholar]
- [14].Xia Y, Angew. Chem. Int. Ed 2014, 53, 12268. [DOI] [PubMed] [Google Scholar]
- [15].a) Kim BH, Hackett MJ, Park J, Hyeon T, Chem. Mater 2013, 26, 59; [Google Scholar]; b) Chinnasamy CN, Jeyadevan B, Shinoda K, Tohji K, Djayaprawira DJ, Takahashi M, Joseyphus RJ, Narayanasamy A, Appl. Phys. Lett 2003, 83, 2862. [Google Scholar]
- [16].a) Salazar-Alvarez G, Qin J, Šepelák V, Bergmann I, Vasilakaki M, Trohidou KN, Ardisson JD, Macedo WAA, Mikhaylova M, Muhammed M, Baró MD, Nogués J, J. Am. Chem. Soc 2008, 130, 13234; [DOI] [PubMed] [Google Scholar]; b) Noh S.-h., Na W, Jang J.-t., Lee J-H, Lee EJ, Moon SH, Lim Y, Shin J-S, Cheon J, Nano Lett 2012, 12, 3716. [DOI] [PubMed] [Google Scholar]
- [17].Lévy M, Gazeau F, Wilhelm C, Neveu S, Devaud M, Levitz P, J. Phys. Chem. C 2013, 117, 15369. [Google Scholar]
- [18].a) Peng E, Wang F, Xue JM, J. Mater. Chem. B 2015, 3, 2241; [DOI] [PubMed] [Google Scholar]; b) Gao Z, Ma T, Zhao E, Docter D, Yang W, Stauber RH, Gao M, Small 2016, 12, 556; [DOI] [PubMed] [Google Scholar]; c) Huang J, Zhong X, Wang L, Yang L, Mao H, Theranostics 2012, 2, 86; [DOI] [PMC free article] [PubMed] [Google Scholar]; d) Shen Z, Wu A, Chen X, Mol. Pharm 2017, 14, 1352. [DOI] [PubMed] [Google Scholar]
- [19].Caravan P, Zhang Z, Eur. J. Inorg. Chem 2012, 2012, 1916. [DOI] [PMC free article] [PubMed] [Google Scholar]
- [20].a) Lauffer RB, Chem. Rev 1987, 87, 901; [Google Scholar]; b) Koenig SH, Kellar KE, Magnet. Reson. Med 1995, 34, 227. [DOI] [PubMed] [Google Scholar]
- [21].a) Solomon I, Phys. Rev 1955, 99, 559; [Google Scholar]; b) Bloembergen N, Morgan LO, J. Chem. Phys 1961, 34, 842; [Google Scholar]; c) Hwang LP, Freed JH, J. Chem. Phys 1975, 63, 4017; [Google Scholar]; d) Freed JH, J. Chem. Phys 1978, 68, 4034. [Google Scholar]
- [22].a) Bloch F, Phys. Rev 1946, 70, 460; [Google Scholar]; b) Purcell E, Torrey H, Pound R, Phys. Rev. B 1946, 69, 37. [Google Scholar]
- [23].a) Vuong QL, Gillis P, Roch A, Gossuin Y, Wiley Interdiscip. Rev. Nanomed. Nanobiotechnol 2017, 9, doi: 10.1002/wnan.1468; [DOI] [PubMed] [Google Scholar]; b) Gossuin Y, Orlando T, Basini M, Henrard D, Lascialfari A, Mattea C, Stapf S, Vuong QL, Nanotechnology 2016, 27, 155706. [DOI] [PubMed] [Google Scholar]
- [24].Bloembergen N, Purcell EM, Pound RV, Phys. Rev 1948, 73, 679. [Google Scholar]
- [25].Werbelow LG, Grant DM, in Advances in Magnetic and Optical Resonance, Vol. 9 (Ed: Waugh JS), Academic Press, 1977, 189. [Google Scholar]
- [26].a) Caravan P, Ellison JJ, McMurry TJ, Lauffer RB, Chem. Rev 1999, 99, 2293; [DOI] [PubMed] [Google Scholar]; b) Caravan P, Chem. Soc. Rev 2006, 35, 512. [DOI] [PubMed] [Google Scholar]
- [27].Edzes HT, Samulski ET, Nature 1977, 265, 521. [DOI] [PubMed] [Google Scholar]
- [28].Wood ML, Hardy PA, J. Magn. Reson. Imaging 1993, 3, 149. [DOI] [PubMed] [Google Scholar]
- [29].Brooks RA, Moiny F, Gillis P, Magnet. Reson. Med 2001, 45, 1014. [DOI] [PubMed] [Google Scholar]
- [30].Zhou Z, Zhao Z, Zhang H, Wang Z, Chen X, Wang R, Chen Z, Gao J, ACS Nano 2014, 8, 7976. [DOI] [PMC free article] [PubMed] [Google Scholar]
- [31].Pierre VC, Harris SM, Pailloux SL, Acc. Chem. Res 2018, DOI: 10.1021/acs.accounts.7b00301. [DOI] [PubMed] [Google Scholar]
- [32].Bleuzen A, Foglia F, Furet E, Helm L, Merbach AE, Weber J, J. Am. Chem. Soc 1996, 118, 12777. [Google Scholar]
- [33].a) Eaton DR, Can. J. Chem 1969, 47, 2645; [Google Scholar]; b) Lebduskova P, Hermann P, Helm L, Toth E, Kotek J, Binnemans K, Rudovsky J, Lukes I, A. E. Merbach, Dalton. Trans. 2007, 493. [DOI] [PubMed] [Google Scholar]
- [34].Chen JW, Belford RL, Clarkson RB, J. Phys. Chem. A 1998, 102, 2117. [Google Scholar]
- [35].Bonnet CS, Fries PH, Crouzy S, Delangle P, J. Phys. Chem. B 2010, 114, 8770. [DOI] [PubMed] [Google Scholar]
- [36].a) Borel A, Helm L, Merbach AE, Chem. Eur. J 2001, 7, 600; [DOI] [PubMed] [Google Scholar]; b) Kruk D, Nilsson T, Kowalewski J, Mol. Phys 2001, 99, 1435. [Google Scholar]
- [37].a) Gillis P, Moiny F, Brooks RA, Magnet. Reson. Med 2002, 47, 257; [DOI] [PubMed] [Google Scholar]; b) Brooks RA, Magn. Reson. Med 2002, 47, 388. [DOI] [PubMed] [Google Scholar]
- [38].de Haan HW, Magnet. Reson. Med 2011, 66, 1748. [DOI] [PubMed] [Google Scholar]
- [39].Yablonskiy DA, Haacke EM, Magnet. Reson. Med 1994, 32, 749. [DOI] [PubMed] [Google Scholar]
- [40].a) Vuong QL, Berret JF, Fresnais J, Gossuin Y, Sandre O, Adv. Healthc. Mater 2012, 1, 502; [DOI] [PubMed] [Google Scholar]; b) Vuong QL, Gillis P, Gossuin Y, J. Magn. Reson 2011, 212, 139. [DOI] [PubMed] [Google Scholar]
- [41].Roch A, Gossuin Y, Muller RN, Gillis P, J. Magn. Magn. Mater 2005, 293, 532. [Google Scholar]
- [42].a) Balasubramaniam S, Kayandan S, Lin Y-N, Kelly DF, House MJ, Woodward RC, St. Pierre TG, Riffle JS, Davis RM, Langmuir 2014, 30, 1580; [DOI] [PubMed] [Google Scholar]; b) Carroll MRJ, Robert CW, Michael JH, Wey Yang T, Rose A, Tracey LH, Timothy GSP, Nanotechnology 2010, 21, 035103.19966406 [Google Scholar]
- [43].Sharp RR, J. Chem. Phys 1990, 93, 6921. [Google Scholar]
- [44].a) Sharp RR, J. Chem. Phys 1993, 98, 912; [Google Scholar]; b) Miller J, Abernathy S, Sharp R, J. Phys. Chem. A 2000, 104, 4839. [Google Scholar]
- [45].Schabes ME, Bertram HN, J. Appl. Phys 1988, 64, 1347. [Google Scholar]
- [46].a) Lee N, Choi Y, Lee Y, Park M, Moon WK, Choi SH, Hyeon T, Nano Lett 2012, 12, 3127; [DOI] [PubMed] [Google Scholar]; b) Zhao Z, Zhou Z, Bao J, Wang Z, Hu J, Chi X, Ni K, Wang R, Chen X, Chen Z, Gao J, Nat. Commun 2013, 4, 2266; [DOI] [PubMed] [Google Scholar]; c) Zhou Z, Zhu X, Wu D, Chen Q, Huang D, Sun C, Xin J, Ni K, Gao J, Chem. Mater 2015, 27, 3505; [Google Scholar]; d) Pradeep SL Wyss P, Rauber Martin, Thomann Ralf, Krämer Karl W. & Shastri V Prasad, Nanomedicine 2016, 11, 1017; [DOI] [PubMed] [Google Scholar]; e) Yang L, Wang Z, Ma L, Li A, Xin J, Wei R, Lin H, Wang R, Chen Z, Gao J, ACS Nano 2018, 12, 4605. [DOI] [PubMed] [Google Scholar]
- [47].a) Upadhyay S, Parekh K, Pandey B, J. Alloy. Compd 2016, 678, 478; [Google Scholar]; b) Lee J. Sung, Cha J. Myung, Yoon H. Young, Lee J-K, Kim Y. Keun, Sci. Rep 2015, 5, 12135;26183842 [Google Scholar]; c) Yoo K, Jeon B-G, Chun SH, Patil DR, Lim Y.-j., Noh S.-h., Gil J, Cheon J, Kim KH, Nano Lett 2016, 16, 7408; [DOI] [PubMed] [Google Scholar]; d) Li Q, Kartikowati CW, Horie S, Ogi T, Iwaki T, Okuyama K, Sci. Rep 2017, 7, 9894. [DOI] [PMC free article] [PubMed] [Google Scholar]
- [48].Smolensky ED, Park H-YE, Zhou Y, Rolla GA, Marjanska M, Botta M, Pierre VC, J. Mater. Chem. B 2013, 1, 2818. [DOI] [PMC free article] [PubMed] [Google Scholar]
- [49].Han DH, Wang JP, Luo HL, J. Magn. Magn. Mater 1994, 136, 176. [Google Scholar]
- [50].a) Pankhurst Q, Pollard R, Phys. Rev. Lett 1991, 67, 248; [DOI] [PubMed] [Google Scholar]; b) Linderoth S, Hendriksen PV, Bødker F, Wells S, Davies K, Charles SW, Mørup S, J. Appl. Phys 1994, 75, 6583. [Google Scholar]
- [51].Jun YW, Huh Y-M, Choi J.-s., Lee J-H, Song H-T, KimKim, Yoon S, Kim K-S, Shin J-S, Suh J-S, Cheon J, J. Am. Chem. Soc 2005, 127, 5732. [DOI] [PubMed] [Google Scholar]
- [52].a) Tromsdorf UI, Bigall NC, Kaul MG, Bruns OT, Nikolic MS, Mollwitz B, Sperling RA, Reimer R, Hohenberg H, Parak WJ, Förster S, Beisiegel U, Adam G, Weller H, Nano Lett 2007, 7, 2422; [DOI] [PubMed] [Google Scholar]; b) Seo WS, Lee JH, Sun X, Suzuki Y, Mann D, Liu Z, Terashima M, Yang PC, McConnell MV, Nishimura DG, Dai H, Nat. Mater 2006, 5, 971; [DOI] [PubMed] [Google Scholar]; c) Zhou Z, Wang L, Chi X, Bao J, Yang L, Zhao W, Chen Z, Wang X, Chen X, Gao J, ACS Nano 2013, 7, 3287; [DOI] [PMC free article] [PubMed] [Google Scholar]; d) Huang G, Li H, Chen J, Zhao Z, Yang L, Chi X, Chen Z, Wang X, Gao J, Nanoscale 2014, 6, 10404; [DOI] [PubMed] [Google Scholar]; e) Yang L, Zhou Z, Liu H, Wu C, Zhang H, Huang G, Ai H, Gao J, Nanoscale 2015, 7, 6843. [DOI] [PubMed] [Google Scholar]
- [53].Das GK, Johnson NJJ, Cramen J, Blasiak B, Latta P, Tomanek B, van Veggel FCJM, J. Phys. Chem . Lett. 2012, 3, 524. [DOI] [PubMed] [Google Scholar]
- [54].Pöselt E, Kloust H, Tromsdorf U, Janschel M, Hahn C, Maßlo C, Weller H, ACS Nano 2012, 6, 1619. [DOI] [PubMed] [Google Scholar]
- [55].Zhou Z, Bai R, Munasinghe J, Shen Z, Nie L, Chen X, ACS Nano 2017, 11, 5227. [DOI] [PMC free article] [PubMed] [Google Scholar]
- [56].a) Neuwelt EA, Hamilton BE, Varallyay CG, Rooney WR, Edelman RD, Jacobs PM, Watnick SG, Kidney Int 2008, 75, 465; [DOI] [PMC free article] [PubMed] [Google Scholar]; b) Taboada E, Rodriguez E, Roig A, Oro J, Roch A, Muller RN, Langmuir 2007, 23, 4583. [DOI] [PubMed] [Google Scholar]
- [57].Kim BH, Lee N, Kim H, An K, Park YI, Choi Y, Shin K, Lee Y, Kwon SG, Na HB, Park J-G, Ahn T-Y, Kim Y-W, Moon WK, Choi SH, Hyeon T, J. Am. Chem. Soc 2011, 133, 12624. [DOI] [PubMed] [Google Scholar]
- [58].Lu Y, Xu Y-J, G.-b. Zhang, D. Ling, M.-q. Wang, Y. Zhou, Y.-D. Wu, T. Wu, M. J. Hackett, B. Hyo Kim, H. Chang, J. Kim, X.-T. Hu, L. Dong, N. Lee, F. Li, J.-C. He, L. Zhang, H.-Q. Wen, B. Yang, S. Hong Choi, T. Hyeon, D.-H. Zou, Nat. Biomed. Eng 2017, 1, 637. [DOI] [PubMed] [Google Scholar]
- [59].a) Na HB, Lee JH, An K, Park YI, Park M, Lee IS, Nam DH, Kim ST, Kim SH, Kim SW, Lim KH, Kim KS, Kim SO, Hyeon T, Angew. Chem. Int. Ed 2007, 46, 5397; [DOI] [PubMed] [Google Scholar]; b) Baek MJ, Park JY, Xu W, Kattel K, Kim HG, Lee EJ, Patel AK, Lee JJ, Chang Y, Kim TJ, Bae JE, Chae KS, Lee GH, ACS Appl. Mater. Interfaces 2010, 2, 2949; [DOI] [PubMed] [Google Scholar]; c) Huang C-C, Khu N-H, Yeh C-S, Biomaterials 2010, 31, 4073; [DOI] [PubMed] [Google Scholar]; d) Schladt TD, Schneider K, Shukoor MI, Natalio F, Bauer H, Tahir MN, Weber S, Schreiber LM, Schröder HC, Müller WEG, Tremel W, J. Mater. Chem 2010, 20, 8297. [Google Scholar]
- [60].a) Bottrill M, Kwok L, Long NJ, Chem. Soc. Rev 2006, 35, 557; [DOI] [PubMed] [Google Scholar]; b) Dong H, Du S-R, Zheng X-Y, Lyu G-M, Sun L-D, Li L-D, Zhang P-Z, Zhang C, Yan C-H, Chem. Rev 2015, 115, 10725; [DOI] [PubMed] [Google Scholar]; c) Xing H, Zhang S, Bu W, Zheng X, Wang L, Xiao Q, Ni D, Zhang J, Zhou L, Peng W, Zhao K, Hua Y, Shi J, Adv. Mater 2014, 26, 3867. [DOI] [PubMed] [Google Scholar]
- [61].Shen Z, Chen T, Ma X, Ren W, Zhou Z, Zhu G, Zhang A, Liu Y, Song J, Li Z, RUAN H, Fan W, Lin L, Munasinghe J, Chen X, ACS Nano 2017, 11, 10992. [DOI] [PubMed] [Google Scholar]
- [62].a) Keasberry NA Banobre-Lopez M, Wood C, Stasiuk GJ, Gallo J, Long NJ, Nanoscale 2015, 7, 16119; [DOI] [PubMed] [Google Scholar]; b) Zhou Z, Huang D, Bao J, Chen Q, Liu G, Chen Z, Chen X, Gao J, Adv. Mater 2012, 24, 6223; [DOI] [PMC free article] [PubMed] [Google Scholar]; c) Wang L, Lin H, Ma L, Jin J, Shen T, Wei R, Wang X, Ai H, Chen Z, Gao J, Nanoscale 2017, 9, 4516. [DOI] [PubMed] [Google Scholar]
- [63].Chen F, Bu W, Zhang S, Liu X, Liu J, Xing H, Xiao Q, Zhou L, Peng W, Wang L, Shi J, Adv. Funct. Mater 2011, 21, 4285. [Google Scholar]
- [64].Jung H, Park B, Lee C, Cho J, Suh J, Park J, Kim Y, Kim J, Cho G, Cho H, Nanomedicine: NBM 2014, 10, 1679. [DOI] [PubMed] [Google Scholar]
- [65].Stanisz GJ, Odrobina EE, Pun J, Escaravage M, Graham SJ, Bronskill MJ, Henkelman RM, Magnet. Reson. Med 2005, 54, 507. [DOI] [PubMed] [Google Scholar]
- [66].Yin X, Russek SE, Zabow G, Sun F, Mohapatra J, Keenan KE, Boss MA, Zeng H, Liu JP, Viert A, Liou S-H, Moreland J, Sci. Rep 2018, 8, 11863. [DOI] [PMC free article] [PubMed] [Google Scholar]
- [67].a) Jeong H-H, Mark AG, Alarcón-Correa M, Kim I, Oswald P, Lee T-C, Fischer P, Nat. Commun 2016, 7, 11331; [DOI] [PMC free article] [PubMed] [Google Scholar]; b) Narayanan R, El-Sayed MA, Nano Lett 2004, 4, 1343; [Google Scholar]; c) Li J-F, Anema JR, Wandlowski T, Tian Z-Q, Chem. Soc. Rev 2015, 44, 8399. [DOI] [PubMed] [Google Scholar]
- [68].Kodama RH, J. Magn. Magn. Mater 1999, 200, 359. [Google Scholar]
- [69].Boyer TH, Phys. Rev. D 1975, 11, 790. [Google Scholar]
- [70].a) Ling D, Lee N, Hyeon T, Acc. Chem. Res 2015, 48, 1276; [DOI] [PubMed] [Google Scholar]; b) Hyeon T, Chem. Commun 2003, 927. [DOI] [PubMed] [Google Scholar]
- [71].a) Kim D, Lee N, Park M, Kim BH, An K, Hyeon T, J. Am. Chem. Soc 2008, 131, 454; [DOI] [PubMed] [Google Scholar]; b) Zeng H, Rice PM, Wang SX, Sun S, J. Am. Chem. Soc 2004, 126, 11458. [DOI] [PubMed] [Google Scholar]
- [72].Hou Y, Xu Z, Sun S, Angew. Chem. Int. Ed 2007, 46, 6329. [DOI] [PubMed] [Google Scholar]
- [73].Palchoudhury S, Xu Y, Rushdi A, Holler RA, Bao Y, Chem. Commun 2012, 48, 10499. [DOI] [PubMed] [Google Scholar]
- [74].Zeng Y, Hao R, Xing B, Hou Y, Xu Z, Chem. Commun 2010, 46, 3920. [DOI] [PubMed] [Google Scholar]
- [75].Jia C-J, Sun L-D, Luo F, Han X-D, Heyderman LJ, Yan Z-G, Yan C-H, Zheng K, Zhang Z, Takano M, Hayashi N, Eltschka M, Kläui M, Rüdiger U, Kasama T, Cervera-Gontard L, Dunin-Borkowski RE, Tzvetkov G, Raabe J, J. Am. Chem. Soc 2008, 130, 16968. [DOI] [PubMed] [Google Scholar]
- [76].Bao L, Low W-L, Jiang J, Ying JY, J. Mater. Chem 2012, 22, 7117. [Google Scholar]
- [77].a) Usov NA, Chang C-R, Wei Z-H, J. Appl. Phys 2001, 89, 7591; [Google Scholar]; b) Usov NA, Grebenshchikov YB, J. Appl. Phys 2008, 104, 043903. [Google Scholar]
- [78].a) Chang H, Br. J. Appl. Sci 1961, 12, 160; [Google Scholar]; b) Tejedor M, Rubio H, Elbaile L, Iglesias R, IEEE T. Magnet 1995, 31, 830. [Google Scholar]
- [79].Newell AJ, Merrill RT, J. Appl. Phys 1998, 84, 4394. [Google Scholar]
- [80].Lee N, Kim H, Choi SH, Park M, Kim D, Kim HC, Choi Y, Lin S, Kim BH, Jung HS, Park KS, Moon WK, Hyeon T, Proc. Natl. Acad. Sci. U. S. A 2011, 108, 2662. [DOI] [PMC free article] [PubMed] [Google Scholar]
- [81].Walter A, Billotey C, Garofalo A, Ulhaq-Bouillet C, Lefèvre C, Taleb J, Laurent S, Vander Elst L, Muller RN, Lartigue L, Gazeau F, Felder-Flesch D, Begin-Colin S, Chem. Mater 2014, 26, 5252. [Google Scholar]
- [82].Zhou Z, Wu C, Liu H, Zhu X, Zhao Z, Wang L, Xu Y, Ai H, Gao J, ACS Nano 2015, 9, 3012. [DOI] [PubMed] [Google Scholar]
- [83].a) Li F, Zhi D, Luo Y, Zhang J, Nan X, Zhang Y, Zhou W, Qiu B, Wen L, Liang G, Nanoscale 2016, 8, 12826; [DOI] [PubMed] [Google Scholar]; b) Sharma VK, Alipour A Soran-Erdem Z, Aykut ZG, Demir HV, Nanoscale 2015, 7, 10519. [DOI] [PubMed] [Google Scholar]
- [84].Rotz MW, Culver KSB, Parigi G, MacRenaris KW, Luchinat C, Odom TW, Meade TJ, ACS Nano 2015, 9, 3385. [DOI] [PMC free article] [PubMed] [Google Scholar]
- [85].Culver KSB, Shin YJ, Rotz MW, Meade TJ, Hersam MC, Odom TW, J. Phys. Chem . C 2016, 120, 22103. [DOI] [PMC free article] [PubMed] [Google Scholar]
- [86].a) Shuai M, Klittnick A, Shen Y, Smith GP, Tuchband MR, Zhu C, Petschek RG, Mertelj A, Lisjak D, Čopič M, Maclennan JE, Glaser MA, Clark NA, Nat. Commun 2016, 7, 10394; [DOI] [PMC free article] [PubMed] [Google Scholar]; b) Mertelj A, Lisjak D, Drofenik M, Čopič M, Nature 2013, 504, 237. [DOI] [PubMed] [Google Scholar]
- [87].Cheng W, He J, Yao T, Sun Z, Jiang Y, Liu Q, Jiang S, Hu F, Xie Z, He B, Yan W, Wei S, J. Am. Chem. Soc 2014, 136, 10393. [DOI] [PubMed] [Google Scholar]
- [88].a) Song X-R, Wang X, Yu S-X, Cao J, Li S-H, Li J, Liu G, Yang H-H, Chen X, Adv. Mater 2015, 27, 3285; [DOI] [PMC free article] [PubMed] [Google Scholar]; b) Huang G, Zhang K-L, Chen S, Li S-H, Wang L-L, Wang L-P, Liu R, Gao J, Yang H-H, J. Mater. Chem. B 2017, 5, 3629; [DOI] [PubMed] [Google Scholar]; c) Cho M, Sethi R, Ananta narayanan JS, Lee SS, Benoit DN, Taheri N, Decuzzi P, Colvin VL, Nanoscale 2014, 6, 13637; [DOI] [PubMed] [Google Scholar]; d) Wang D, Kang Y, Ye X, Murray CB, Chem. Mater 2014, 26, 6328; [Google Scholar]; e) Park M, Lee N, Choi SH, An K, Yu S-H, Kim JH, Kwon S-H, Kim D, Kim H, Baek S-I, Ahn T-Y, Park OK, Son JS, Sung Y-E, Kim Y-W, Wang Z, Pinna N, Hyeon T, Chem. Mater 2011, 23, 3318; [Google Scholar]; f) Paik T, Gordon TR, Prantner AM, Yun H, Murray CB, ACS Nano 2013, 7, 2850; [DOI] [PubMed] [Google Scholar]; g) Chen Y, Cheng L, Dong Z, Chao Y, Lei H, Zhao H, Wang J, Liu Z, Angew. Chem. Int. Ed 2017, 129, 13171; [DOI] [PubMed] [Google Scholar]; h) Wu M, Li L, Yu X, Zhang D, Sun T, Li X, Sun L, Lui S, Huang X, Bi F, Wang H, Zhu H, Gong Q, J. Biomed. Nanotechnol 2014, 10, 3620. [DOI] [PubMed] [Google Scholar]
- [89].a) An K, Park M, Yu JH, Na HB, Lee N, Park J, Choi SH, Song IC, Moon WK, Hyeon T, Eur. J. Inorg. Chem 2012, 2012, 2148; [Google Scholar]; b) Zhang Y, Chen B, Zhang L, Huang J, Chen F, Yang Z, Yao J, Zhang Z, Nanoscale 2011, 3, 1446; [DOI] [PubMed] [Google Scholar]; c) Wang T, Wang X, LaMontagne D, Wang Z, Wang Z, Cao YC, J. Am. Chem. Soc 2012, 134, 18225; [DOI] [PubMed] [Google Scholar]; d) Mohapatra J, Mitra A, Tyagi H, Bahadur D, Aslam M, Nanoscale 2015, 7, 9174. [DOI] [PubMed] [Google Scholar]
- [90].Shin J, Anisur RM, Ko MK, Im GH, Lee JH, Lee IS, Angew. Chem. Int. Ed 2009, 48, 321. [DOI] [PubMed] [Google Scholar]
- [91].a) Bae KH, Lee K, Kim C, Park TG, Biomaterials 2011, 32, 176; [DOI] [PubMed] [Google Scholar]; b) Kim T, Momin E, Choi J, Yuan K, Zaidi H, Kim J, Park M, Lee N, McMahon MT Quinones-Hinojosa A, Bulte JW, Hyeon T, Gilad AA, J. Am. Chem. Soc 2011, 133, 2955; [DOI] [PMC free article] [PubMed] [Google Scholar]; c) Peng YK, Lai CW, Liu CL, Chen HC, Hsiao YH, Liu WL, Tang KC, Chi Y, Hsiao JK, Lim KE, Liao HE, Shyue JJ, Chou PT, ACS Nano 2011, 5, 4177; [DOI] [PubMed] [Google Scholar]; d) Yu J, Hao R, Sheng F, Xu L, Li G, Hou Y, Nano Res 2012, 5, 679. [Google Scholar]
- [92].a) Bigall NC, Dilena E, Dorfs D, Beoutis M-L, Pugliese G, Wilhelm C, Gazeau F, Khan AA, Bittner AM, Garcia MA Garcia-Hernandez M, Manna L, Pellegrino T, J. Phys. Chem. C 2015, 119, 6246; [Google Scholar]; b) Xing R, Bhirde AA, Wang S, Sun X, Liu G, Hou Y, Chen X, Nano Res 2013, 6, 1. [Google Scholar]
- [93].Peng S, Sun S, Angew. Chem. Int. Ed 2007, 119, 4233. [Google Scholar]
- [94].Cheng K, Yang M, Zhang R, Qin C, Su X, Cheng Z, ACS Nano 2014, 8, 9884. [DOI] [PMC free article] [PubMed] [Google Scholar]
- [95].Sinmyo R, Bykova E, Ovsyannikov SV, McCammon C, Kupenko I, Ismailova L, Dubrovinsky L, Sci. Rep 2016, 6, 32852. [DOI] [PMC free article] [PubMed] [Google Scholar]
- [96].Wang Y, He J, Liu C, Chong WH, Chen H, Angew. Chem. Int. Ed 2015, 54, 2022. [DOI] [PubMed] [Google Scholar]
- [97].Yang C, Wu J, Hou Y, Chem. Commun 2011, 47, 5130. [DOI] [PubMed] [Google Scholar]
- [98].Yang C, Zhao H, Hou Y, Ma D, J. Am. Chem. Soc 2012, 134, 15814. [DOI] [PubMed] [Google Scholar]
- [99].a) Cheong S, Ferguson P, Feindel KW, Hermans IF, Callaghan PT, Meyer C, Slocombe A, Su C-H, Cheng F-Y, Yeh C-S, Ingham B, Toney MF, Tilley RD, Angew. Chem. Int. Ed 2011, 50, 4206; [DOI] [PubMed] [Google Scholar]; b) Yoon T-J, Lee H, Shao H, Weissleder R, Angew. Chem. Int. Ed 2011, 50, 4663. [DOI] [PMC free article] [PubMed] [Google Scholar]
- [100].Lacroix L-M, Frey Huls N, Ho D, Sun X, Cheng K, Sun S, Nano Lett 2011, 11, 1641. [DOI] [PubMed] [Google Scholar]
- [101].a) Meffre A, Mehdaoui B, Kelsen V, Fazzini PF, Carrey J, Lachaize S, Respaud M, Chaudret B, Nano Lett 2012, 12, 4722; [DOI] [PubMed] [Google Scholar]; b) Yu J, Yang C, Li J, Ding Y, Zhang L, Yousaf MZ, Lin J, Pang R, Wei L, Xu L, Sheng F, Li C, Li G, Zhao L, Hou Y, Adv. Mater 2014, 26, 4114; [DOI] [PubMed] [Google Scholar]; c) Huang G, Hu J, Zhang H, Zhou Z, Chi X, Gao J, Nanoscale 2014, 6, 726; [DOI] [PubMed] [Google Scholar]; d) Tang W, Zhen Z, Yang C, Wang L, Cowger T, Chen H, Todd T, Hekmatyar K, Zhao Q, Hou Y, Xie J, Small 2014, 10, 1245. [DOI] [PMC free article] [PubMed] [Google Scholar]
- [102].a) Peng YK, Liu CL, Chen HC, Chou SW, Tseng WH, Tseng YJ, Kang CC, Hsiao JK, Chou PT, J. Am. Chem. Soc 2013, 135, 18621; [DOI] [PubMed] [Google Scholar]; b) Peng Y-K, Tseng Y-J, Liu C-L, Chou S-W, Chen Y-W, Tsang SCE, Chou P-T, Nanoscale 2015, 7, 2676. [DOI] [PubMed] [Google Scholar]
- [103].Van Roosbroeck R, Van Roy W, Stakenborg T, Trekker J, D’Hollander A, Dresselaers T, Himmelreich U, Lammertyn J, Lagae L, ACS Nano 2014, 8, 2269. [DOI] [PubMed] [Google Scholar]
- [104].Ma J, Zhang X, He Y, Sun Q, Wang Y, Zuo-Jiang S, Wen Y, Liu R, Li X, Wang X, Dong W, Chen K, Appl. Phys. Lett 2015, 107, 073701. [Google Scholar]
- [105].a) Jang JT, Nah H, Lee JH, Moon SH, Kim MG, Cheon J, Angew. Chem. Int. Ed 2009, 48, 1234; [DOI] [PubMed] [Google Scholar]; b) Lee JH, Huh YM, Jun YW, Seo JW, Jang JT, Song HT, Kim S, Cho EJ, Yoon HG, Suh JS, Cheon J, Nat. Med 2007, 13, 95. [DOI] [PubMed] [Google Scholar]
- [106].He S, Zhang H, Xing H, Li K, Cui H, Yang C, Sun S, Zeng H, Nano Lett 2014, 14, 3914. [DOI] [PubMed] [Google Scholar]
- [107].Zhao Z, Chi X, Yang L, Yang R, Ren BW, Zhu X, Zhang P, Gao J, Chem. Mater 2016, 28, 3497. [Google Scholar]
- [108].Yang L, Ma L, Xin J, Li A, Sun C, Wei R, Ren BW, Chen Z, Lin H, Gao J, Chem. Mater 2017, 29, 3038. [Google Scholar]
- [109].a) Wang X, Zhou Z, Wang Z, Xue Y, Zeng Y, Gao J, Zhu L, Zhang X, Liu G, Chen X, Nanoscale 2013, 5, 8098; [DOI] [PMC free article] [PubMed] [Google Scholar]; b) Zhou Z, Liu H, Chi X, Chen J, Wang L, Sun C, Chen Z, Gao J, ACS Appl. Mater. Interfaces 2015, 7, 28286; [DOI] [PubMed] [Google Scholar]; c) Zeng Y, Wang L, Zhou Z, Wang X, Zhang Y, Wang J, Mi P, Liu G, Zhou L, Biomater. Sci 2017, 5, 50. [DOI] [PubMed] [Google Scholar]
- [110].a) Chen M, Wu B, Yang J, Zheng N, Adv. Mater 2012, 24, 862; [DOI] [PubMed] [Google Scholar]; b) Xia X, Xie S, Liu M, Peng H-C, Lu N, Wang J, Kim MJ, Xia Y, Proc. Natl. Acad. Sci. U.S.A 2013, 110, 6669. [DOI] [PMC free article] [PubMed] [Google Scholar]
- [111].Thanh NTK, Maclean N, Mahiddine S, Chem. Rev 2014, 114, 7610. [DOI] [PubMed] [Google Scholar]
- [112].a) T. Hiemstra, Environ. Sci.: Nano 2018, doi: 10.1039/C7EN01060E; [DOI] [Google Scholar]; b) J. D. Padmos, M. L. Personick, Q. Tang, P. N. Duchesne, D.-e. Jiang, C. A. Mirkin, P. Zhang, Nat. Commun 2015, 6, 7664;26153854 [Google Scholar]; c) K. An, G. A. Somorjai, ChemCatChem 2012, 4, 1512. [Google Scholar]
- [113].Tian N, Zhou Z-Y, Sun S-G, Ding Y, Wang ZL, Science 2007, 316, 732. [DOI] [PubMed] [Google Scholar]
- [114].Zhou Z, Hu R, Wang L, Sun C, Fu G, Gao J, Nanoscale 2016, 8, 17887. [DOI] [PMC free article] [PubMed] [Google Scholar]
- [115].a) Merte LR, Peng G, Bechstein R, Rieboldt F, Farberow CA, Grabow LC, Kudernatsch W, Wendt S, Laegsgaard E, Mavrikakis M, Besenbacher F, Science 2012, 336, 889; [DOI] [PubMed] [Google Scholar]; b) Zobel M, Neder RB, Kimber SAJ, Science 2015, 347, 292. [DOI] [PubMed] [Google Scholar]
- [116].a) A. M. Stoneham, Theory of Defects in Solids: Electronic Structure of Defects in Insulators and Semiconductors, Oxford University Press, Oxford: 1975; [Google Scholar]; b) Pacchioni G, Chemphyschem 2003, 4, 1041. [DOI] [PubMed] [Google Scholar]
- [117].a) Jing L, Xin B, Yuan F, Xue L, Wang B, Fu H, J. Phys. Chem. B 2006, 110, 17860; [DOI] [PubMed] [Google Scholar]; b) Li L, Feng X, Nie Y, Chen S, Shi F, Xiong K, Ding W, Qi X, Hu J, Wei Z, Wan L-J, Xia M, ACS Catal 2015, 5, 4825; [Google Scholar]; c) Jeen H, Bi Z, Choi WS, Chisholm MF, Bridges CA, Paranthaman MP, Lee HN, Adv. Mater 2013, 25, 6459. [DOI] [PubMed] [Google Scholar]
- [118].a) Schaub R, Wahlström E, Rønnau A, Laegsgaard E, Stensgaard I, Besenbacher F, Science 2003, 299, 377; [DOI] [PubMed] [Google Scholar]; b) Shi J, Chem. Rev 2013, 113, 2139; [DOI] [PubMed] [Google Scholar]; c) Liu X, Zhou K, Wang L, Wang B, Li Y, J. Am. Chem. Soc 2009, 131, 3140; [DOI] [PubMed] [Google Scholar]; d) Manthiram K, Alivisatos AP, J. Am. Chem. Soc 2012, 134, 3995; [DOI] [PubMed] [Google Scholar]; e) Zhou Z, Kong B, Yu C, Shi X, Wang M, Liu W, Sun Y, Zhang Y, Yang H, Yang S, Sci. Rep 2014, 4, 3653. [DOI] [PMC free article] [PubMed] [Google Scholar]
- [119].Ni D, Zhang J, Wang J, Hu P, Jin Y, Tang Z, Yao Z, Bu W, Shi J, ACS Nano 2017, 11, 4256. [DOI] [PubMed] [Google Scholar]
- [120].Wetterskog E, Tai C-W, Grins J, Bergström L, Salazar-Alvarez G, ACS Nano 2013, 7, 7132. [DOI] [PubMed] [Google Scholar]
- [121].a) Schladt TD, Schneider K, Schild H, Tremel W, Dalton. Trans 2011, 40, 6315; [DOI] [PubMed] [Google Scholar]; b) Kang T, Li F, Baik S, Shao W, Ling D, Hyeon T, Biomaterials 2017, 136, 98. [DOI] [PubMed] [Google Scholar]
- [122].a) Gobbo OL, Sjaastad K, Radomski MW, Volkov Y Prina-Mello A, Theranostics 2015, 5, 1249; [DOI] [PMC free article] [PubMed] [Google Scholar]; b) Xie J, Lee S, Chen X, Adv. Drug Delivery Rev 2010, 62, 1064; [DOI] [PMC free article] [PubMed] [Google Scholar]; c) Yoo D, Lee J-H, Shin T-H, Cheon J, Acc. Chem. Res 2011, 44, 863. [DOI] [PubMed] [Google Scholar]
- [123].a) Kievit FM, Zhang M, Acc. Chem. Res 2011, 44, 853; [DOI] [PMC free article] [PubMed] [Google Scholar]; b) Xie J, Liu G, Eden HS, Ai H, Chen X, Acc. Chem. Res 2011, 44, 883. [DOI] [PMC free article] [PubMed] [Google Scholar]
- [124].Smolensky ED, Park H-YE, Berquó TS, Pierre VC, Contrast Media Mol. Imaging 2011, 6, 189. [DOI] [PMC free article] [PubMed] [Google Scholar]
- [125].Zeng J, Jing L, Hou Y, Jiao M, Qiao R, Jia Q, Liu C, Fang F, Lei H, Gao M, Adv. Mater 2014, 26, 2694. [DOI] [PubMed] [Google Scholar]
- [126].Reynolds F, O’Loughlin T, Weissleder R, Josephson L, Anal. Chem 2005, 77, 814. [DOI] [PubMed] [Google Scholar]
- [127].Tong S, Hou S, Zheng Z, Zhou J, Bao G, Nano Lett 2010, 10, 4607. [DOI] [PMC free article] [PubMed] [Google Scholar]
- [128].LaConte LEW, Nitin N, Zurkiya O, Caruntu D, O’Connor CJ, Hu X, Bao G, J. Magn. Reson. Imaging 2007, 26, 1634. [DOI] [PubMed] [Google Scholar]
- [129].Liu XL, Wang YT, Ng CT, Wang R, Jing GY, Yi JB, Yang J, Bay BH, Yung L-YL, Fan DD, Ding J, Fan HM, Adv. Mater. Interfaces 2014, 1, n/a. [Google Scholar]
- [130].Quan Q, Xie J, Gao H, Yang M, Zhang F, Liu G, Lin X, Wang A, Eden HS, Lee S, Zhang G, Chen X, Mol. Pharm 2011, 8, 1669. [DOI] [PMC free article] [PubMed] [Google Scholar]
- [131].Huang J, Wang L, Lin R, Wang AY, Yang L, Kuang M, Qian W, Mao H, ACS Appl. Mater. Interfaces 2013, 5, 4632. [DOI] [PMC free article] [PubMed] [Google Scholar]
- [132].Cowger TA, Tang W, Zhen Z, Hu K, Rink DE, Todd TJ, Wang GD, Zhang W, Chen H, Xie J, Theranostics 2015, 5, 1225. [DOI] [PMC free article] [PubMed] [Google Scholar]
- [133].Rowe MD, Chang C-C, Thamm DH, Kraft SL, Harmon JF, Vogt AP, Sumerlin BS, Boyes SG, Langmuir 2009, 25, 9487. [DOI] [PubMed] [Google Scholar]
- [134].Zheng X-Y, Zhao K, Tang J, Wang X-Y, Li L-D, Chen N-X, Wang Y-J, Shi S, Zhang X, Malaisamy S, Sun L-D, Wang X, Chen C, Yan C-H, ACS Nano 2017, 11, 3642. [DOI] [PubMed] [Google Scholar]
- [135].Johnson NJJ, He S, Nguyen Huu VA, Almutairi A, ACS Nano 2016, 10, 8299. [DOI] [PubMed] [Google Scholar]
- [136].He S, Johnson NJJ, Nguyen Huu VA, Cory E, Huang Y, Sah RL, Jokerst JV, Almutairi A, Nano Lett 2017, 17, 4873. [DOI] [PMC free article] [PubMed] [Google Scholar]
- [137].a) Zhu L, Yang Y, Farquhar K, Wang J, Tian C, Ranville J, Boyes SG, ACS Appl. Mater. Interfaces 2016, 8, 5040; [DOI] [PubMed] [Google Scholar]; b) Zhu X, Lin H, Wang L, Tang X, Ma L, Chen Z, Gao J, ACS Appl. Mater. Interfaces 2017, 9, 21688. [DOI] [PubMed] [Google Scholar]
- [138].a) Sodipo BK, Aziz AA, J. Magn. Magn. Mater 2016, 416, 275; [Google Scholar]; b) Kim T, Momin E, Choi J, Yuan K, Zaidi H, Kim J, Park M, Lee N, McMahon MT Quinones-Hinojosa A, Bulte JWM, Hyeon T, Gilad AA, J. Am. Chem. Soc 2011, 133, 2955; [DOI] [PMC free article] [PubMed] [Google Scholar]; c) Chen Y, Chen H, Sun Y, Zheng Y, Zeng D, Li F, Zhang S, Wang X, Zhang K, Ma M, He Q, Zhang L, Shi J, Angew. Chem. Int. Ed 2011, 50, 12505; [DOI] [PubMed] [Google Scholar]; d) Santra S, Tapec R, Theodoropoulou N, Dobson J, Hebard A, Tan W, Langmuir 2001, 17, 2900. [Google Scholar]
- [139].a) Leung KC-F, Xuan S, Zhu X, Wang D, Chak C-P, Lee S-F, Ho WKW, Chung BCT, Chem. Soc. Rev 2012, 41, 1911; [DOI] [PubMed] [Google Scholar]; b) Wang L, Park H-Y, Lim SII, Schadt MJ, Mott D, Luo J, Wang X, Zhong C-J, J. Mater. Chem 2008, 18, 2629; [Google Scholar]; c) Silva S. Moraes, Tavallaie R, Sandiford L, Tilley RD, Gooding JJ, Chem. Commun 2016, 52, 7528. [DOI] [PubMed] [Google Scholar]
- [140].Kwizera EA, Chaffin E, Wang Y, Huang X, RSC Adv 2017, 7, 17137. [DOI] [PMC free article] [PubMed] [Google Scholar]
- [141].a) Pinho SLC, Laurent S, Rocha J, Roch A, Delville M-H, Mornet S, Carlos LD, Elst L. Vander, Muller RN, Geraldes CFGC, J. Phys. Chem . C 2011, 116, 2285; [Google Scholar]; b) Pinho SLC, Pereira GA, Voisin P, Kassem J, Bouchaud V, Etienne L, Peters JA, Carlos L, Mornet S, Geraldes CFGC, Rocha J, Delville M-H, ACS Nano 2010, 4, 5339; [DOI] [PubMed] [Google Scholar]; c) Shin TH, Choi JS, Yun S, Kim IS, Song HT, Kim Y, Park KI, Cheon J, ACS Nano 2014, 8, 3393; [DOI] [PubMed] [Google Scholar]; d) Choi JS, Lee JH, Shin TH, Song HT, Kim EY, Cheon J, J. Am. Chem. Soc 2010, 132, 11015. [DOI] [PMC free article] [PubMed] [Google Scholar]
- [142].a) Levin CS, Hofmann C, Ali TA, Kelly AT, Morosan E, Nordlander P, Whitmire KH, Halas NJ, ACS Nano 2009, 3, 1379; [DOI] [PMC free article] [PubMed] [Google Scholar]; b) Fan Z, Shelton M, Singh AK, Senapati D, Khan SA, Ray PC, ACS Nano 2012, 6, 1065. [DOI] [PMC free article] [PubMed] [Google Scholar]
- [143].a) Lin L, Yang X, Zhou Z, Yang Z, Jacobson O, Liu Y, Yang A, Niu G, Song J, Yang H, Chen X, Adv. Mater 2017, 29, 201606681; [DOI] [PubMed] [Google Scholar]; b) Lin L-S, Song J, Yang H-H, Chen X, Adv. Mater 2018, 201704639. [DOI] [PubMed] [Google Scholar]
- [144].a) Huang W-Y, Davis JJ, Dalton. Trans 2011, 40, 6087; [DOI] [PMC free article] [PubMed] [Google Scholar]; b) Wang S, Lin J, Wang Z, Zhou Z, Bai R, Lu N, Liu Y, Fu X, Jacobson O, Fan W, Qu J, Chen S, Wang T, Huang P, Chen X, Adv. Mater 2017, 29, 201701013. [DOI] [PubMed] [Google Scholar]
- [145].a) Reguera J, Jimenez de Aberasturi D Henriksen-Lacey M, Langer J, Espinosa A, Szczupak B, Wilhelm C, Liz-Marzan LM, Nanoscale 2017, 9, 9467; [DOI] [PubMed] [Google Scholar]; b) Song J, Wu B, Zhou Z, Zhu G, Liu Y, Yang Z, Lin L, Yu G, Zhang F, Zhang G, Angew. Chem. Int. Ed 2017, 56, 8110; [DOI] [PubMed] [Google Scholar]; c) Reguera J, Jiménez de Aberasturi D, Winckelmans N, Langer J, Bals S, Liz-Marzán LM, Faraday Discuss 2016, 191, 47; [DOI] [PMC free article] [PubMed] [Google Scholar]; d) Glaser N, Adams DJ, Böker A, Krausch G, Langmuir 2006, 22, 5227; [DOI] [PubMed] [Google Scholar]; e) Xu C, Xie J, Ho D, Wang C, Kohler N, Walsh EG, Morgan JR, Chin YE, Sun S, Angew. Chem. Int. Ed 2008, 47, 173; [DOI] [PMC free article] [PubMed] [Google Scholar]; f) Buck MR, Bondi JF, Schaak RE, Nature Chem 2011, 4, 37; [DOI] [PubMed] [Google Scholar]; g) Figuerola A, Fiore A, Di Corato R, Falqui A, Giannini C, Micotti E, Lascialfari A, Corti M, Cingolani R, Pellegrino T, Cozzoli PD, Manna L, J. Am. Chem. Soc 2008, 130, 1477. [DOI] [PubMed] [Google Scholar]
- [146].a) Singh RK, Patel KD, Leong KW, Kim H-W, ACS Appl. Mater. Interfaces 2017, 9, 10309; [DOI] [PubMed] [Google Scholar]; b) Tang F, Li L, Chen D, Adv. Mater 2012, 24, 1504; [DOI] [PubMed] [Google Scholar]; c) Li Z, Barnes JC, Bosoy A, Stoddart JF, Zink JI, Chem. Soc. Rev 2012, 41, 2590. [DOI] [PubMed] [Google Scholar]
- [147].Ananta JS, Godin B, Sethi R, Moriggi L, Liu X, Serda RE, Krishnamurthy R, Muthupillai R, Bolskar RD, Helm L, Ferrari M, Wilson LJ, Decuzzi P, Nat. Nanotechnol 2010, 5, 815. [DOI] [PMC free article] [PubMed] [Google Scholar]
- [148].Kim SM, Im GH, Lee D-G, Lee JH, Lee WJ, Lee IS, Biomaterials 2013, 34, 8941. [DOI] [PubMed] [Google Scholar]
- [149].Hsu BYW, Ng M, Zhang Y, Wong SY, Bhakoo K, Li X, Wang J, Adv. Funct. Mater 2015, 25, 5269. [Google Scholar]
- [150].a) Ni K, Zhao Z, Zhang Z, Zhou Z, Yang L, Wang L, Ai H, Gao J, Nanoscale 2016, 8, 3768; [DOI] [PubMed] [Google Scholar]; b) Guo C, Hu J, Bains A, Pan D, Luo K, Li N, Gu Z, J. Mater. Chem . B 2016, 4, 2322. [DOI] [PubMed] [Google Scholar]
- [151].Sun Z, Zhou X, Luo W, Yue Q, Zhang Y, Cheng X, Li W, Kong B, Deng Y, Zhao D, Nano Today 2016, 11, 464. [Google Scholar]
- [152].a) Estrader M, López-Ortega A, Estradé S, Golosovsky IV Salazar-Alvarez G, Vasilakaki M, Trohidou KN, Varela M, Stanley DC, Sinko M, Pechan MJ, Keavney DJ, Peiró F, Suriñach S, Baró MD, Nogués J, Nat. Commun 2013, 4, 2960; [DOI] [PubMed] [Google Scholar]; b) López-Ortega A, Estrader M Salazar-Alvarez G, Roca AG, Nogués J, Phys. Rep 2015, 553, 1. [Google Scholar]
- [153].Lee J-H, Jang J.-t., Choi J.-s., Moon SH, Noh S.-h., Kim J.-w., Kim J-G, Kim I-S, Park KI, Cheon J, Nat. Nanotechnol 2011, 6, 418. [DOI] [PubMed] [Google Scholar]
- [154].a) Zeng H, Li J, Liu JP, Wang ZL, Sun S, Nature 2002, 420, 395; [DOI] [PubMed] [Google Scholar]; b) Zeng H, Li J, Wang ZL, Liu JP, Sun S, Nano Lett 2004, 4, 187; [Google Scholar]; c) Rinaldi-Montes N, Gorria P Martinez-Blanco D, Amghouz Z, Fuertes AB, Fernandez Barquin L, Rodriguez Fernandez J, Olivi L, Aquilanti G, Blanco JA, J. Mater. Chem. C 2016, 4, 2302; [Google Scholar]; d) Gao J, Liang G, Cheung JS, Pan Y, Kuang Y, Zhao F, Zhang B, Zhang X, Wu EX, Xu B, J. Am. Chem. Soc 2008, 130, 11828; [DOI] [PubMed] [Google Scholar]; e) Song Q, Zhang ZJ, J. Am. Chem. Soc 2012, 134, 10182. [DOI] [PubMed] [Google Scholar]
- [155].Lee H, Yoon T-J, Weissleder R, Angew. Chem. Int. Ed 2009, 48, 5657. [DOI] [PMC free article] [PubMed] [Google Scholar]
- [156].Cardona FA, Urquiza ES, Presa P. d. l., Tobon SH, Pal U, Fraijo PH, Yacaman MJ, Lozada Ramirez JD, Ivkov R, Angulo-Molina A, Mendez-Rojas MA, RSC Adv 2016, 6, 77558. [Google Scholar]
- [157].a) Ong QK, Lin X-M, Wei A, J. Phys. Chem . C 2011, 115, 2665; [DOI] [PMC free article] [PubMed] [Google Scholar]; b) Wu J, Park JS, Kim W, Arenholz E, Liberati M, Scholl A, Wu YZ, Hwang C, Qiu ZQ, Phys. Rev. Lett 2010, 104, 217204; [DOI] [PubMed] [Google Scholar]; c) Sun X, Frey Huls N, Sigdel A, Sun S, Nano Lett 2012, 12, 246. [DOI] [PubMed] [Google Scholar]
- [158].Santra S, Jativa SD, Kaittanis C, Normand G, Grimm J, Perez JM, ACS Nano 2012, 6, 7281. [DOI] [PMC free article] [PubMed] [Google Scholar]
- [159].J.-s. Choi, S. Kim, D. Yoo, T.-H. Shin, H. Kim, M. D. Gomes, S. H. Kim, A. Pines, J. Cheon, Nat. Mater 2017, 16, 537.28166216 [Google Scholar]
- [160].a) Im GH, Kim SM, Lee DG, Lee WJ, Lee JH, Lee IS, Biomaterials 2013, 34, 2069; [DOI] [PubMed] [Google Scholar]; b) Hu F, Zhao YS, Nanoscale 2012, 4, 6235. [DOI] [PubMed] [Google Scholar]
- [161].Whitesides GM, Grzybowski B, Science 2002, 295, 2418. [DOI] [PubMed] [Google Scholar]
- [162].a) Talapin DV, Shevchenko EV, Bodnarchuk MI, Ye X, Chen J, Murray CB, Nature 2009, 461, 964; [DOI] [PubMed] [Google Scholar]; b) Xia Y, Nguyen TD, Yang M, Lee B, Santos A, Podsiadlo P, Tang Z, Glotzer SC, Kotov NA, Nat. Nanotechnol 2011, 6, 580; [DOI] [PubMed] [Google Scholar]; c) Boal AK, Ilhan F, DeRouchey JE Thurn-Albrecht T, Russell TP, Rotello VM, Nature 2000, 404, 746; [DOI] [PubMed] [Google Scholar]; d) Grzelczak M, Vermant J, Furst EM, Liz-Marzán LM, ACS Nano 2010, 4, 3591. [DOI] [PubMed] [Google Scholar]
- [163].a) Mehdizadeh Taheri S, Michaelis M, Friedrich T, Förster B, Drechsler M, Römer FM, Bösecke P, Narayanan T, Weber B, Rehberg I, Rosenfeldt S, Förster S, Proc. Natl. Acad. Sci. U.S.A 2015, 112, 14484; [DOI] [PMC free article] [PubMed] [Google Scholar]; b) Sahoo Y, Cheon M, Wang S, Luo H, Furlani EP, Prasad PN, J. Phys. Chem. B 2004, 108, 3380. [Google Scholar]
- [164].Nie Z, Petukhova A, Kumacheva E, Nat. Nanotechnol 2010, 5, 15. [DOI] [PubMed] [Google Scholar]
- [165].a) Perez JM, Josephson L, O’Loughlin T, Hogemann D, Weissleder R, Nat. Biotech 2002, 20, 816; [DOI] [PubMed] [Google Scholar]; b) Issadore D, Min C, Liong M, Chung J, Weissleder R, Lee H, Lab Chip 2011, 11, 2282; [DOI] [PMC free article] [PubMed] [Google Scholar]; c) Haun JB, Yoon T-J, Lee H, Weissleder R, Wiley Interdiscip. Rev. Nanomed. Nanobiotechnol 2010, 2, 291. [DOI] [PubMed] [Google Scholar]
- [166].a) Taktak S, Sosnovik D, Cima MJ, Weissleder R, Josephson L, Anal. Chem 2007, 79, 8863; [DOI] [PubMed] [Google Scholar]; b) Min C, Shao H, Liong M, Yoon T-J, Weissleder R, Lee H, ACS Nano 2012, 6, 6821. [DOI] [PMC free article] [PubMed] [Google Scholar]
- [167].a) Lee H, Yoon T-J, Figueiredo J-L, Swirski FK, Weissleder R, Proc. Natl. Acad. Sci. U. S. A 2009, 106, 12459; [DOI] [PMC free article] [PubMed] [Google Scholar]; b) Lee H, Sun E, Ham D, Weissleder R, Nat. Med 2008, 14, 869; [DOI] [PMC free article] [PubMed] [Google Scholar]; c) Park KS, Kim H, Kim S, Lee K, Park S, Song J, Min C, Khanam F, Rashu R, Bhuiyan TR, Ryan ET, Qadri F, Weissleder R, Cheon J, Charles RC, Lee H, ACS Nano 2017, 11, 11425. [DOI] [PMC free article] [PubMed] [Google Scholar]
- [168].Shao H, Min C, Issadore D, Liong M, Yoon T-J, Weissleder R, Lee H, Theranostics 2012, 2, 55. [DOI] [PMC free article] [PubMed] [Google Scholar]
- [169].a) Wang T, Zhuang J, Lynch J, Chen O, Wang Z, Wang X, LaMontagne D, Wu H, Wang Z, Cao YC, Science 2012, 338, 358; [DOI] [PubMed] [Google Scholar]; b) Chen O, Riedemann L, Etoc F, Herrmann H, Coppey M, Barch M, Farrar CT, Zhao J, Bruns OT, Wei H, Guo P, Cui J, Jensen R, Chen Y, Harris DK, Cordero JM, Wang Z, Jasanoff A, Fukumura D, Reimer R, Dahan M, Jain RK, Bawendi MG, Nat. Commun 2014, 5, 5093; [DOI] [PMC free article] [PubMed] [Google Scholar]; c) Liu Y, Yang X, Huang Z, Huang P, Zhang Y, Deng L, Wang Z, Zhou Z, Liu Y, Kalish H, Khachab NM, Chen X, Nie Z, Angew. Chem. Int. Ed 2016, 55, 15297. [DOI] [PMC free article] [PubMed] [Google Scholar]
- [170].a) Stolarczyk JK, Deak A, Brougham DF, Adv. Mater 2016, 28, 5400; [DOI] [PubMed] [Google Scholar]; b) Liu Y, Liu B, Nie Z, Nano Today 2015, 10, 278; [Google Scholar]; c) Ai H, Flask C, Weinberg B, Shuai XT, Pagel MD, Farrell D, Duerk J, Gao J, Adv. Mater 2005, 17, 1949; [Google Scholar]; d) Lopes WA, Jaeger HM, Nature 2001, 414, 735. [DOI] [PubMed] [Google Scholar]
- [171].a) Song J, Huang P, Duan H, Chen X, Acc. Chem. Res 2015, 48, 2506; [DOI] [PMC free article] [PubMed] [Google Scholar]; b) Yi C, Zhang S, Webb KT, Nie Z, Acc. Chem. Res 2017, 50, 12; [DOI] [PubMed] [Google Scholar]; c) Hickey RJ, Haynes AS, Kikkawa JM, Park S-J, J. Am. Chem. Soc 2011, 133, 1517. [DOI] [PubMed] [Google Scholar]
- [172].Kaittanis C, Santra S, Santiesteban OJ, Henderson TJ, Perez JM, J. Am. Chem. Soc 2011, 133, 3668. [DOI] [PMC free article] [PubMed] [Google Scholar]
- [173].Amiri H, Bordonali L, Lascialfari A, Wan S, Monopoli MP, Lynch I, Laurent S, Mahmoudi M, Nanoscale 2013, 5, 8656. [DOI] [PubMed] [Google Scholar]
- [174].Pothayee N, Balasubramaniam S, Pothayee N, Jain N, Hu N, Lin Y, Davis RM, Sriranganathan N, Koretsky AP, Riffle JS, J. Mater. Chem. B 2013, 1, 1142. [DOI] [PMC free article] [PubMed] [Google Scholar]
- [175].Paquet C, de Haan HW, Leek DM, Lin H-Y, Xiang B, Tian G, Kell A, Simard B, ACS Nano 2011, 5, 3104. [DOI] [PubMed] [Google Scholar]
- [176].a) Courant T, Roullin VG, Cadiou C, Callewaert M, Andry MC, Portefaix C, Hoeffel C, de Goltstein MC, Port M, Laurent S, Elst LV, Muller R, Molinari M, Chuburu F, Angew. Chem. Int. Ed 2012, 51, 9119; [DOI] [PubMed] [Google Scholar]; b) Bennett KM, Shapiro EM, Sotak CH, Koretsky AP, Biophys. J 2008, 95, 342. [DOI] [PMC free article] [PubMed] [Google Scholar]
- [177].a) Croissant JG, Fatieiev Y, Almalik A, Khashab NM, Adv. Healthc. Mater 2017, DOI: 10.1002/adhm.201700831; [DOI] [PubMed] [Google Scholar]; b) Barnes TJ, Prestidge CA, Ther. Deliv 2015, 6, 97; [DOI] [PubMed] [Google Scholar]; c) Yang Q, Xu Q, Jiang H-L, Chem. Soc. Rev 2017, 46, 4774. [DOI] [PubMed] [Google Scholar]
- [178].Gizzatov A, Key J, Aryal S, Ananta J, Cervadoro A, Palange AL, Fasano M, Stigliano C, Zhong M, Di Mascolo D, Guven A, Chiavazzo E, Asinari P, Liu X, Ferrari M, Wilson LJ, Decuzzi P, Adv. Funct. Mater 2014, 24, 4584. [DOI] [PMC free article] [PubMed] [Google Scholar]
- [179].Chiavazzo E, Fasano M, Asinari P, Decuzzi P, Nat. Commun 2014, 5, 4565. [DOI] [PMC free article] [PubMed] [Google Scholar]
- [180].a) Chen Y, Xiong Z, Peng L, Gan Y, Zhao Y, Shen J, Qian J, Zhang L, Zhang W, ACS Appl. Mater. Interfaces 2015, 7, 16338; [DOI] [PubMed] [Google Scholar]; b) Sene S, M. T. Marcos-Almaraz, Menguy N, Scola J, Volatron J, Rouland R, Grenèche J-M, Miraux S, Menet C, Guillou N, Gazeau F, Serre C, Horcajada P, Steunou N, Chem 2017, 3, 303; [Google Scholar]; c) Zhao H-X, Zou Q, Sun S-K, Yu C, Zhang X, Li R-J, Fu Y-Y, Chem. Sci 2016, 7, 5294; [DOI] [PMC free article] [PubMed] [Google Scholar]; d) Della Rocca J, Lin W, Eur. J. Inorg. Chem 2010, 2010, 3725. [Google Scholar]
- [181].a) Brown WF, Phys. Rev 1963, 130, 1677; [Google Scholar]; b) Leslie-Pelecky DL, Rieke RD, Chem. Mater 1996, 8, 1770. [Google Scholar]
- [182].Butler RF, Banerjee SK, J. Geophys. Res 1975, 80, 4049. [Google Scholar]
- [183].Dutz S, Clement JH, Eberbeck D, Gelbrich T, Hergt R, Müller R, Wotschadlo J, Zeisberger M, J. Magn. Magn. Mater 2009, 321, 1501. [Google Scholar]
- [184].a) Ge J, Hu Y, Biasini M, Beyermann WP, Yin Y, Angew. Chem. Int. Ed 2007, 46, 4342; [DOI] [PubMed] [Google Scholar]; b) Lu Z, Yin Y, Chem. Soc. Rev 2012, 41, 6874. [DOI] [PubMed] [Google Scholar]
- [185].Lartigue L, Hugounenq P, Alloyeau D, Clarke SP, Lévy M, Bacri J-C, Bazzi R, Brougham DF, Wilhelm C, Gazeau F, ACS Nano 2012, 6, 10935. [DOI] [PubMed] [Google Scholar]
- [186].Kostopoulou A, Velu SKP, Thangavel K, Orsini F, Brintakis K, Psycharakis S, Ranella A, Bordonali L, Lappas A, Lascialfari A, Dalton. Trans 2014, 43, 8395. [DOI] [PubMed] [Google Scholar]
- [187].Huang J, Bu L, Xie J, Chen K, Cheng Z, Li X, Chen X, ACS Nano 2010, 4, 7151. [DOI] [PMC free article] [PubMed] [Google Scholar]
- [188].a) Morgan DG, Boris BS, Kuchkina NV, Yuzik-Klimova EY, Sorokina SA, Stein BD, Svergun DI, Spilotros A, Kostopoulou A, Lappas A, Shifrina ZB, Bronstein LM, Langmuir 2014, 30, 8543; [DOI] [PubMed] [Google Scholar]; b) Casula MF, Conca E, Bakaimi I, Sathya A, Materia ME, Casu A, Falqui A, Sogne E, Pellegrino T, Kanaras AG, Phys. Chem. Chem. Phys 2016, 18, 16848; [DOI] [PubMed] [Google Scholar]; c) Hemery G, Keyes AC, Garaio E, Rodrigo I, Garcia JA, Plazaola F, Garanger E, Sandre O, Inorg. Chem 2017, 56, 8232; [DOI] [PubMed] [Google Scholar]; d) Klughertz G, Manfredi G, Hervieux P-A, Pichon BP Begin-Colin S, J. Phys. Chem. C 2016, 120, 7381; [Google Scholar]; e) Gerber O, Pichon BP, Ihiawakrim D, Florea I, Moldovan S, Ersen O, Begin D, Greneche JM, Lemonnier S, Barraud E Begin-Colin S, Nanoscale 2017, 9, 305. [DOI] [PubMed] [Google Scholar]
- [189].Xie J, Yan C, Zhang Y, Gu N, Chem. Mater 2013, 25, 3702. [Google Scholar]
- [190].Kostopoulou A, Brintakis K, Vasilakaki M, Trohidou KN, Douvalis AP, Lascialfari A, Manna L, Lappas A, Nanoscale 2014, 6, 3764. [DOI] [PubMed] [Google Scholar]
- [191].a) Weitz DA, Oliveria M, Phys. Rev. Lett 1984, 52, 1433; [Google Scholar]; b) Bishop KJM, Wilmer CE, Soh S, Grzybowski BA, Small 2009, 5, 1600. [DOI] [PubMed] [Google Scholar]
- [192].Liang ZP, Lauterbur PC, Principles of magnetic resonance imaging: a signal processing perspective, Wiley-IEEE Press, 1999. [Google Scholar]
- [193].Zhou Z, Tian R, Wang Z, Yang Z, Liu Y, Liu G, Wang R, Gao J, Song J, Nie L, Chen X, Nat. Commun 2017, 8, 15468. [DOI] [PMC free article] [PubMed] [Google Scholar]
- [194].Nguyen TDT, Pitchaimani A, Ferrel C, Thakkar R, Aryal S, Nanoscale 2018, 10, 284. [DOI] [PubMed] [Google Scholar]
- [195].Mikhaylov G, Mikac U, Magaeva AA, Itin VI, Naiden EP, Psakhye I, Babes L, Reinheckel T, Peters C, Zeiser R, Bogyo M, Turk V, Psakhye SG, Turk B, Vasiljeva O, Nat. Nanotechnol 2011, 6, 594. [DOI] [PubMed] [Google Scholar]