

Abstract
Background
The incidence of hip fracture is steadily increasing. We aimed to establish a creative approach to precisely estimate the risk of hip fracture by exploring the relationship between hip fracture and bone mineral density (BMD)/femur geometry.
Material/Methods
Sixteen samples of cadaveric female proximal femora were randomly selected. Experiments were performed experimental measurement of the femoral neck BMD and geometric parameters (including neck length, neck diameter, head diameter, and neck-shaft angle). In addition, the experimental measurements contain the failure load, which represents the mechanical strength of the femoral neck, and we calculated the correlation coefficient among BMD, geometric parameters, and failure load.
Results
Significant correlations were discovered between femoral mechanical properties and femoral neck BMD (r=0.792, r2=0.628, P<0.001), trochanteric BMD (r=0.749, r2=0.560, P=0.001), and head diameter (r=0.706, r2=0.499, P=0.002). Multiple linear regression analyses indicated that the best predictor of hip fracture was the combination of femoral neck BMD, head diameter, and neck diameter (r2=0.844, P<0.001).
Conclusions
The results confirmed that, compared with BMD alone, the combination of BMD and geometric parameters of proximal femur is a better estimation of hip fracture. The geometry of the proximal femur played an important role in assessing the biomechanical strength of femur. This method greatly assists in predicting the risk of hip fracture in clinical trials and will assist studies on why the incidence of hip fracture varies among races.
MeSH Keywords: Bone Density Conservation Agents; Geography, Medical; Hip Fractures; Osteoporosis
Background
Osteoporosis is a type of metabolic bone disorder characterized by reduced bone mass and deterioration of bone structure [1]. Bone fragility and susceptibility to fracture are increased due to resorption of bone [2] and changes in bone geometry [3,4]. Osteoporotic hip fracture is a major public health problem due to its mortality, disability, and financial costs for treatment, particularly among elderly patients. For efficient targeting of preventive care, an effective and precise method to estimate the risk of fracture would be of practical value [5,6].
A number of different techniques for the assessment of bone fracture risk have been described, such as ultrasound (US), high-resolution computed tomography (CT), and magnetic resonance imaging (MRI). However, there are inherent limitations in the application of these techniques, such as inaccuracy (US) [7], radiation dose (CT) [8], and costs (CT and MRI) [9].
Dual energy X-ray absorptiometry (DXA) of the hip is the most widely applied technique in quantitative assessment of bone mineral density (BMD) in vivo and is currently used as an indicator of osteoporosis by the World Health Organization (WHO) [10]. Previous in vitro investigations have shown that femoral neck strength is highly correlated with BMD, which is most often used as a representative measure of proximal femoral BMD to predict the risk of hip fracture [11,12]. However, DXA lacks reliability in predicting individual risk of fracture [13] because DXA cannot elucidate trabecular bone structure, which is important in maintaining bone integrity and mechanical strength [2,14].
The geometry of the proximal femur is related to mechanical strength as determined by analysis of X-ray images, which was previously proposed for measuring bone structure [15,16]. Unfortunately, some issues remain controversial when explicitly detailing such a relationship; for example, which geometric parameter of the hip has the closest association with femoral neck mechanical strength, and how it is related [3,17]. The objectives of the present research were: a) to determine how BMD is related to femoral neck mechanical strength; b) to determine which geometric parameter is most related; and c) to find the combination of BMD and some geometric parameter(s) that can best describe the risk of hip fracture.
Material and Methods
Sample preparation
The experimental sample consisted of 16 right proximal femur patients (all females, mean age 77.8±10.2 years). The samples were obtained from the Institute of Anatomy at the Fourth Military Medical University, Xi’an, Shannxi Province, China. This study was officially approved by the institutional Ethics Committee of the Air Force Medical University (No. 033782).
The criterion for inclusion was a testamentary decree to the institute several years prior to death so that the samples could be assumed to be representative of the population of this age range in China. The individuals had a wide range of social backgrounds, with no detailed social history available. The main causes of death, obtained from autopsy reports and clinical diagnoses, were heart failure, pneumonia, stroke, and sepsis. To identify samples with bone diseases other than osteoporosis or osteopenia, biopsies were taken from the left iliac crest for histology observation. Individuals with bone diseases other than osteoporosis or osteopenia were excluded from the study [16,18].
The proximal femora were excised within 10 days after death. We cleaned the surrounding soft tissue and trimmed it with a handsaw approximately 10 cm below the lesser trochanter. All the samples were radiographed to exclude those with prior fracture or other local bone disorders. Each femur was sealed in a double-layered plastic bag and stored in a −20°C cryogenic freezer [19]. The tissues were placed in a clean lab at room temperature for 24 h to thaw naturally before any measurements or tests. All the samples were maintained moist continuously during geometry measurement, radiography, DXA measurement, and mechanical testing [18].
Geometry
All of the geometric parameters (including neck length, neck diameter, head diameter, and neck-shaft angle, Figure 1) of the proximal femur were measured using a vernier caliper.
Figure 1.
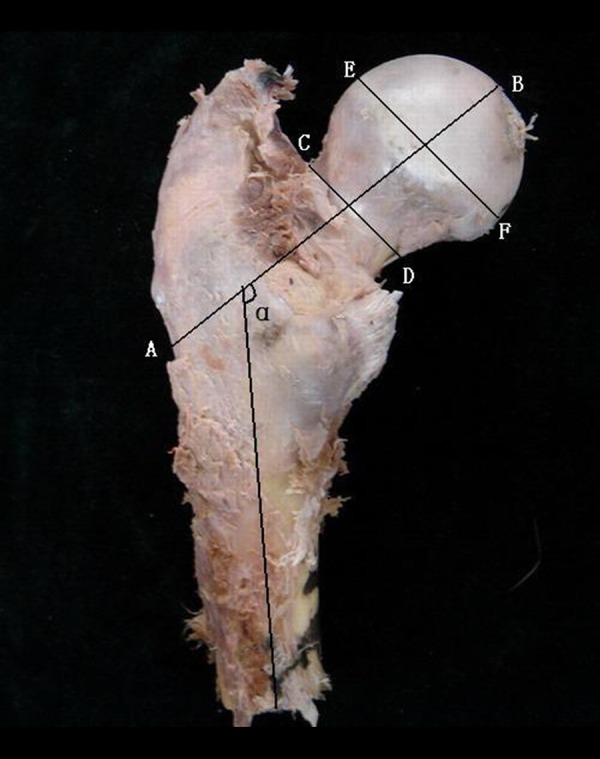
Geometry of proximal femur; A, B – Femoral neck axis length from the external side of the trochanter to the inner pelvic brim; C, D – Femoral neck diameter orthogonally to the hip axis at the narrow portion of the femoral neck; E, F – Femoral head diameter orthogonally to the hip axis at the wide portion of the femoral head; α – Neck-shaft angle between the femoral neck and shaft axis; G, H – femoral shaft axis.
Densitometry
Vitro DXA scans of the femora were obtained using a standard narrow-angle fan-beam scanner (GE Lunar Prodigy; GE Lunar Corp., Madison, WI, USA) (Figure 2). The scans were evaluated with the software provided by the manufacturer, providing results of BMD (g/cm2) of the total proximal femur. The experimental measurements were performed independently 3 times; the average value was calculated as the result.
Figure 2.
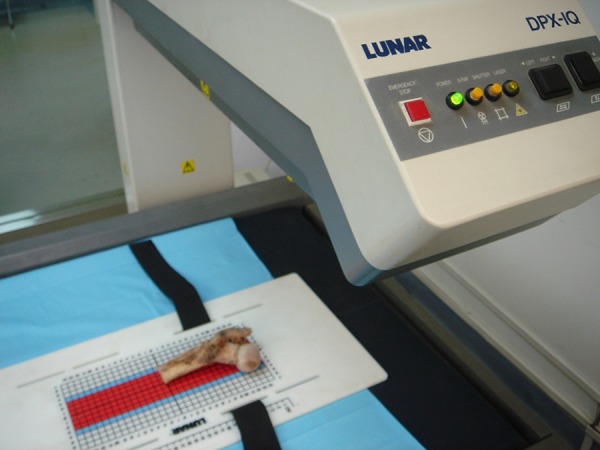
DXA scans of the femora were obtained using a standard narrow-angle fan-beam scanner (GE Lunar Prodigy, GE Lunar Corporation, Madison, WI, USA), the proximal femur specimens being placed in the same position.
Biomechanical tests
The distal end of the femur and the proximal end of the femoral neck were potted into 2 specially designed mild steel cylinder connectors with dental cement at an anatomical angle of 18° from the vertical [26]. The tests were performed on the MTS 880 material testing system (MTS System Inc., Minneapolis, MN, USA). The original load was applied and gradually increased at a rate of 12.7 mm/min until failure load occurred, and the values were recorded (failure criteria: occurrence of fracture, rupture in femoral head or neck) [19]. The loading signals from the testing machine were automatically recorded by a computer data acquisition system and the maximum mechanical strength was calculated with corresponding software.
Statistical analysis
All data were analyzed with SPSS version 24.0 software (SPSS, Inc., Chicago, IL) and are presented as mean value ± standard deviation. We used linear correlation regression and multiple linear regression analyses to determine the correlation between geometric parameters, BMD, and failure load of the femoral neck of each specimen. The results were used to compare different influences on the failure load of the femoral neck and to unveil the underlying relationship. Pearson’s correlation coefficient (r), coefficient of determination, and P value were used to describe the relationship between BMD of the femoral neck and each geometric parameter with failure load. In addition, multiple linear regression analyses were used to determine whether certain combinations of related parameters improved the predictive ability.
Results
The average failure load of the specimens was 8658.2N±2563.5 SD with the average trochanteric BMD 0.590 g/cm2 ±0.139SD, the average neck BMD 0.614 g/cm2 ±0.076 SD, the average neck length 101.9 mm ±8.8 SD, the average neck diameter 31.9 mm ±3.2 SD, the average head diameter 46.8 mm ±4.2 SD, and the average neck-shaft angle 124.5° ±6.8 SD (Table 1).
Table 1.
Measurement of the variables and fFailure loads.
| Specimens | Femoral neck axis length (mm) | Femoral neck diameter (mm) | Femoral head diameter (mm) | Neck-shaft angle (°) | Trochanteric BMD (g/cm2) | Femoral neck BMD (g/cm2) | Failure load (N) |
|---|---|---|---|---|---|---|---|
| 1 | 90.2 | 27.3 | 40.9 | 118.9 | 0.488 | 0.591 | 7568.7 |
| 2 | 116.3 | 37.5 | 52.2 | 123.1 | 0.721 | 0.709 | 9343.2 |
| 3 | 102.6 | 34.4 | 46.8 | 122.2 | 0.540 | 0.491 | 7260.2 |
| 4 | 93.5 | 30.8 | 41.6 | 126.6 | 0.569 | 0.574 | 7190.8 |
| 5 | 109.4 | 30.7 | 52.7 | 126.2 | 0.530 | 0.542 | 10546.3 |
| 6 | 94.1 | 31.0 | 45.2 | 127.8 | 0.641 | 0.623 | 8215.1 |
| 7 | 108.3 | 35.6 | 48.9 | 131.5 | 0.671 | 0.647 | 9947.2 |
| 8 | 107.9 | 37.1 | 51.8 | 125.7 | 0.989 | 0.776 | 13728.1 |
| 9 | 101.2 | 29.4 | 45.5 | 133.9 | 0.437 | 0.565 | 6810.4 |
| 10 | 97.3 | 30.5 | 44.1 | 119.8 | 0.503 | 0.589 | 5542.5 |
| 11 | 91.7 | 28.2 | 43.0 | 126.2 | 0.591 | 0.687 | 9317.9 |
| 12 | 105.1 | 33.4 | 48.3 | 110.8 | 0.480 | 0.539 | 5879.6 |
| 13 | 97.8 | 30.9 | 44.0 | 113.1 | 0.501 | 0.577 | 6971.7 |
| 14 | 101.2 | 28.7 | 45.3 | 133.5 | 0.439 | 0.569 | 6813.3 |
| 15 | 120.1 | 29.7 | 54.8 | 132.3 | 0.701 | 0.710 | 14497.8 |
| 16 | 93.6 | 34.9 | 43.3 | 120.0 | 0.636 | 0.641 | 8897.9 |
| Mean | 101.9 | 31.9 | 46.8 | 124.5 | 0.590 | 0.614 | 8658.2 |
| SD | 8.8 | 3.2 | 4.2 | 6.8 | 0.139 | 0.076 | 2563.5 |
Mean – mean value; SD – standard difference; BMD – bone mineral density.
Pearson’s correlation coefficient, determination coefficient, and P value between femoral neck BMD, each geometric parameter, and femoral neck failure load were calculated. By means of linear correlation regression analysis, we found that femoral neck BMD (r=0.792, r2=62.8%, P<0.001) of the proximal femur was more strongly correlated with the failure load than any other variable. There was distinct correlation between trochanteric BMD (r=0.749, r2=56.0%, P=0.001), head diameter (r=0.706, r2=49.9%, P=0.002) and the failure load of the proximal femur. There is some certain correlation among the neck length (r=0.599, r2=35.9%, P=0.014), neck diameter (r=0.516, r2=26.6%, P=0.041) and the failure load. There was no obvious correlation between neck-shaft angle (r=0.402, r2=16.2%, P=0.122) and the failure load (Table 2).
Table 2.
Correlation coefficients between femoral neck mechanical strength and the variables. Femoral neck BMD of the proximal femur is most strongly correlated with the failure load than any other variable. There is distinct correlation between trochanteric BMD, head diameter and the failure load of the proximal femur. There is some certain correlation between neck length, neck diameter and the failure load. There is no obvious correlation between neck-shaft angle and the failure load.
| r | r2 (%) | p | |
|---|---|---|---|
| Femoral neck BMD | 0.792 | 62.8 | <0.001 |
| Trochanteric BMD | 0.749 | 56.0 | 0.001 |
| Femoral head diameter | 0.706 | 49.9 | 0.002 |
| Femoral neck axis length | 0.599 | 35.9 | 0.014 |
| Femoral neck diameter | 0.516 | 26.6 | 0.041 |
| Neck-shaft angle | 0.402 | 16.2 | 0.122 |
BMD – bone mineral density; r – Pearson’s correlation coefficient; p – value of statistical significance.
Multiple linear regression analyses of the combinations of the variables revealed the best combination which could predict the risk of hip fracture. We found that the best combination is that of femoral neck BMD, femoral head diameter, and femoral neck diameter (r2=84.4%). The second best is that of femoral neck BMD and femoral head diameter (r2=70.7%). The following combinations are “femoral neck BMD, neck-shaft angle and femoral neck length (r2=70.5%)” and “femoral neck BMD and the femoral neck length (r2=67.4%)” (Table 3).
Table 3.
Correlation coefficients between femoral neck mechanical strength and combinations of the variables. The best combination which can predict the risk of hip fracture is that of femoral neck BMD, femoral head diameter and femoral neck diameter (r2=84.4%) and the second best is that of femoral neck BMD and femoral head diameter (r2=70.7%).
| r2 (%) | p | |
|---|---|---|
| Femoral neck BMD | 84.4 | <0.001 |
| Femoral head diameter | <0.001 | |
| Femoral neck diameter | 0.004 | |
| Femoral neck BMD | 70.7 | 0.004 |
| Femoral head diameter | 0.029 | |
| Femoral neck BMD | 70.5 | 0.001 |
| Neck-shaft angle | 0.153 | |
| Femoral neck axis length | 0.105 | |
| Femoral neck BMD | 67.4 | 0.001 |
| Femoral neck axis length | 0.062 | |
| Femoral neck BMD | 65.7 | <0.001 |
| Neck-shaft angle | 84.4 | 0.092 |
BMD – bone mineral density; r – Pearson’s correlation coefficient; p – value of statistical significance.
Discussion
As age increases, the risk of osteoporosis increases. Osteoporosis is an important factor that can cause hip fracture. Even slight forces can cause hip fractures in the elderly. Reduction of bone mass is an important factor that affects biomechanical strength of bone, thus making BMD an important indicator to assess hip fracture [20]. However, studies have shown that predicting hip fracture using only BMD it is not sufficiently precise. Using the combination of BMD and geometric parameters of the proximal femur, hip fracture can be predicted more accurately [3,21]. Our findings indicate that femoral neck BMD and trochanteric BMD (r=0.792, r2=62.8%, P<0.001; r=0.749, r2=56.0%, P=0.001) of the proximal femur are more correlated with the failure load than other factors. This is consistent with the studies of Pulkkinen et al. [16] and LeBras et al. [19], who reported that femoral neck diameter and femoral head diameter were not factors predictive of hip fracture. However, the present study shows that there is an obvious correlation between femoral head diameter (r=0.706, r2=49.9%, P=0.002) and failure load of the proximal femur; there is a correlation between femoral neck length (r=0.599, r2=35.9%, P=0.014), femoral neck diameter (r=0.516, r2=26.6%, P=0.041), and the failure load, which agrees with the conclusions of some previous studies [3,22]. Pulkkinen et al. [23] found that the femoral neck-shaft angle was the best choice for predicting hip fracture, especially the fracture type of the femoral neck, as well as for different sexes or failure loads of the specimens, and the best factor to predict the fracture type was the neck-shaft angle. However, our study shows that there is no distinct correlation between the neck-shaft angle (r =0.402, r2=16.2%, P=0.122) and the fracture type. These conflicting results probably arise from the different sex ratios of the selected samples.
Because the biomechanical properties are affected by many factors, such as BMD and geometric parameters, we analyzed which combination of the variables contributes the most to predict the risk of hip fracture by using multiple linear regression analysis. We found that the best combination to predict the risk of hip fracture is that of femoral neck BMD, femoral head diameter, and femoral neck diameter. Furthermore, these 3 factors not only affect the mechanical properties, but also predict the risk of hip fracture when used in combination. The 2 factors (femoral neck BMD and trochanteric BMD) can affect the failure load of the proximal femur and have stronger influence than geometric parameters. But among them, femoral neck BMD with other factors is more significant. Results have shown that BMD along with geometric parameters is more effective in predicting the risk of hip fracture than BMD alone, which is in accord with studies of Pulkkinen et al. [3], Faulkner et al. [24], and Seyyed Morteza Kazemi et al. [25].
The incidence of osteoporotic fracture (OF) varies among races. Studies have shown that Caucasoids (white people) have the highest risk, Negroids (black people) have the lowest risk, and other races have medium risk [26,27]. The difference in bone geometric parameters may be one of the major reasons why the incidence of hip fracture among different races varies. Bone strength is the ultimate standard of fracture resistance, which is determined primarily by BMD and geometry [28]. A study on the risk of hip fracture among white and black females showed that black females have a higher level of peak bone mass and bone strength, which may explain why the incidence of osteoporotic fracture of black people is lower than that of white people [29]. Asian people have smaller skeletons, lower BMD value, and lower risk of hip fracture [30]. Comparing the study results, we discovered that the peak bone mass among Chinese people is approximately 15% lower than that of white people and they have thus a faster decrease in femoral neck BMD [31,32]. This indicates that the differences in incidence of hip fracture between Caucasoids and Asians may be influenced by geometry of the femoral neck rather than the BMD differences among different races. In order to reduce the effects of sex-related differences, we chose female samples for the present research.
This study provides a good example for studies on the estimation of hip fracture and reached some conclusions for clinical operation. More studies with a larger number of samples will be collected for further investigation. Due to the limitation of experimental conditions, we have no samples from races other than Chinese. Efforts will be made to collect samples from other races for a more comprehensive study in the future.
Conclusions
Compared with BMD alone, BMD along with geometric parameters of proximal femur showed higher reliability in predicting the risk of hip fracture. The geometry of the proximal femur plays an important role in assessing the biomechanical strength of the femur. This method creates a more reliable standard to predict the risk of hip fracture in clinical trials.
Acknowledgements
The authors are grateful for using the facilities of the Medical Imaging Research Center in the Department of Radiology of Xijing Hospital.
Footnotes
Source of support: This work was supported by Contract Grant Sponsor: The Research Fund for the National Natural Science Foundation of China (No 81501885) to Yang Zhang
Conflict of interest
None.
References
- 1.Alp HH, Huyut Z, Yildirim S, et al. The effect of PDE5 inhibitors on bone and oxidative damage in ovariectomy-induced osteoporosis. Exp Biol Med. 2017;242(10):1051–61. doi: 10.1177/1535370217703352. [DOI] [PMC free article] [PubMed] [Google Scholar]
- 2.Chappard C, Brunet-Imbault B, Lemineur G, et al. Anisotropy changes in post-menopausal osteoporosis: Characterization by a new index applied to trabecular bone radiographic images. Osteoporos Int. 2005;16(10):1193–202. doi: 10.1007/s00198-004-1829-5. [DOI] [PubMed] [Google Scholar]
- 3.Pulkkinen P, Partanen J, Jalovaara P, Jämsä T. Combination of bone mineral density and upper femur geometry improves the prediction of hip fracture. Osteoporos Int. 2004;15(4):274–80. doi: 10.1007/s00198-003-1556-3. [DOI] [PubMed] [Google Scholar]
- 4.Järvinen TL, Sievänen H, Jokihaara J, Einhorn TA. Revival of bone strength: The bottom line. J Bone Miner Res. 2005;20(5):717–20. doi: 10.1359/JBMR.050211. [DOI] [PubMed] [Google Scholar]
- 5.Wang N, Zhao G, Zhang Y, et al. A network pharmacology approach to determine the active components and potential targets of curculigo orchioides in the treatment of osteoporosis. Med Sci Monit. 2017;23:5113–22. doi: 10.12659/MSM.904264. [DOI] [PMC free article] [PubMed] [Google Scholar]
- 6.Favia G, Tempesta A, Limongelli L, et al. A case of osteonecrosis of the jaw in a patient with Crohn’s disease treated with infliximab. Am J Case Rep. 2017;18:1351–56. doi: 10.12659/AJCR.905355. [DOI] [PMC free article] [PubMed] [Google Scholar]
- 7.Chin KY, Ima-Nirwana S. Calcaneal quantitative ultrasound as a determinant of bone health status: what properties of bone does it reflect? Int J Med Sci. 2013;10(12):1778–83. doi: 10.7150/ijms.6765. [DOI] [PMC free article] [PubMed] [Google Scholar]
- 8.Showalter C, Clymer BD, Richmond B, Powell K. Three-dimensional texture analysis of cancellous bone cores evaluated at clinical CT resolutions. Osteoporos Int. 2006;17(2):259–66. doi: 10.1007/s00198-005-1994-1. [DOI] [PubMed] [Google Scholar]
- 9.Herlidou S, Grebe R, Grados F, et al. Influence of age and osteoporosis on calcaneus trabecular bone structure: A preliminary in vivo MRI study by quantitative texture analysis. Magn Reson Imaging. 2004;22(2):237–43. doi: 10.1016/j.mri.2003.07.007. [DOI] [PubMed] [Google Scholar]
- 10.Lewiecki EM. Bone densitometry and vertebral fracture assessment. Curr Osteoporos Rep. 2010;8(3):123–30. doi: 10.1007/s11914-010-0018-z. [DOI] [PubMed] [Google Scholar]
- 11.Srinivasan B, Kopperdahl DL, Amin S, et al. Relationship of femoral neck areal bone mineral density to volumetric bone mineral density, bone size, and femoral strength in men and women. Osteoporos Int. 2012;23(1):155–62. doi: 10.1007/s00198-011-1822-8. [DOI] [PMC free article] [PubMed] [Google Scholar]
- 12.Abraham AC, Agarwalla A, Yadavalli A, et al. Multiscale predictors of femoral neck in situ strength in aging women: Contributions of BMD, cortical porosity, reference point indentation, and nonenzymatic glycation. J Bone Miner Res. 2015;30(12):2207–14. doi: 10.1002/jbmr.2568. [DOI] [PMC free article] [PubMed] [Google Scholar]
- 13.Popp AW, Windolf M, Senn C, et al. Prediction of bone strength at the distal tibia by HR-pQCT and DXA. Bone. 2012;50(1):296–300. doi: 10.1016/j.bone.2011.10.033. [DOI] [PubMed] [Google Scholar]
- 14.Legrand E, Chappard D, Pascaretti C, et al. Trabecular bone microarchitecture, bone mineral density, and vertebral fractures in male osteoporosis. J Bone Miner Res. 2000;15(1):13–19. doi: 10.1359/jbmr.2000.15.1.13. [DOI] [PubMed] [Google Scholar]
- 15.Vokes TJ, Giger ML, Chinander MR, et al. Radiographic texture analysis of densitometer-generated calcaneus images differentiates postmenopausal women with and without fractures. Osteoporos Int. 2006;17(10):1472–82. doi: 10.1007/s00198-006-0089-y. [DOI] [PubMed] [Google Scholar]
- 16.Pulkkinen P, Jämsä T, Lochmüller EM, et al. Experimental hip fracture load can be predicted from plain radiography by combined analysis of trabecular bone structure and bone geometry. Osteoporos Int. 2008;19(4):547–58. doi: 10.1007/s00198-007-0479-9. [DOI] [PubMed] [Google Scholar]
- 17.Dinçel VE, Sengelen M, Sepici V, et al. The association of proximal femur geometry with hip fracture risk. Clin Anat. 2008;21(6):575–80. doi: 10.1002/ca.20680. [DOI] [PubMed] [Google Scholar]
- 18.Eckstein F, Wunderer C, Boehm H, et al. Reproducibility and side differences of mechanical tests for determining the structural strength of the proximal femur. J Bone Miner Res. 2004;19(3):379–85. doi: 10.1359/JBMR.0301247. [DOI] [PubMed] [Google Scholar]
- 19.Le Bras A, Kolta S, Soubrane P, et al. Assessment of femoral neck strength by 3-dimensional X-ray absorptiometry. J Clin Densitom. 2006;9(4):425–30. doi: 10.1016/j.jocd.2006.08.007. [DOI] [PubMed] [Google Scholar]
- 20.Heiss C, Kern S, Malhan D, et al. A new clinically relevant T-score standard to interpret bone status in a sheep model. Med Sci Monit Basic Res. 2017;23:326–35. doi: 10.12659/MSMBR.905561. [DOI] [PMC free article] [PubMed] [Google Scholar]
- 21.Szulc P, Duboeuf F, Schott AM, et al. Structural determinants of hip fracture in elderly women: Re-analysis of the data from the EPIDOS study. Osteoporos Int. 2006;17(2):231–36. doi: 10.1007/s00198-005-1980-7. [DOI] [PubMed] [Google Scholar]
- 22.Han J, Hahn MH. Proximal femoral geometry as fracture risk factor in female patients with osteoporotic hip fracture. J Bone Metab. 2016;23(3):175–82. doi: 10.11005/jbm.2016.23.3.175. [DOI] [PMC free article] [PubMed] [Google Scholar]
- 23.Pulkkinen P, Eckstein F, Lochmüller EM, et al. Association of geometric factors and failure load level with the distribution of cervical vs. trochanteric hip fractures. J Bone Miner Res. 2006;21(6):895–901. doi: 10.1359/jbmr.060305. [DOI] [PubMed] [Google Scholar]
- 24.Faulkner KG, Wacker WK, Barden HS, et al. Femur strength index predicts hip fracture independent of bone density and hip axis length. Osteoporos Int. 2006l;17(4):593–99. doi: 10.1007/s00198-005-0019-4. [DOI] [PubMed] [Google Scholar]
- 25.Kazemi SM, Qoreishy M, Keipourfard A, et al. Effects of hip geometry on fracture patterns of proximal femur. Arch Bone Jt Surg. 2016;4(3):248–52. [PMC free article] [PubMed] [Google Scholar]
- 26.Zengin A, Pye SR, Cook MJ, et al. Ethnic differences in bone geometry between White, Black and South Asian men in the UK. Bone. 2016;91:180–85. doi: 10.1016/j.bone.2016.07.018. [DOI] [PMC free article] [PubMed] [Google Scholar]
- 27.Barrett-Connor E, Siris ES, Wehren LE, et al. Osteoporosis and fracture risk in women of different ethnic groups. J Bone Miner Res. 2005;20(2):185–94. doi: 10.1359/JBMR.041007. [DOI] [PubMed] [Google Scholar]
- 28.Fonseca H, Moreira-Gonçalves D, Coriolano HJ, Duarte JA. Bone quality: The determinants of bone strength and fragility. Sports Med. 2014;44(1):37–53. doi: 10.1007/s40279-013-0100-7. [DOI] [PubMed] [Google Scholar]
- 29.Nelson DA, Pettifor JM, Barondess DA, et al. Comparison of cross-sectional geometry of the proximal femur in White and Black Women from Detroit and Johannesburg. J Bone Miner Res. 2004;19(4):560–65. doi: 10.1359/JBMR.040104. [DOI] [PubMed] [Google Scholar]
- 30.Walker MD, Babbar R, Opotowsky AR, et al. A referent bone mineral density database for Chinese American women. Osteoporos Int. 2006;17(6):878–87. doi: 10.1007/s00198-005-0059-9. [DOI] [PubMed] [Google Scholar]
- 31.Lei SF, Chen Y, Xiong DH, et al. Ethnic difference in osteoporosis-related phenotypes and its potential underlying genetic determination. J Musculoskelet Neuronal Interact. 2006;6(1):36–46. [PubMed] [Google Scholar]
- 32.Liao EY, Wu XP, Deng XG, et al. Age-related bone mineral density, accumulated bone loss rate and prevalence of osteoporosis at multiple skeletal sites in Chinese women. Osteoporos Int. 2002;13(8):669–76. doi: 10.1007/s001980200091. [DOI] [PubMed] [Google Scholar]