

Abstract
Carcinoma‐associated mesenchymal stem cells (CA‐MSCs) are critical stromal progenitor cells within the tumor microenvironment (TME). We previously demonstrated that CA‐MSCs differentially express bone morphogenetic protein family members, promote tumor cell growth, increase cancer “stemness,” and chemotherapy resistance. Here, we use RNA sequencing of normal omental MSCs and ovarian CA‐MSCs to demonstrate global changes in CA‐MSC gene expression. Using these expression profiles, we create a unique predictive algorithm to classify CA‐MSCs. Our classifier accurately distinguishes normal omental, ovary, and bone marrow MSCs from ovarian cancer CA‐MSCs. Suggesting broad applicability, the model correctly classifies pancreatic and endometrial cancer CA‐MSCs and distinguishes cancer associated fibroblasts from CA‐MSCs. Using this classifier, we definitively demonstrate ovarian CA‐MSCs arise from tumor mediated reprograming of local tissue MSCs. Although cancer cells alone cannot induce a CA‐MSC phenotype, the in vivo ovarian TME can reprogram omental or ovary MSCs to protumorigenic CA‐MSCs (classifier score of >0.96). In vitro studies suggest that both tumor secreted factors and hypoxia are critical to induce the CA‐MSC phenotype. Interestingly, although the breast cancer TME can reprogram bone marrow MSCs into CA‐MSCs, the ovarian TME cannot, demonstrating for the first time that tumor mediated CA‐MSC conversion is tissue and cancer type dependent. Together these findings (a) provide a critical tool to define CA‐MSCs and (b) highlight cancer cell influence on distinct normal tissues providing powerful insights into the mechanisms underlying cancer specific metastatic niche formation. Stem Cells 2019;37:257–269
Keywords: Ovarian cancer, Mesenchymal stem cell, Tumor microenvironment, Hypoxia
This work describes a carcinoma‐associated mesenchymal stem cell (CA‐MSC) classifier that distinguishes CA‐MSCs from normal MSCs and cancer‐associated fibroblasts, providing an invaluable tool to study MSCs in cancer. Using this classifier, it was shown that tumor cells convert normal MSCs into cancer‐promoting CA‐MSCs in a tissue‐ and disease‐specific manner. These findings explain the controversies of pro‐ versus anti‐tumorigenic MSC effects, as function depends on MSC source and cancer subtype. This work is critical to metastatic niche formation, as conversion of normal MSCs into CA‐MSCs may dictate organ‐specific cancer tropism. Finally, these results offer insights on strategies to block the formation and function of CA‐MSCs.
Introduction
High grade serous ovarian cancer cells have a striking predilection for the intraperitoneal microenvironment with >70% of women presenting with intraperitoneal metastasis 1. The ovarian tumor microenvironment (TME) is not a passive backdrop but an active “organ” significantly altering cancer growth, survival, and spread 2, 3, 4. One critical component of the ovarian TME is the mesenchymal stem cell (MSC).
MSCs reside in nearly every tissue in the body including the bone marrow, omentum, and ovary, playing critical roles in wound healing and tissue repair 5, 6. Carcinoma‐associated MSCs (CA‐MSC) are distinct from normal tissue MSCs with a unique expression profile and protumorigenic functions 2, 7. CA‐MSCs fulfill all the criteria for MSCs posed by the International Society for Cellular Therapy (ISCT): (a) plastic adherence, (b) CD105, 90, 73 positivity and CD45, CD34, CD14, CD19, HLA‐DR negativity and (c) capacity to differentiate into at least two mesenchymal‐derived cell types 8. CA‐MSCs do not have malignant potential and do not harbor tumor‐associated mutational changes such as p53 mutations (found in >90% of all high grade serous ovarian tumors), thus CA‐MSCs are not derived directly from tumor cells 2, 9. As true stromal progenitor cells, CA‐MSCs differentiate into important stromal components such as cancer associated fibroblasts (CAFs) and adipocytes and may play a critical role in influencing the formation and function of the entire TME CA‐MSCs compared with normal tissue MSCs have a distinct expression profile characterized by high expression of Transforming Growth Factor Beta (TGF‐β) super family members which mediates their protumorigenic functions including tumor growth promotion enrichment of cancer stem‐like cells (CSCs) and induction of chemotherapy resistance 2, 7. Thus understanding and targeting CA‐MSCs has the potential to significantly impact ovarian cancer progression. Indeed, we recently described a tumor derived hedgehog (Hh) and CA‐MSC derived Bone Morphogenetic Protein 4 (BMP4) signaling loop which when interrupted led to drastic tumor cell chemo‐sensitization and regression of established cisplatin‐resistant tumors 7.
CA‐MSCs clearly influence the ovarian TME, however, a fundamental question remains unanswered: what is the origin of CA‐MSCs? As MSCs are highly migratory, CA‐MSCs could be a unique population of normal MSCs recruited to the TME or could be resident cells induced into a protumorigenic phenotype. Identifying the origin of CA‐MSCs is critical to targeting these pivotal stromal stem cells thus potentially disrupting the formation of the TME at an early stage when therapies may be most effective.
Previously, we reported that cancer cell secreted factors influence the expression profile of normal tissue MSCs 2. We thus hypothesized that the protumorigenic CA‐MSC phenotype may be induced via “cancer stimulation.” To date, only select expression changes and specific signaling pathways have been described in MSC: tumor cell interactions. We performed RNA sequencing of normal MSCs and CA‐MSCs and demonstrate global expression changes in CA‐MSCs. We then used RNASeq data to develop a six gene CA‐MSC classifier that accurately differentiates normal MSCs from ovarian CA‐MSCs. Using this classifier, we demonstrate that normal ovarian and normal omental derived MSCs (OV MSCs and OM MSCs) can be induced by ovarian cancer to become CA‐MSCs. Interestingly, the capacity to become a CA‐MSC is tissue source and cancer type dependent as MSCs from bone marrow (BM MSCs) fail to acquire ovarian cancer‐promoting properties; however, with breast cancer stimulation, BM MSCs develop a CA‐MSC phenotype strongly promoting breast cancer growth. Importantly, the CA‐MSC classifier accurately predicts CA‐MSC protumorigenic function including induction of tumor cell chemotherapy resistance, enhancement of CSCs and promotion of in vivo tumor growth. A combination of tumor secreted factors and other influences in the TME such as hypoxia appear to drive the CA‐MSC phenotype.
Materials and Methods
Tissue Harvesting, Culture
Patients samples were obtained in accordance with protocols approved by the University of Michigan's IRB (HUM0009149) and University of Pittsburgh's IRB (PRO17080326). Tissue was processed for RNA isolation as previously described 20. MSCs were isolated as previously described 5. Briefly, CA‐MSCs were derived from surgical resection of human ovarian cancer involving the ovary and/or omental metastatic deposits. Normal omental, normal ovary, and normal bone marrow MSCs were derived from surgical samples of women undergoing surgery for benign indications or benign bone marrow biopsy (provided as a kind gift from Dr. M. Wicha). Cells were plated in supplemented MEBM, MSCs were selected for plastic adherence and cell surface marker expression (CD105, CD90, CD73, CD44 positive; CD34, CD24, CD45 negative). Adipocyte, osteocyte, and chondrocyte differentiation capacity was verified (following guidelines presented by the ISCT on the minimal criteria for defining multipotent mesenchymal stem cells 9). MSCs were maintained in culture as previously described and used at passage 8 or below 5 (see supplemental methods for further details). Endometrial and pancreatic CA‐MSCs were obtained as above and as a kind gift from Dr. D. Simeone. Ovarian and omental fibroblasts were obtained from cancer tumor samples plated for plastic adherence and grown with connective tissue growth factor (100 ng/ml) and ascorbic acid (50 μg/ml) for 2 weeks (as described by Lee et al. 27). Fibroblast differentiation was verified by expression of FAP and FSP. Ovarian cancer cell lines SKOV3, CAOV‐3, and PEO1 were obtained from ATCC. All cell lines were tested and verified negative for mycoplasma (last test December 2017). Cancer cell lines were verified by ATCC.
In Vitro Indirect/Direct Coculture, Normoxic, and Hypoxic
Normal MSCs were grown in coculture (indirect, direct ± hypoxia) with GFP+ SKOV3 or CAOV3 or PEO1 cells. For indirect coculture, 24 mm polystyrene 0.4 μm transwell inserts with 5 × 10⁴ MSCs on bottom, 5 × 10⁴ tumor cells on top were used. For direct coculture, 2 × 10⁵ MSCs and 1 × 10⁵ tumor cells were mixed in a T75 cm dish. MSCs grown alone at equivalent cell numbers served as control. Cocultures were performed for 5 days. Cells were grown at 21% O2 for normoxic experiments and 1% O2 for hypoxic experiments (Hypoxygen H35 Workstation, HypOxygen, Fredrick, MD, USA). Cells were sorted for mT+, GFP− MSCs after direct coculture with >99% purity with double sort as needed. For all experiments, each tumor cell line was used in a separate MSC coculture. RNA expression changes and resulting classifier score was calculated separately for each experiment and values were averaged with SEM reported for each coculture condition.
In Vivo MSC and Tumor Cell Cogrowth
mT‐labeled MSCs + GFP‐labeled CAOV3 or PEO1 cells in a 1:1 ratio (0.5 × 10⁶ cells each) were injected into the bilateral axilla of NSG mice. NSG (NOD.Cg‐Prkdc scid Il2rg tm1Wjl/SzJ) mice were used for all experiments (female, age >6 weeks). mT‐labeled BM MSCs + GFP‐labeled MDA‐MB‐231 breast cancer cells were also injected. Upon reaching 300–500 mm3 (modified ellipsoid formula [L * W 2]/2) tumors were excised/processed into single cell suspensions and fluorescence‐activated cell sorting (FAC) sorted to isolate mT+/GFP− MSCs. MSCs were characterized for expression markers and differentiation capacity as above. IV‐CS OM MSCs or IV‐CS OV MSCs were mixed with CAOV3 or PEO1 cells in a 1:1 ratio (0.5 × 10⁶ cells each) and injected into the bilateral axilla of NSG mice. Similarly, breast cancer IV‐CS BM MSCs were mixed with MD‐MBA‐231 cells and injected as above. Control MSCs and patient derived CA‐MSCs were grown with CAOV3, PEO1, or MDA‐MB‐231 cells as comparators. Five mice with bilateral tumor per group (n = 10 tumors/group).
In Vitro Chemotherapy Resistance Assays
GFP+ CAOV3 or PEO1 cells were grown ±MSCs (1:1 ratio, 20,000 total cells/24‐well dish). I‐CS, D‐CS, IHyp‐CS, DHyp‐CS, or IV‐CS BM MSCs, OM MSCs and OV MSCs were compared with control MSCs and CA‐MSCs. Tumor cells alone (20,000 cells/well) served as control. Cisplatin treatment lasted 24–48 hours. Viable GFP‐tumor cells were analyzed via FACS using propidium iodide.
Tumor Sphere Assay
GFP+ CAOV3 or PEO1 cells were grown ±IV‐CS OM MSCs (1:1 ratio, 2,000 cells total) in 48‐well nonadherent dishes in serum‐free supplemented MEBM. Control MSCs or CA‐MSCs were comparators. After 7 days, GFP+ spheres were counted using fluorescent microscopy (Olympus BX41 Olympus, Waltham, MA, USA). Spheres were dissociated with trypsin and mechanical dispersion and FACs analyzed to quantify GFP+ tumor cells.
RNA Sequencing and Data Processing
RNA was extracted from four OM‐MSC samples and 10 CA‐MSC samples per the TRIzol reagent manufacturer's extraction protocol (Invitrogen, Carlsbad, CA). Two micrograms of total RNA/sample was used for library preparation using the TruSeq RNA Sample Preparation v2 kit (Illumina San Diego, CA, USA) per the manufacturer's instructions using the Low Throughput protocol. Libraries were sequenced as paired‐end 100 bp on a HiSeq2000 instrument (Illumina San Diego, CA, USA) at the Peter MacCallum Cancer Centre. Each barcode‐separated lane of sequencing data was aligned to the human reference genome and transcriptome (GRCh37) using Bowtie 2 version 2.2.3 28 and TopHat2 v2.0.13 29. Between 64,000,000 and 113,000,000 paired reads were aligned to the transcriptome (supplemental methods). Estimation of gene abundance was carried out using HTSeq 30 which were log normalized prior to downstream analysis using the R‐package Limma 31. Specifically, differentially expressed genes between the OM‐MSC and CA‐MSC were identified, using the parameters of a log fold change (logFC) greater than ±2 and a p‐value <.05. The RNAseq data has been deposited to NCBI's Gene Expression Omnibus (GEO) and are accessible through GEO Series accession number GSE118624 (https://www.ncbi.nlm.nih.gov/geo/query/acc.cgi?acc=GSE118624).
CAMSC Classifier Creation
Gene expression heatmaps for CA‐MSC and OM‐MSC were created and compared using the “heatmap” package. To statistically evaluate the degree of data variability, principal components analysis (PCA) was run on the top‐50 univariate p‐value genes using the “PCA” and “fviz_pca” functions in R, with an ellipse alpha = 0.95 for graphical visualization. The signal to discriminate between the CA‐MSC and OM‐MSC groups was confirmed by hierarchical clustering analysis to optimize the Ward distance over k = 2 groups using packages “FactoMineR” and “factoextra.” To further reduce the data, gene set enrichment analysis (GSEA) was performed using the Sergushichev algorithm and corresponding “fgsea” package 32. We provided the “CA‐MSC” or “OM‐MSC” class and RNAseq data for each of the 14 individuals. Enrichment values were created over 10,000 permutations, and an adjusted p‐value of .05 revealed 27 differentially enriched genes. These 27 differentially enriched genes identified from RNAseq were verified via independent qRT‐PCR on 10 additional independent CA‐MSC and 8 independent OM‐MSC samples (2 of the 27 genes, CLND1 and EVPL, failed independent validation and were excluded yielding a final 25‐gene set). Using the qRT‐PCR data, we used cross‐validated L1‐norm constrained logistic regression 33 (CV‐LASSO) to select a predictive subset of genes to discriminate between the CA‐MSC and non‐CA‐MSC groups. Using the “glmnet” package, we minimized the cross‐validation misclassification error to select the largest optimum L1‐norm constraint value lambda and extracted the nonzero classifier model coefficients from the full PCR data. Experimental predictions were generated by fitting validation experiment PCR data to this CV‐LASSO generated model and comparing predicted and true cancer cell exposures. The threshold for assignment from the logistic regression was 0.5. All programming was performed in R 3.1.0 34.
Statistics
All in vitro experiments were repeated independently at least three times with triplicate samples per experiment unless otherwise stated. Statistical significance was evaluated using a 2‐sided Student's t test. For all experiments, α = 0.05. For animal studies, n = 10 per group based on final tumor volume of control animals of ~1,000 mm3 with an expected standard deviation of 30%.
Nonlinear regression analysis of tumor growth over time was performed for each group and curves compared with determine statistical significance. In all figures, error bars represent standard error of the mean of composite values from independent experiments.
Study Approval
Animal studies were performed with approval of the University Committee on Use and Care of Animals of the University of Michigan. Patients’ samples were obtained in accordance with a protocol approved by the University of Michigan's IRB (HUM0009149) and University of Pittsburgh's IRB (PRO17080326). Written informed consent was received from participants prior to inclusion in the studies. Recombinant DNA work was performed in accordance with the NIH Guidelines for Research Involving Recombinant or Synthetic Nucleic Acid Molecules.
Results
Creation of an Ovarian CA‐MSC Classifier
We previously described a unique CA‐MSC expression profile based on an 84‐gene quantitative reverse transcription polymerase chain reaction (qRT‐PCR) microarray expression platform 2. To comprehensively define the CA‐MSC expression profile, we performed RNA sequencing on CA‐MSCs derived from (a) surgical resection of omental metastatic deposits of ovarian cancer (largely high grade serous ovarian cancer) and (b) normal omental derived MSCs (MSCs derived from omental tissue of women undergoing benign gynecologic surgery). K‐means clustering and principal components regression demonstrated clear differences in the expression patterns of CA‐MSCs versus OM MSCs. Figure 1 shows the unsupervised hierarchical clustering of CA‐MSC versus OM MSCs RNAseq data (Fig. 1A), principle component analysis of RNAseq data (Fig. 1B), and correlation plotting of gene enrichment scores of the top 25 differentially expressed genes from RNAseq analysis (green dots = positive correlations and red dots = negative correlations; Fig. 1C). Consistent with our previous findings 2, 7, BMP2, platelet‐derived growth factor receptor beta (PDGFRβ), leukemia inhibitor factor and T‐box 5 (TBX5) were significantly differentially expressed in CA‐MSCs versus OM MSCs in both the RNAseq data (Fig. 1C) and independent qRT‐PCR validation (Fig. 1D).
Figure 1.
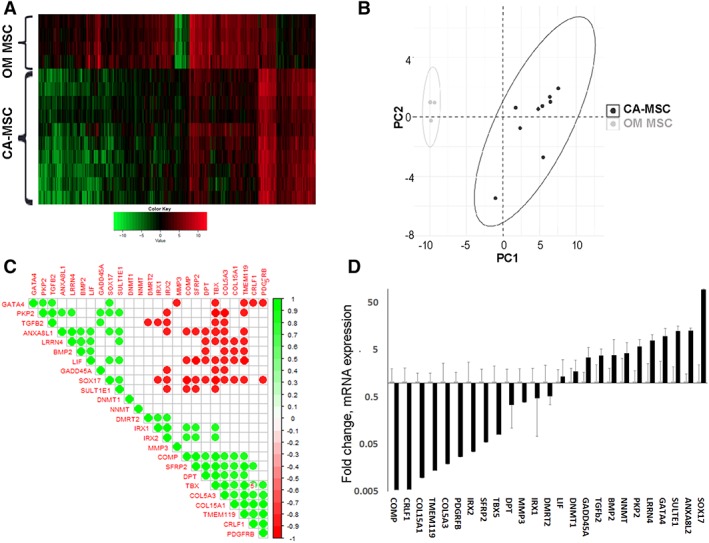
Carcinoma‐associated mesenchymal stem cells (CA‐MSCs) have a unique expression profile compared with normal MSCs. (A): Unsupervised hierarchical clustering of RNAseq reveals distinct expression profiles for omental derived MSCs (OM‐MSCs) and CA‐MSCs. Clustered heatmap shown with green representing downregulated RNA expression and red representing upregulated RNA expression. (B): Principal component analysis of RNAseq data comparing normal OM MSCs to CA‐MSCs demonstrating broad differences in expression patterns. Each dot corresponds to one individual sample (10 CA‐MSC samples and four OM MSC samples, dots may overlie each other). Ellipses represent centroids from kmeans clustering. (C): Correlation plot for gene enrichment scores of top 25 differentially expressed genes from RNAseq analysis. Green represents positive correlation where red represents negative correlation. Associations with p ≤ .001 are shown. (D): Independent validation of expression differences in the top 25 differentially expressed genes via qRT‐PCR. Fold change in expression compared with OM MSCs, error bars = SEM.
RNA sequencing data was used to determine differential gene expression enrichment via the Sergushichev fast algorithm in CA‐MSCs compared with OM MSCs. At the <.05 adjusted p value level, 27 genes were identified which discriminated between CA‐MSCs and OM MSCs. Individual RT‐PCR was performed on an additional 10 independent patient CA‐MSCs and 8 independent patient OM MSCs for each gene in the gene enrichment set (GES) to validate the RNAseq data. Two genes, CLND1 and EVPL, failed independent validation and were excluded resulting in a final 25‐gene GES (Fig. 1C, 1D). The CA‐MSC and OM MSC independently validated expression data (from the 10 independent patient CA‐MSCs and 8 independent patient OM MSCs above), represented as the delta CT value of the mRNA expression compared with GAPDH, was divided into a testing and training group. Samples were randomly divided using random number (0 or 1) generation. Each group contained five CA‐MSCs and four OM MSCs. Cross‐validated constrained (LASSO) logistic regression modeling was applied. This method created a parsimonious model seeking to minimize misclassification error that predicts the probability of being a CA‐MSC versus MSC (Supporting Information Fig. S1). The sum of regression coefficients*gene PCR expression is logistically transformed yielding a score between 0 and 1 of how likely the sample is a “CA‐MSC.” Scores closest to 1 have the highest probability of being a CA‐MSC and scores closest to 0 have the lowest probability of being a CA‐MSC (or conversely, the most likely to be a normal MSC). Scores close to 0.5 are the least reliably interpreted due to the shape of the logistic curve and potential for small noise in the model translating to large change in score. The final model incorporated expression data from six genes: Annexin A8‐like protein 2 (ANXA8L2), Collagen Type XV Alpha 1 Chain (COL15A1), Cytokine Receptor Like Factor 1 (CRLF1), GATA Binding Protein 4 (GATA4), Iroquois Homeobox 2 (IRX2), and TGF‐β2. A 5‐gene versus 6‐gene LASSO model without and with TGF‐β had equal misclassification error. The TGF‐β super family of proteins is functionally important in MSC biology and BMP 2 and 4 are particularly important in tumor cell/CA‐MSC interactions; thus, we choose to leave this gene incorporated given equivalency in model performance. We, henceforth, refer to this model as the CA‐MSC classifier.
We tested the robustness of the classifier in distinguishing independent OM MSC and CA‐MSC samples. The classifier accurately identified five new independent patient OM MSC samples as “not a CA‐MSC” with an average score of 0.04 and eight new independent patient CA‐MSC samples as “CA‐MSCs” with an average classifier score >0.99. With an average score of >0.99 (n = 3 patients) CA‐MSCs derived from primary ovary tumors (rather than metastatic deposits) were also accurately classified as “CA‐MSCs.” We further tested the classifier using normal MSCs from ovary and bone marrow. Bone marrow MSCs and ovary MSCs (n = 3 each), with classifier scores of 0.16 and 0.18, respectively, were accurately classified as “not CA‐MSCs.” With an inherent threshold value of 0.5, the CA‐MSC classifier achieved 100% accuracy. Moreover, although the model was generated with a 0.5 threshold, the extremes (closest to 1 or 0) carry the most precision and are therefore the most reliable. The greatest variability exists surrounding the 0.5 threshold therefor classifier scores around this number are the least reliable. To provide easier determination of what is reliably predicted as a CA‐MSC versus normal MSC, we choose to set a boundary at 0.96 which is two standard deviations below the average CA‐MSC score (average = 0.99 and standard deviation = 0.015) as reliably a CA‐MSC. Conversely, for normal MSCs (omentum, ovary, and BM), the score 2 standard deviations above the average was 0.3 (average = 0.11 and standard deviation = 0.09) and this was used as an upper boundary to reliably classify a normal MSC.
We also characterized CA‐MSCs from endometrial cancer (n = 2 patients) and pancreatic cancer (n = 3 patients) which were classified as “CA‐MSCs” with scores of 0.96 and 0.99, respectively. Confirming MSCs are distinct from cancer associated fibroblasts (CAFs), ovarian and omental tumor tissue derived CAFs (n = 2, one from omental tissue, one from ovarian tissue) yielded a classifier score of 0.56 which has a low probability of reflecting either a normal MSC or a CA‐MSCs profile (Fig. 2C).
Figure 2.

Development of a carcinoma‐associated mesenchymal stem cells (CA‐MSCs) classifier to distinguish CA‐MSCs versus normal MSCs. (A): The CA‐MSC classifier contains genes (bolded) from distinct gene enrichment scores clusters demonstrating representation of nonoverlapping sets of differential gene expression. (B): Final logistic regression model with CA‐MSC classifier scores ranging from 0 to 1 distinguishing normal MSCs versus CA‐MSCs. B1 = −0.00622, B2 = 0.175026, B3 = 0.886027, B4 = −0.34594, B5 = 0.416952, B6 = −0.00824. (C): Validation of the CA‐MSC classifier using independent samples from multiple patient‐derived tissues, error bars = SEM.
Ovarian Cancer Cells Partially Induce OM and OV MSCs to Assume a CA‐MSC Expression Profile
To determine if cancer cells reprogram normal MSCs into CA‐MSCs, we first performed in vitro direct and indirect coculture experiments using normal MSCs and ovarian cancer cells. Normal BM MSCs, OM MSCs, or OV MSCs from three different patients per cell type were cultured with three ovarian cancer cell lines—SKOV3 (endometrioid), CAOV3, and PEO1 (high grade serous). Cocultured MSCs were isolated and mRNA expression applied to the CA‐MSC classifier. Previously validated differentially expressed mRNAs were also assessed (Supporting Information Fig. S2) 2. Although some genes showed altered expression (Fig. 3A–3F), indirect coculture of MSCs and tumor cells did not induce a CA‐MSC expression profile in any of the MSC populations with classifier scores ranging from 0.12 to 0.22 (SEM < 0.09).
Figure 3.
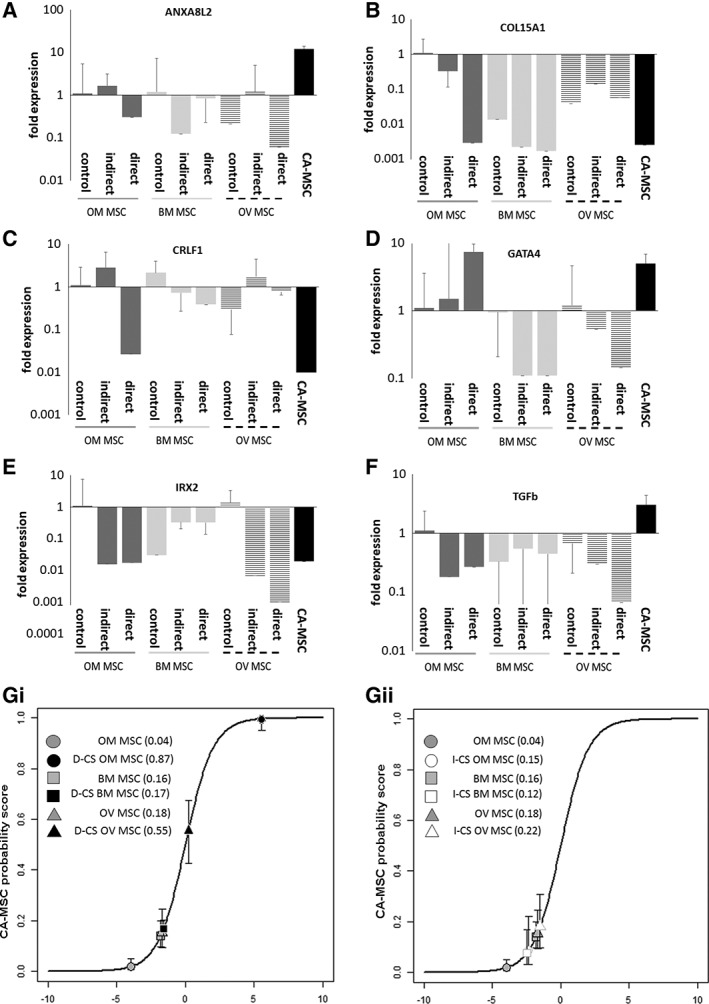
Indirect and direct cancer stimulation of normal mesenchymal stem cells (MSCs) with ovarian cancer cell coculture partially induces the carcinoma‐associated (CA)‐MSC expression profile. Bone marrow MSCs, omental MSCs and ovarian MSCs underwent indirect cancer stimulation (I‐CS) or direct cancer stimulation (D‐CS) with ovarian cancer cells. qRT‐PCR expression of genes in the CA‐MSC classifier were assessed: (A) ANAX8, (B) COL15A1, (C) CRLF1, (D) GATA4, (E) IRX2, (F) TGF‐β (fold expression changes compared with OM MSC control) and expression data was applied to the CA‐MSC classifier: (G): Average CA‐MSC classifier scores across three independent experiments with (i) I‐CS and (ii) D‐CS. Error bars = SEM.
We next determined if direct coculture, allowing both secreted and cell‐contact dependent interactions, could induce the formation of a CA‐MSC. mTomato (mT) labeled BM MSCs, OM MSC, or OV MSCs were cocultured with ovarian cancer cells, FACS isolated and mRNA expression applied to the CA‐MSC classifier. Although more genes approximated expression observed in CA‐MSCs, cancer cell stimulation via direct coculture demonstrate limited induction of a CA‐MSC phenotype with a classifier scores of 0.17 (SEM = 0.03) for BM MSC, and 0.55 (SEM = 0.12) for OV MSC. Direct cancer stimulation of OM MSCs (D‐CS OM MSC) most closely approximated a CA‐MSC, with a classifier score of 0.87 (SEM = 0.13). Several critical components of the signature were missing including changes in ANXA8L2 and TGF‐β (Figs. 3 and 5C).
Figure 5.

In vivo cancer stimulation (IV‐CS) effectively induces the carcinoma‐associated mesenchymal stem cell (CA‐MSC) expression profile. (A): qRT‐PCR expression analysis of IV‐CS omental (OM) MSC and IV‐CS ovarian (OV) MSCs demonstrating the development of a CA‐MSC expression profile (fold expression changes compared with OM MSC control). (B): Average CA‐MSC classifier scores of IV‐CS OM MSC and IV‐CS OV MSCs. Error bars = SEM. (C): Composite analysis of cancer stimulated MSCs and resultant CA‐MSC classifier scores. Values represented as average score with SEM.
Hypoxia Enhances the Induction of a CA‐MSC
We considered what other factors in the TME may influence the induction of a CA‐MSC. One hallmark of the TME 10, 11 which impacts normal MSC morphology, proliferation, and differentiation is hypoxia 12. Hypoxia is known to increase TGF‐β signaling and GATA4 expression, genes upregulated in CA‐MSCs 13, 14, 15, 16, 17. CA‐MSCs demonstrated higher transcript and protein levels of hypoxia inducible factor alpha (HIF1α) and indirect cancer stimulation induced HIF1α expression in OM MSCs (Fig. 4B). Interestingly, OM MSCs and CA‐MSCs grew slower and spontaneously formed spheroids under hypoxic conditions (1% oxygen; Fig. 4A). We tested the impact of hypoxia on the induction of a CA‐MSC profile in vitro. Indirect and direct cocultures as described above were repeated under hypoxic (1% oxygen) conditions. MSCs were isolated and mRNA expression data was applied to the CA‐MSC classifier. Hypoxia alone did not significantly alter normal MSCs (classifier score 0.2 [SEM 0.05]). Indirect and direct coculture under hypoxic conditions (IHyp‐CS, DHyp‐CS, respectively) yielded classifier scores of: 0.08 for IHyp‐CS BM MSC and 0.03 for DHyp‐CS BM MSC, 0.63 for IHyp‐CS OM MSC and 0.86 for DHyp‐CS OM MSC, and 0.35 for IHyp‐CS OV MSC and 0.95 for DHyp‐CS OV MSC (Figs. 4 and 5C). Thus, hypoxia enhanced CA‐MSC induction in OV and OM MSC, but not BM MSC.
Figure 4.

Hypoxia alters the behavior of MSCs and enhances the cancer‐mediated induction of a carcinoma‐associated mesenchymal stem cell (CA‐MSC) expression profile. (A): Omental (OM) MSCs and CA‐MSCs (i) grow slower and (ii) form sphere‐like structures when grown under hypoxic conditions (1% O2). (B): CA‐MSCs have higher (i) mRNA and (ii) protein levels of HIF1α versus OM MSCs and HIF1α is induced with cancer cell coculture. (C–E): Hypoxic indirect or direct cancer stimulation of bone marrow MSCs, OM MSCs and ovarian MSCs with ovarian cancer cell coculture yielded mRNA expression changes of genes in the CA‐MSC classifier: (C) ANAX8, (D) COL15A1, (E) CRLF1, (F) GATA4, (G) IRX2, (H) TGF‐β (fold expression changes compared with OM MSC control). (I): Average CA‐MSC classifier scores across three independent experiments with (i) indirect hypoxic cancer stimulation (Ihyp‐CS) and (ii) direct hypoxic cancer stimulation (Dhyp‐CS). Error bars = SEM.
In Vivo Coculture Effectively Reprograms Normal MSC into CA‐MSC
We next determined if in vivo growth of normal MSCs with ovarian cancer cells fully induces a CA‐MSC expression profile. mTomato labeled OM, OV and BM MSCs were grown with GFP‐labeled CAOV3 or PEO1 tumor cells in mouse xenografts. Tumors were resected and MSCs reisolated (via FACS on mT+ cells). Reisolated MSCs were analyzed to confirm they still met MSC‐defining criteria outlined by the ISCT 8 (CD105+,90+, 73+, 44+;CD45−, 34−, 14−, 19−) and capacity to differentiate into adipocytes, osteocytes and chondrocytes. Less than 1% of cells expressed fibroblast surface protein (FSP) or fibroblast activation protein (FAP) verifying absence of fibroblast contamination (Supporting Information Fig. S4). To ensure no tumor contamination or malignant transformation, 1 × 10⁶ reisolated MSCs were injected into mice and monitored for tumor growth for 6 months without tumor initiation.
In vivo cancer stimulation (IV‐CS) of OM and OV MSCs resulted in induction of a CA‐MSC profile (Fig. 5 and Supporting Information S2) with a IV‐CS OM MSC classifier score of 0.98 (SEM = 0.01) and IV‐CS OV MSC classifier score of 0.97 (SEM = 0.02). TGF‐β expression changes did not reach CA‐MSC levels; however, in contrast, BM MSCs inhibited xenograft growth when mixed with CAOV3 or PEO1 tumor cells and no viable BM MSCs could be reisolated.
CA‐MSC Classification Corresponds with Protumorigenic CA‐MSC Functions
The distinct expression profile of CA‐MSCs corresponds with unique protumorigenic functions: (a) CA‐MSCs increase the CSC pool as marked by increased levels of ALDH and enhanced tumor sphere formation 2, and CA‐MSCs enhance (b) tumor growth and (c) chemotherapy resistance 7. Therefore, we determined if cancer stimulated OM MSCs classified as CA‐MSCs also developed CA‐MSC‐associated protumorigenic functions. We first tested the effects of cancer‐stimulated OM MSCs on chemotherapy resistance. Cancer stimulated OM MSCs were grown with GFP+ PEO1 cells (BRCA1 mutant platinum‐sensitive line) or GFP+ CAOV3 cells (BRCA wild‐type, intermediate platinum‐sensitivity) 18, 19 and treated with cisplatin. Cisplatin treatment of cancer cells grown alone, with patient derived CA‐MSCs or with control OM MSCs (OM MSCs without cancer stimulation) served as comparators. Control OM MSCs did not significantly impact cancer cell cisplatin sensitivity whereas cancer stimulated OM MSCs enhanced cancer cell cisplatin resistance to a degree proportional to their CA‐MSC classifier score (Fig. 6). I‐CS OM MSCs (classifier score of 0.15) did not significantly enhance CAOV3 or PEO1 chemotherapy resistance (Fig. 6A). However, IHyp‐CS OM MSCs (classifier score of 0.63) began to enhance chemotherapy resistance, especially at higher concentrations of cisplatin (Fig. 6A). Similarly, D‐CS OM MSCs and DHyp‐CS OM MSCs (classifier scores of 0.87 and 0.86, respectively) enhanced chemotherapy resistance (Fig. 6B). IV‐CS OM MSCs (classifier score of 0.98) enhanced the chemo‐resistance of platinum sensitive PEO1 cells to the greatest extent, equivalent to patient derived CA‐MSC‐induced chemotherapy resistance (Fig. 6C, 6D). DHyp‐CS BM MSCs which did not develop a CA‐MSC expression profile (classifier score of 0.03) likewise failed to significantly enhance chemotherapy resistance of cancer cells (Fig. 6D). Alternatively, DHyp‐CS OV MSCs which acquired a near‐CA‐MSC expression profile (classifier score of 0.95) increased tumor cell chemotherapy resistance to levels equivalent to patient derived CA‐MSCs (Fig. 6D). This indicates that the CA‐MSC classification of cancer stimulated MSCs accurately corresponds with the ability to induce cancer cell chemotherapy resistance and supports the importance of the CA‐MSC expression profile in imparting CA‐MSC associated chemotherapy resistance.
Figure 6.

Carcinoma‐associated mesenchymal stem cell (CA‐MSC) classification of cancer stimulated MSCs corresponds with induction of tumor cell chemotherapy resistance. Cancer stimulated omental (OM) MSCs, bone marrow (BM) MSCs and ovarian (OV) MSCs combined with GFP‐labeled CAOV3 or PEO1 cancer cells were treated with cisplatin and viable GFP‐tumor cells were assessed via FACs. (A): Indirect hypoxic cancer stimulation (Ihyp‐CS) enhances OM MSC‐mediated induction of (i) CAOV3 and (ii) PEO1 chemotherapy resistance. (B): Direct hypoxic cancer stimulation (Dhyp‐CS) further enhances OM MSC‐mediated induction of (i) CAOV3 and (ii) PEO1 chemotherapy resistance. (C): in vivo cancer stimulation (IV‐CS) enhances OM MSC‐mediated induction of PEO1 chemotherapy resistance comparable to effects seen with CA‐MSCs. (D): Composite analysis of viable PEO1 cells ± cancer stimulated MSCs demonstrating the induction of cancer cell chemotherapy resistance is proportional to the development of the CA‐MSC expression profile (as measured via the CA‐MSC classifier score). (E): in vivo cancer stimulated OM MSCs (IV‐CS OM MSC) grown with GFP‐tumor cells (PEO1) increase (E) the number of tumor spheres and (F) the total number of nonadherent tumor cells (quantified via sphere dissociation). Error bars = SEM. (G): Representative pictures of (i) tumor spheres without MSCs and (ii) tumor cells mixed with IV‐CS OM MSCs.
We next investigated if cancer stimulated MSCs impact ovarian CSCs by testing ovarian tumor sphere growth. MSCs were mixed with GFP‐CAOV3 or GFP‐PEO1 tumor cells in nonadherent conditions and tumor spheres counted. Tumor spheres grown with MSCs demonstrated mixed cellularity with GFP+ tumor cells growing within/surrounded by GFP− MSCs (Fig. 6G). We observed that, relative to no MSC controls and OM MSC controls, IV‐CS OM MSCs significantly enhanced tumor sphere numbers, equivalent to patient derived CA‐MSCs (Fig. 6E). To confirm these results, spheres were dissociated and the number of GFP+ tumor cells assessed via FACs. IV‐CS OM MSCs likewise enhanced the absolute number of viable tumor cells (Fig. 6F).
Ultimately, the primary functional feature of a CA‐MSC is the ability to promote tumor growth in vivo 2, 7. Therefore, we tested if IV‐CS OM MSCs increase in vivo tumor growth similar to patient derived CA‐MSCs. IV‐CS OM MSCs were mixed with CAOV3 cells to create murine xenografts. Patient derived CA‐MSCs or control OM MSCs were mixed with CAOV3 cells as control xenografts. Consistent with our previous results, patient derived CA‐MSC containing tumors grew significantly faster and larger than tumors containing control OM MSC or control OV MSC or tumor cells alone (Fig. 7). Both IV‐CS OM MSC and IV‐CS OV MSCs promoted tumor growth at a rate equal or greater than patient derived CA‐MSCs (Fig. 7B). These findings were repeated using PEO1 cancer cells likewise demonstrating growth enhancement with IV‐CS OM MSCs (Supporting Information Fig. S3).
Figure 7.

In vivo cancer stimulated omental mesenchymal stem cells (OM MSCs) increase ovarian cancer cell growth in a murine xenograft model. (A): In vivo cancer stimulation (IV‐CS) OM MSCs mixed with CAOV3 tumor cells in NSG mice significantly enhance the initiation and growth rate of CAOV3 tumors to levels equivalent to patient derived CA‐MSCs. (B): IV‐CS OV MSCs likewise enhance CAOV3 tumor growth whereas bone marrow (BM) MSCs inhibit CAOV3 tumor growth. (C): BM‐MSCs stimulated with breast cancer cells (IV‐CS BM MSCs) enhance breast cancer tumor initiation and growth. Error bars = SEM.
Collectively, our results indicate that cancer stimulated‐induction of a CA‐MSC expression profile also conveys protumorigenic functional properties including tumor cell chemotherapy resistance, CSC enhancement and acceleration of in vivo tumor growth.
BM MSCs Do Not Become CA‐MSCs with Ovarian Cancer Stimulation but Demonstrate Growth Promoting Properties after Breast Cancer Stimulation
Unlike OM and OV MSCs, BM MSCs fail to acquire a CA‐MSC expression profile or tumor promoting properties with any type of ovarian cancer cell stimulation. In fact, BM MSCs decreased ovarian xenograft growth (Fig. 7B) and could not be reisolated from xenografts. As ovarian cancer rarely metastasizes to the bone, we investigated whether triple negative breast cancer, which frequently metastasizes to the bone but genetically resembles ovarian cancer, could be promoted by BM MSCs. We performed in vivo cancer stimulation (IV‐CS) of BM MSCs with MDA‐MB‐231 cells (triple negative breast cancer cell line). BM MSCs mixed with breast cancer cells readily formed tumors but initially did not enhance xenograft growth compared with tumor cells alone (Fig. 7C). The mixed cellularity xenografts were harvested and BM MSCs were reisolated, propagated and characterized as above. The IV‐CS BM MSCs were mixed with MDA‐MB‐231 cells to form xenografts. Although the CA‐MSC classifier score of breast cancer IV‐CS BM MSC was only 0.17, IV‐CS BM MSCs significantly enhanced breast tumor initiation and growth. This highlights the heterogeneity among sources of MSCs and their potential to develop a tumor‐supporting phenotype which may be cancer‐type specific.
Discussion
Creation of a CA‐MSC Classifier
Unlike previous reports which focus on select molecular changes in tumor‐associated MSCs, here we report the global expression differences between normal and cancer associated MSCs. We developed a robust algorithm which condenses these global changes into a 6‐gene classifier which accurately distinguished not only ovarian cancer, but also endometrial and pancreatic derived CA‐MSCs from normal MSCs. The classifier also distinguishes CA‐MSCs from CAFs potentially clarifying another problematic area in the scientific literature. This classifier has the potential to be critical in the study of CA‐MSCs allowing rapid, low cost validation.
CA‐MSC are Derived from Normal MSCs Exposed to the TME
Using the CA‐MSC classifier we addressed the important question of what is the origin of CA‐MSCs? Several studies have suggested MSCs migrate to sites of cancer from the bone marrow. However, although our studies cannot rule out rare MSC populations migrating to the TME, using labeled MSCs derived from various tissue sources stimulated with cancer cells in vivo we definitively show that local abdominal tissue derived MSCs can be reprogrammed to a CA‐MSC. Even in an immunodeficient model, cancer stimulation effectively created a CA‐MSC with the only difference versus patient derived CA‐MSCs being TGF‐β2 expression which may indicate immune cells are important to drive this change. Interestingly, the MSC source is critical to the potential to support tumor growth as BM MSCs could only support breast cancer and not ovarian cancer growth. This differential capacity to become a CA‐MSC is of great importance, implying that MSCs may be critical to disease‐specific metastatic tropism. For example, ovarian cancer rarely metastasizes to the bone instead primarily residing within the intra‐abdominal cavity and particularly in omental fat. Furthermore, there is a clear tropism for ovarian cancer cells to colonize the ovary, especially considering most high grade serous ovarian cancers arise in the fallopian tube and the ovary may be the first metastatic site. In contrast, breast cancer readily metastasizes to bone and the ability of breast cancer cells to influence BM MSCs to promote growth may allow metastatic colonization of the bone niche. Although clearly much more work is needed to fully understand this tissue and cancer type specificity, it is an intriguing area which may reveal critical insights into the disease‐specific patterns of metastasis. This tissue specificity may also explain the divergent reports in the literature regarding MSCs supporting or inhibiting cancer growth as results will depend on the pairing of MSC source and cancer type. Reports of BM MSCs supporting prostate and breast cancer growth but inhibiting ovarian cancer growth 20, 21, 22 are consistent with this concept.
Understanding the origin of CA‐MSCs may also have significant therapeutic implications. Given the migratory activity and cancer tropism of MSCs, several studies have proposed using MSCs as therapeutic vehicles 23, 24, 25, 26. Our study suggests the source of MSCs in these studies is critical—BM MSCs could be effectively used in ovarian cancer but may be a poor source of MSCs for breast cancer studies.
Conclusion
Ultimately, discovering the origin of CA‐MSCs is critical to understanding and eventually targeting the development of the protumorigenic microenvironment. Mechanistically unraveling how normal MSCs become CA‐MSCs will allow development of treatments to prevent or reverse these changes thus blocking the tumor‐supporting properties of CA‐MSCs. Furthermore, as CA‐MSCs differentiate into multiple tumor stromal elements such as CAFs and adipocytes, targeting this progenitor cell may significantly alter the entire stromal TME. Also, if the conversion of a normal MSC into a CA‐MSC is in part due to cancer secreted factors under hypoxic conditions, then as the tumor grows (locally and/or in metastatic deposits), secreted factors may act in a paracrine manner to influence near‐by tissue MSCs to start to become CA‐MSCs akin to a field effect creating more fertile “soil” for cancer cell propagation. By blocking these ongoing signals, we may prevent further spread of cancer by halting the creation of this “fertile soil.” Future work is needed to identify the critical factors which convert a normal tissue MSC into a CA‐MSC. Also, understanding the factors which protect BM MSCs from developing into an ovarian CA‐MSC will be critical to identifying targets to prevent and/or reverse the development of CA‐MSCs.
Author Contributions
L.C.: conception and design, financial support, collection and/or assemble of data, data analysis and interpretation, manuscript writing; A.P.: conception and design, data analysis and interpretation, manuscript writing; L.F.: collection and/or assembly of data; Z.F.: collection and/or assembly of data, data analysis and interpretation; E.C.: collection and/or assembly of data, data analysis and interpretation; D.B.: provision of study material or patients, collection and/or assembly of data; R.B.: conception and design, financial support, manuscript writing.
Disclosure of Potential Conflicts of Interest
D.B. declared research support from Roche‐Genentech and AstraZeneca. R.B. declared a leadership position with Tradewind Biosciences and two patents with the University of Michigan. The other authors indicated no potential conflicts of interest.
Supporting information
Appendix S1: Supporting Information
Supplemental Figure 1. Cross‐validated LASSO model selection. Misclassification error is minimized for a series of models over varying L1‐norm constraint Lambda. The selected model includes six non‐zero variables.
Supplemental Figure 2. Hypoxia alters the behavior of MSCs and enhances the cancer cell mediated induction of a CA‐MSC‐like expression profile. A‐D) qRT‐PCR experssion analysis of genes differentially expressed between MSCs and CA‐MSCs after indirect cancer simulation ± hypoxia of (A) BM MSCs, (B) OV MSCs, (C) OM MSCs and D) in vivo cancer stimulation of OM MSCs. Fold expression changes were compared to BM MSC control levels in (A), OV MSC control levels in (B) and OM MSC control levels in (C,D). Error bars = SEM.
Supplemental Figure 3. in vivo cancer stimulated OM MSCs enhance xenograft growth of PEO1 cells to levels equivalent to patient derived CA‐MSCs.
Supplemental Figure 4. Validation of in vivo cancer stimulated (IV‐CS) MSCs. A) in vitro differentiation of IV‐CS OM MSCs demonstrates approprate adipocyte (stained with oil red O), chondrocytes (stained with alcian blue) and osteocytes (stained with alizarin red) differentiation. B) Flow cytometery analysis demonstrating IV‐CS OM MSCs do not express the surface fibroblast markers fibroblast activation protein (FAP) or fibroblast surface protein (FSP), in contrast, 94% of cells are CD73 + .
Acknowledgments
This work was supported in part by the NCI/NIH1‐R01‐211913‐02 L. Coffman is supported by a NCI/NIH 7K08CA211362 award and American Society of Clinical Oncology's Young Investigator Award and the Hillman Fellows Program. A.T. Pearson is supported by the Cancer Research Foundation Young Investigator Award.
References
- 1.Surveillance, Epidemiology, and End Results (SEER) Program (www.seer.cancer.gov) Research Data (1973–2010), National Cancer Institute, DCCPS, Surveillance Research Program, Surveillance Systems Branch, released April 2013, based on the November 2012; submission.
- 2. McLean K, Gong Y, Choi Y et al. Human ovarian carcinoma‐associated mesenchymal stem cells regulate cancer stem cells and tumorigenesis via altered BMP production. J Clin Invest 2011;121:3206–3219. [DOI] [PMC free article] [PubMed] [Google Scholar]
- 3. Musrap N, Diamandis EP. Revisiting the complexity of the ovarian cancer microenvironment—Clinical implications for treatment strategies. Mol Cancer Res 2012;10:1254–1264. [DOI] [PubMed] [Google Scholar]
- 4. Nieman KM, Kenny HA, Penicka CV et al. Adipocytes promote ovarian cancer metastasis and provide energy for rapid tumor growth. Nat Med 2011;17:1498–1503. [DOI] [PMC free article] [PubMed] [Google Scholar]
- 5. da Silva Meirelles L, Chagastelles PC, Nardi NB. Mesenchymal stem cells reside in virtually all post‐natal organs and tissues. J Cell Sci 2006;119:2204–2213. [DOI] [PubMed] [Google Scholar]
- 6. Kolf CM, Cho E, Tuan RS. Mesenchymal stromal cells. Biology of adult mesenchymal stem cells: Regulation of niche, self‐renewal and differentiation. Arthritis Res Ther 2007;9:204. [DOI] [PMC free article] [PubMed] [Google Scholar]
- 7. Coffman LG, Choi YJ, McLean K et al. Human carcinoma‐associated mesenchymal stem cells promote ovarian cancer chemotherapy resistance via a BMP4/HH signaling loop. Oncotarget 2016;7:6916–6932. [DOI] [PMC free article] [PubMed] [Google Scholar]
- 8. Dominici M, le Blanc K, Mueller I et al. Minimal criteria for defining multipotent mesenchymal stromal cells. The International Society for Cellular Therapy position statement. Cytotherapy 2006;8:315–317. [DOI] [PubMed] [Google Scholar]
- 9. Verardo R, Piazza S, Klaric E et al. Specific mesothelial signature marks the heterogeneity of mesenchymal stem cells from high‐grade serous ovarian cancer. Stem Cells 2014;32:2998–3011. [DOI] [PubMed] [Google Scholar]
- 10. Dewhirst MW, Cao Y, Moeller B. Cycling hypoxia and free radicals regulate angiogenesis and radiotherapy response. Nat Rev Cancer 2008;8:425–437. [DOI] [PMC free article] [PubMed] [Google Scholar]
- 11. Hockel M, Vaupel P. Tumor hypoxia: Definitions and current clinical, biologic, and molecular aspects. J Natl Cancer Inst 2001;93:266–276. [DOI] [PubMed] [Google Scholar]
- 12. Ejtehadifar M, Shamsasenjan K, Movassaghpour A et al. The effect of hypoxia on mesenchymal stem cell biology. Adv Pharm Bull 2015;5:141–149. [DOI] [PMC free article] [PubMed] [Google Scholar]
- 13. Price BD, Calderwood SK. Gadd45 and Gadd153 messenger RNA levels are increased during hypoxia and after exposure of cells to agents which elevate the levels of the glucose‐regulated proteins. Cancer Res 1992;52:3814–3817. [PubMed] [Google Scholar]
- 14. Furuta C, Miyamoto T, Takagi T et al. Transforming growth factor‐beta signaling enhancement by long‐term exposure to hypoxia in a tumor microenvironment composed of Lewis lung carcinoma cells. Cancer Sci 2015;106:1524–1533. [DOI] [PMC free article] [PubMed] [Google Scholar]
- 15. Han WQ, Zhu Q, Hu J et al. Hypoxia‐inducible factor prolyl‐hydroxylase‐2 mediates transforming growth factor beta 1‐induced epithelial‐mesenchymal transition in renal tubular cells. Biochim Biophys Acta 2013;1833:1454–1462. [DOI] [PMC free article] [PubMed] [Google Scholar]
- 16. Jun JH, Shin EJ, Kim JH et al. Erythropoietin prevents hypoxia‐induced GATA‐4 ubiquitination via phosphorylation of serine 105 of GATA‐4. Biol Pharm Bull 2013;36:1126–1133. [DOI] [PubMed] [Google Scholar]
- 17. Suzuki YJ. Cell signaling pathways for the regulation of GATA4 transcription factor: Implications for cell growth and apoptosis. Cell Signal 2011;23:1094–1099. [DOI] [PMC free article] [PubMed] [Google Scholar]
- 18. Beaufort CM, Helmijr JCA, Piskorz AM et al. Ovarian cancer cell line panel (OCCP): Clinical importance of in vitro morphological subtypes. PLoS ONE 2014;9:e103988. [DOI] [PMC free article] [PubMed] [Google Scholar]
- 19. Domcke S, Sinha R, Levine DA et al. Evaluating cell lines as tumour models by comparison of genomic profiles. Nat Commun 2013;4:2126. [DOI] [PMC free article] [PubMed] [Google Scholar]
- 20. Karnoub AE, Dash AB, Vo AP et al. Mesenchymal stem cells within tumour stroma promote breast cancer metastasis. Nature 2007;449:557–563. [DOI] [PubMed] [Google Scholar]
- 21. Ye H, Cheng J, Tang Y et al. Human bone marrow‐derived mesenchymal stem cells produced TGFbeta contributes to progression and metastasis of prostate cancer. Cancer Invest 2012;30:513–518. [DOI] [PubMed] [Google Scholar]
- 22. Bruno S, Collino F, Deregibus MC et al. Microvesicles derived from human bone marrow mesenchymal stem cells inhibit tumor growth. Stem Cells Dev 2013;22:758–771. [DOI] [PubMed] [Google Scholar]
- 23. Marofi F, Vahedi G, Biglari A et al. Mesenchymal stromal/stem cells: A new era in the cell‐based targeted gene therapy of cancer. Front Immunol 2017;8:1770. [DOI] [PMC free article] [PubMed] [Google Scholar]
- 24. Sharif S, Ghahremani MH, Soleimani M. Delivery of exogenous miR‐124 to glioblastoma multiform cells by wharton's jelly mesenchymal stem cells decreases cell proliferation and migration, and confers chemosensitivity. Stem Cell Rev 2017;14:236–246. [DOI] [PubMed] [Google Scholar]
- 25. Petrella F, Coccè V, Masia C et al. Paclitaxel‐releasing mesenchymal stromal cells inhibit in vitro proliferation of human mesothelioma cells. Biomed Pharmacother 2017;87:755–758. [DOI] [PubMed] [Google Scholar]
- 26. Petrella F, Rimoldi I, Rizzo S et al. Mesenchymal stromal cells for antineoplastic drug loading and delivery. Medicines 2017;4:87–97. [DOI] [PMC free article] [PubMed] [Google Scholar]
- 27. Lee CH, Moioli EK, Mao JJ. Fibroblastic differentiation of human mesenchymal stem cells using connective tissue growth factor. Conf Proc IEEE Eng Med Biol Soc 2006;1:775–778. [DOI] [PMC free article] [PubMed] [Google Scholar]
- 28. Langmead B, Salzberg SL. Fast gapped‐read alignment with Bowtie 2. Nat Methods 2012;9:357–359. [DOI] [PMC free article] [PubMed] [Google Scholar]
- 29. Kim D, Pertea G, Trapnell C et al. TopHat2: Accurate alignment of transcriptomes in the presence of insertions, deletions and gene fusions. Genome Biol 2013;14:R36. [DOI] [PMC free article] [PubMed] [Google Scholar]
- 30. Anders S, Pyl PT, Huber W. HTSeq—A Python framework to work with high‐throughput sequencing data. Bioinformatics 2015;31:166–169. [DOI] [PMC free article] [PubMed] [Google Scholar]
- 31. Ritchie ME, Phipson B, Wu D et al. Limma powers differential expression analyses for RNA‐sequencing and microarray studies. Nucleic Acids Res 2015;43:e47. [DOI] [PMC free article] [PubMed] [Google Scholar]
- 32. Sergushichev A. An algorithm for fast preranked gene set enrichment analysis using cumulative statistic calculation. bioRxiv 2016. 10.1101/060012. [DOI] [Google Scholar]
- 33. Friedman J, Hastie T, Tibshirani R. Regularization paths for generalized linear models via coordinate descent. J Stat Softw 2010;33:1–22. [PMC free article] [PubMed] [Google Scholar]
- 34. R Development Core Team . R: A Language and Environment for Statistical Computing. Vienna, Austria: the R Foundation for Statistical Computing, 2011. [Google Scholar]
Associated Data
This section collects any data citations, data availability statements, or supplementary materials included in this article.
Supplementary Materials
Appendix S1: Supporting Information
Supplemental Figure 1. Cross‐validated LASSO model selection. Misclassification error is minimized for a series of models over varying L1‐norm constraint Lambda. The selected model includes six non‐zero variables.
Supplemental Figure 2. Hypoxia alters the behavior of MSCs and enhances the cancer cell mediated induction of a CA‐MSC‐like expression profile. A‐D) qRT‐PCR experssion analysis of genes differentially expressed between MSCs and CA‐MSCs after indirect cancer simulation ± hypoxia of (A) BM MSCs, (B) OV MSCs, (C) OM MSCs and D) in vivo cancer stimulation of OM MSCs. Fold expression changes were compared to BM MSC control levels in (A), OV MSC control levels in (B) and OM MSC control levels in (C,D). Error bars = SEM.
Supplemental Figure 3. in vivo cancer stimulated OM MSCs enhance xenograft growth of PEO1 cells to levels equivalent to patient derived CA‐MSCs.
Supplemental Figure 4. Validation of in vivo cancer stimulated (IV‐CS) MSCs. A) in vitro differentiation of IV‐CS OM MSCs demonstrates approprate adipocyte (stained with oil red O), chondrocytes (stained with alcian blue) and osteocytes (stained with alizarin red) differentiation. B) Flow cytometery analysis demonstrating IV‐CS OM MSCs do not express the surface fibroblast markers fibroblast activation protein (FAP) or fibroblast surface protein (FSP), in contrast, 94% of cells are CD73 + .