

Abstract
Aims
Although coronary artery calcium (CAC) has been established as a robust tool for predicting total mortality during intermediate follow-up, less is known about the long-term predictive value of CAC.
Methods and results
This study included 13 092 asymptomatic patients without known cardiovascular disease who underwent a clinically indicated CAC scan. CAC was categorized as an Agatson score of 0, 1–99, 100–399, and ≥400. We used multivariable Cox proportional hazards to calculate adjusted hazard ratios (HRs) for mortality stratified by age (younger, intermediate, or older) and gender. The mean age of participants was 58 ± 11 years and 67% were men. During a median follow-up of 11.0 ± 3.2 years, there were 522 deaths (4.0%). Compared with CAC = 0, increasing CAC was associated with higher mortality rate: 1–99 [HR: 1.5, 95% confidence interval (95% CI): 1.1–2.1]; 100–399 (HR: 1.8, 95% CI: 1.3–2.5); ≥400 (HR: 2.6, 95% CI: 1.9–3.6). Relative risk according to CAC category did not differ between genders. The strongest associations between CAC and mortality were observed for young and intermediate age participants. Nonetheless, the mortality rate of the older patients with CAC = 0 was far lower than that of the general US population. CAC was more predictive of long-term (15 years) than intermediate-term (5 years) mortality for men [receiver operator characteristics (ROC): 0.723 vs. 0.702] and women (ROC: 0.69 vs. 0.65).
Conclusion
CAC is strongly associated with the long-term risk of mortality in young- and middle-aged men and women. In older patients, the long-term risk stratification of CAC is lower, due principally to increased mortality rate in patients with low calcium scores; however, even in the older patients, those with absent or low CAC are at a significantly lower risk of mortality compared with the general population.
Keywords: Coronary artery calcium score, Mortality risk, Age, Gender, Long-term mortality
Introduction
Cardiovascular disease (CVD) has the highest morbidity and mortality rate of any disease process.1 However, effective preventive therapies are available that can reduce CVD events. The population-based risk prediction models calculated using traditional clinical risk scoring upon which the current CVD prevention guidelines are based can overestimate or underestimate an individual's risk.2,3
Numerous studies have demonstrated the prognostic utility of coronary artery calcium (CAC) for risk stratification among asymptomatic patients.4–8 An increasing CAC is associated with a higher mortality and CVD risk regardless of age,9 gender,10 or ethnicity11 during an intermediate follow-up period. Its CVD risk prediction is superior to that of traditional CVD risk factors, novel biomarkers, and other measures of sub-clinical atherosclerosis.7,12–15 However, the results of these studies were reported with a follow-up time of only 5–7 years and the longer term mortality associated with CAC has not been well defined. Moreover, CVD risk has been shown to increase with age and to be higher in men than in women. However, the association between CAC and long-term risk of CVD and mortality has not been explored. Therefore, we examined the relationship between CAC and all-cause mortality, used as a proxy for CVD risk, in a cohort with a median follow-up of at least 10 years.
Methods
Study population
We studied 13 092 consecutive asymptomatic individuals without known coronary artery disease with a mean age of 58 ± 11 years (67% men) clinically referred for a CAC scan between July 1997 and December 2011 at our institution (Los Angeles Biomedical Institute at Harbor UCLA Medical Center). We stratified the population in groups by age [younger (<45 years for male, <55 years for female), intermediate (45–74 years for male and 55–74 years for female), or older (≥75 years for both male and female)] and gender, as has been previously proposed.13
All subjects completed a questionnaire for ethnicity (Caucasian, Hispanic/Latino, African-American, Asian, or other), and CVD risk factors including hypertension, hypercholesterolaemia, diabetes mellitus, current cigarette smoking, and any family history of CVD determined as whether any member of their immediate family (parents or siblings) had a history of fatal or nonfatal myocardial infarction and/or coronary revascularization, as previously described.16 Exclusion criteria included age <20 years, any chest pain, prior known CVD (prior coronary revascularization or myocardial infarction), or follow-up of ≤365 days. This study was approved by the Institutional Review Board of Los Angeles Biomedical Institute at Harbor UCLA Medical Center. Informed consent was obtained from all patients.
Non-contrast computed tomography image acquisition protocol
All subjects underwent electron beam computed tomography (EBCT) with an Imatron C-150XL Ultrafast-computed tomography scanner (GE-Imatron, South San Francisco, CA) or multi-detector 64-slices coronary computed tomography (CT) (Lightspeed VCT, General Electric Healthcare Technologies, Milwaukee, WI). Each scan extended from 1 cm below the carina to the bottom of the heart to include the entire coronary tree. Scan parameters included as follows: prospective electrocardiogram-triggering (typically 60–80% of the R–R interval for EBCT, 65–80% for multi-detector CT), 35 cm field of view, 512 × 512 matrix size, and peak tube voltage of 120 kVp. Slice thickness was 3 mm. CAC measurements were performed on a dedicated workstation (AW Volume Share™, GE Medical Systems, Milwaukee, WI), and CAC was quantified using the Agatson score.17
Statistical analysis
Continuous variables are expressed as the mean ± SD. The Wilcoxon rank-sum test was used to conduct intergroup comparisons among younger, intermediate, older subject groups. Categorical variables were compared using Pearson χ2 tests. An one-way analysis of variance or the Kruskal–Wallis test was used to conduct intergroup comparisons among younger, intermediate, older subject groups.
All-cause death was defined as the endpoint of this current study and verified using linkage with the Social Security Death Index18 through December 2012. A full Social Security Death Index search was completely performed using the patients’ name and date of birth in all of patients.
CAC was categorized into four groups: 0, 1–99, 100–399, and ≥400 Agatston units. The prevalence of CAC was assessed by age and gender groups. The mortality risk was analysed across all CAC categories by age and gender groups. Kaplan–Meier models investigating the association between CAC and mortality were calculated. We also calculated multivariable Cox Proportional hazards models adjusted for age, hypertension, hyperlipidaemia, diabetes, current smoking and family history, and ethnicity among CAC groups in each age and gender group. The mortality event rates per 1000 person-years were assessed among age and gender group based on CAC categories.
We also compared the mortality event rates per 1000 person-years between patients with CAC = 0 and the general adult population in the USA from the data based on the Center for Disease Control and Prevention19 across various age groups for men and women.
Relative risk (RR) of mortality rate among men and women was assessed based on CAC with 0, 1–99, 100–399, and ≥400. Area under the curves (AUC) by receiver operator characteristics (ROC) was used to predict all-cause mortality at 5 and 15 years between traditional risk factors alone and risk factors plus the continuous CAC score among men and women.
In sub-analysis of 11 790 patients, the different mortality risks by ethnicity (White, Hispanic/Latino, African-American, or Asian) were also examined by multivariable Cox proportional hazard models adjusting for age, gender, and CAD risk factors.
Scaled Schoenfeld residuals were used to verify the assumption of proportional hazards within the Cox models.20 A hazard ratio (HR) and 95% confidence interval (CI) were calculated from the Cox models. P values < 0.05 were considered statistically significant. All statistical calculations were performed using SAS (Version 9.3, SAS Inc., Cary, NC) for Windows.
Results
Baseline characteristics
The median follow-up of this study was 11.0 (interquartile range: 8.9–12.5) years. Among the 13 092 patients, 8713 (66.55%) were men and 4379; (33.45%) were women. Women were older (58.7 ± 11.3 vs. 57.7 ± 11.5 years, P = 0.0001) and had a greater number of risk factors compared with men (1.77 ± 0.99 vs. 1.64 ± 1.01, P = 0.0001). By age and gender, there were 1664 younger women (38.0%), 1213 younger men (13.9%), 2321 intermediate women (53.0%), 6813 intermediate men (78.2%), 394 older women (9.0%), and 687 older men (7.9%). Baseline characteristics are shown in Table 1. Younger women and men were less likely to have hypertension, diabetes, and hyperlipidaemia, resulting in a lower number of risk factors compared with other groups. Between gender, women were more likely to have a family history of CAD and a greater number of risk factors than men (Table 1).
Table 1.
Study population characteristics
| Men (n = 8713) |
Women (n = 4379) |
|||||
|---|---|---|---|---|---|---|
| Younger | Intermediate | Older | Younger | Intermediate | Older | |
| <45 years (n = 1213) | 45–74 years (n = 6813) | ≥75 years (n = 687) | <55 years (n = 1664) | 55–74 years (n = 2321) | ≥75 years (n = 394) | |
| Age (years) | 39.9 ± 4.0 | 58.7 ± 7.8† | 79.1 ± 3.4†,* | 47.5 ± 6.0‖ | 63.4 ± 5.6†,‖ | 79.2 ± 3.4†,* |
| Race/ethnicity (%) | ||||||
| Caucasian | 72.3 | 82.0† | 86.1†,** | 71.2 | 80.7† | 79.1‡,‖ |
| Hispanic/Latino | 11.0 | 6.5† | 2.9†,* | 13.6‖ | 7.0† | 6.3†,‖ |
| African-American | 4.3 | 3.4 | 2.0† | 4.3 | 4.1 | 4.4‖ |
| Asian | 11.3 | 7.5† | 8.5 | 10.6 | 8.0‡ | 9.6 |
| Others | 1.1 | 0.6‡ | 0.5 | 0.3‖ | 0.2‖ | 0.6 |
| Risk factors (%) | ||||||
| Hypertension | 19.5 | 33.3† | 41.3†,* | 22.2 | 39.6†,¶ | 53.1†,*,¶ |
| Diabetes | 3.5 | 9.0† | 14.9†,* | 6.0‖ | 9.9† | 9.4‡,‖ |
| Hyperlipidaemia | 55.2 | 62.0† | 58.8* | 49.9‖ | 67.4†,¶ | 66.8†,‖ |
| Current smoking | 9.8 | 9.4 | 5.5‡,** | 7.8 | 7.5‖ | 4.6‡,** |
| Family history | 58.7 | 52.7† | 44.4†,* | 68.9‖ | 66.3¶ | 56.1†,*,¶ |
| Total number of risk factors | 1.55 ± 0.96 | 1.66 ± 1.0† | 1.65 ± 1.06† | 1.47 ± 0.94‖ | 1.91 ± 1.01†,‖ | 1.90 ± 0.99†,‖ |
| CAC score (25th, 75th percentile) | 0.5 | 0, 243 | 69, 828 | 0.1 | 0, 80 | 8.5, 355.5 |
| All-cause death (n, %) | 11 (0.9) | 234 (3.4)† | 123 (17.9)†,* | 15 (0.9) | 84 (3.6)† | 55 (14.0)†,* |
CAC, coronary artery calcium.
† P < 0.001 and ‡P < 0.05 for the comparison with younger group.
*P < 0.001 and **P < 0.05 for the comparison with intermediate group.
¶ P < 0.001 and ‖P < 0.05 for the comparison with males in younger, intermediate, or older age group.
The prevalence and severity of CAC
Figure 1 A and B displays the prevalence of CAC categories by age and gender. The prevalence of CAC = 0 ranged from 73.6% in younger women to 10.6% in older men, and CAC ≥400 ranged from 1.3% in younger women to 51.8% in older men. Men were more likely to have higher CAC across various age groups compared with women.
Figure 1.
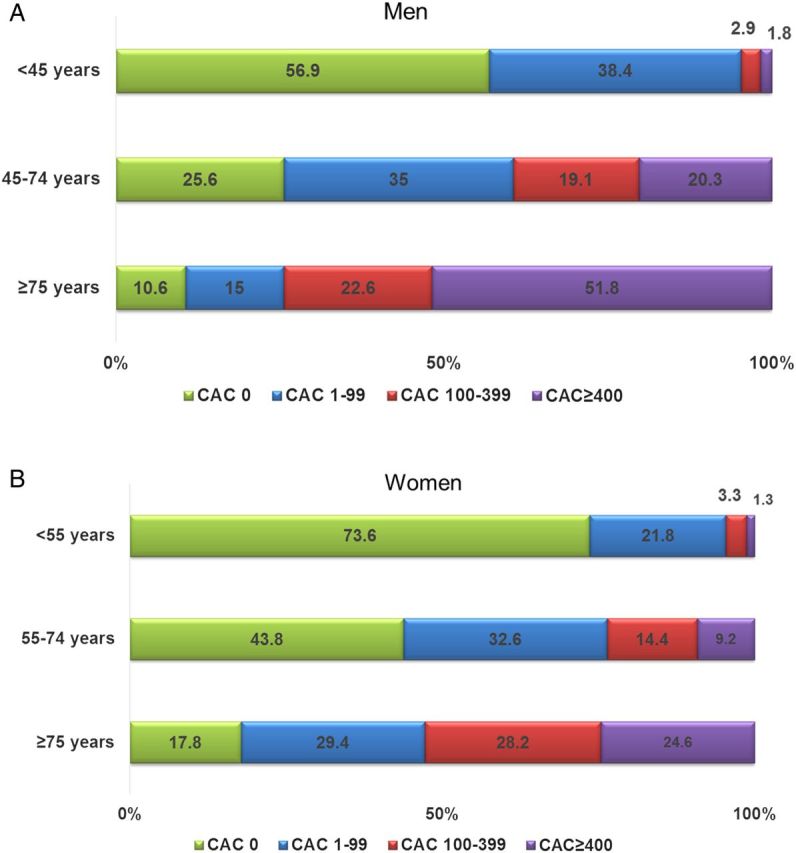
(A) Prevalence of CAC among men stratified by age group. (B) Prevalence of CAC among women stratified by age group. CAC, coronary artery calcium.
Figure 2A and B also illustrates the prevalence of CAC categories by number of risk factors among men and women. Among both genders, patients with more risk factors had an increased CAC burden. This trend was more pronounced in women than in men, while ∼30% of women (n = 1999) and 60% of men (n = 2039) without known risk factors had CAC > 0. Compared with women, men had approximately two-fold higher prevalence of CAC at any level of number of risk factors, whereas a similar prevalence was observed between genders when patients had all of risk factors.
Figure 2.
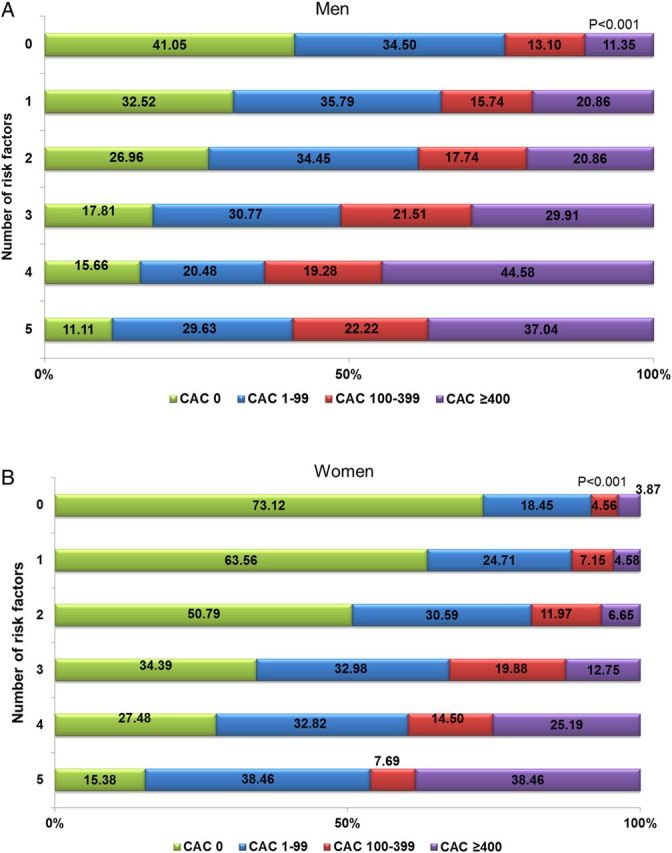
(A) Prevalence of CAC among men stratified by the number of risk factors. (B) Prevalence of CAC among women stratified by the number of risk factors. Abbreviations as in Figure 1.
Mortality risk
Five hundred and twenty-two (4.0%) of the 13 107 patients died and 15 (0.9%) were younger women, 11 (0.9%) were younger men, 84 (3.6%) were intermediate women, 234 (3.4%) were intermediate men, 55 (14.0%) were older women, and 123 (17.9%) were older men. There was no significant difference in the risk of mortality between genders in the overall population as well as in the younger, intermediate, or older age groups (P > 0.05 for all).
During a follow-up up to 15 years, the mortality rate was extremely low in patients with CAC = 0 for men (1.6%) and women (1.8%) and increased progressively with each of CAC category (1–99, 100–399, and ≥400) for both men and women (P < 0.001 for all). Among men, there was a 2.1-, 3.6-, and 7.1-fold higher mortality risk by CAC category compared with those with CAC = 0 (Figure 3A). The point estimates were higher in women at 3.1-, 4.2-, and 13.3-fold higher mortality risk for the respective CAC categories (Figure 3B). RR in men at any level of CAC with 0 (RR: 1.47, 95% CI: 0.9–2.4, P = 0.13), 1–99 (RR: 1.51, 95% CI: 0.99–2.30, P = 0.06), 100–399 (RR: 0.82, 95% CI: 0.53–1.28, P = 0.39), and ≥400 (RR: 1.05, 95% CI: 0.72–1.53, P = 0.79) did not differ compared with women.
Figure 3.
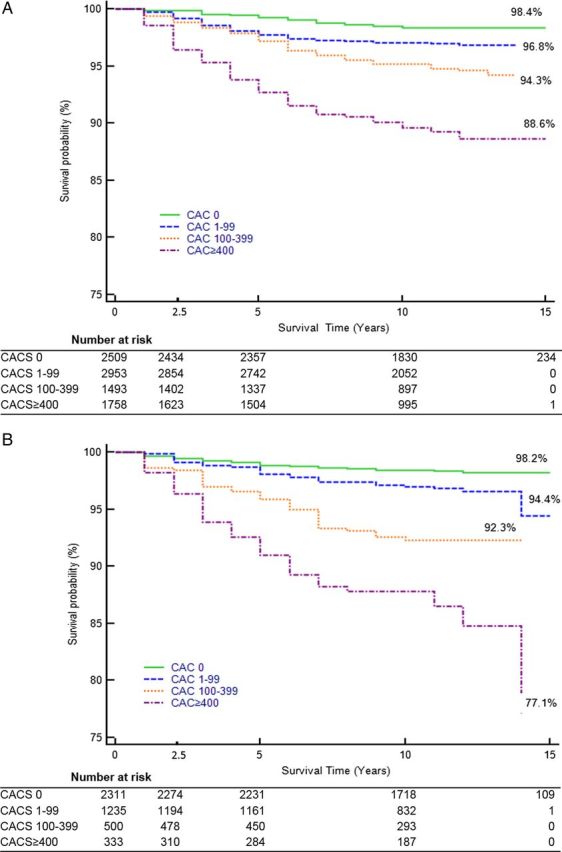
(A) Kaplan–Meier analysis for all-cause mortality among men stratified by CAC group. (B) Kaplan–Meier analysis for all-cause mortality among women stratified by CAC group. Abbreviations as in Figure 1.
Among younger subjects, the mortality rates of those with CAC = 0 were very low at 0.4 and 0.9 per 1000 person-years of follow-up in younger men and women, 0.8 and 1.0 per 1000 person-years follow-up for intermediate men and women, and 11.9 and 9.5 per 1000 person-years follow-up for older men and women (Figure 4). Mortality increased progressively with each CAC category in younger- and intermediate-aged participants. The mortality risk was highest in participants with CAC ≥400 for older participants in both genders. Similar findings were observed in the risk-adjusted Cox proportional hazard models for all-cause mortality, stratified by CAC among age and gender groups (Table 2).
Figure 4.
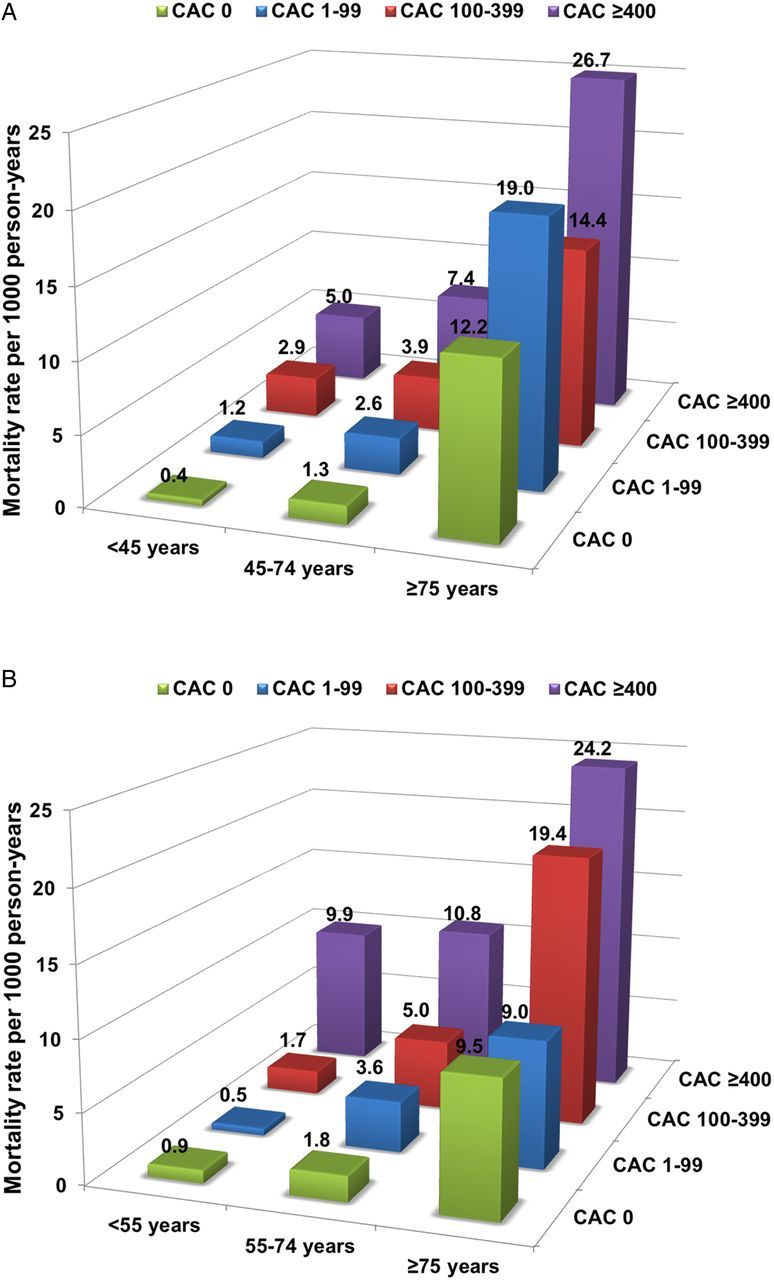
(A) Annualized mortality risk per 1000 person-years stratified by age group and CAC categories among men. (B) Annualized mortality risk per 1000 person-years stratified by age group and CAC categories among women.
Table 2.
Multivariate Cox proportional models for the risk of mortality stratified by age and gender
| Men (n = 8713) |
Women (n = 4379) |
|||||
|---|---|---|---|---|---|---|
| <45 years (n = 1213) | 45–74 years (n = 6813) | ≥75 years (n = 687) | <55 years (n = 1664) | 55–74 years (n = 2321) | ≥75 years (n = 394) | |
| HR (95% CI) | HR (95% CI) | HR (95% CI) | HR (95% CI) | HR (95% CI) | HR (95% CI) | |
| CAC 0 | 1.0 (ref) | 1.0 (ref) | 1.0 (ref) | 1.0 (ref) | 1.0 (ref) | 1.0 (ref) |
| CAC 1–99 | 3.1 (0.8–12.7) | 1.8 (1.1–2.8) | 1.3 (0.6–2.9) | 0.3 (0.04–2.8) | 2.4 (1.2–4.8) | 1.5 (0.5–4.4) |
| CAC 100–399 | 3.3 (0.2–53.4) | 2.5 (1.5–4.0) | 0.9 (0.4–2.0) | 2.5 (0.3–22.3) | 3.8 (1.8–7.9) | 3.1 (1.1–8.7) |
| CAC ≥400 | 4.9 (0.5–51.0) | 4.5 (2.8–7.1) | 1.5 (0.7–3.1) | 4.7 (0.4–55.5) | 5.8 (2.8–12.4) | 2.7 (0.99–7.5) |
CAC, coronary artery calcium; HR, hazard ratio; CI, confidential interval.
Patients with CAC of zero had a lower rate of mortality at all ages compared with general US population. The difference in mortality increased exponentially with age (Figure 5A and B).
Figure 5.
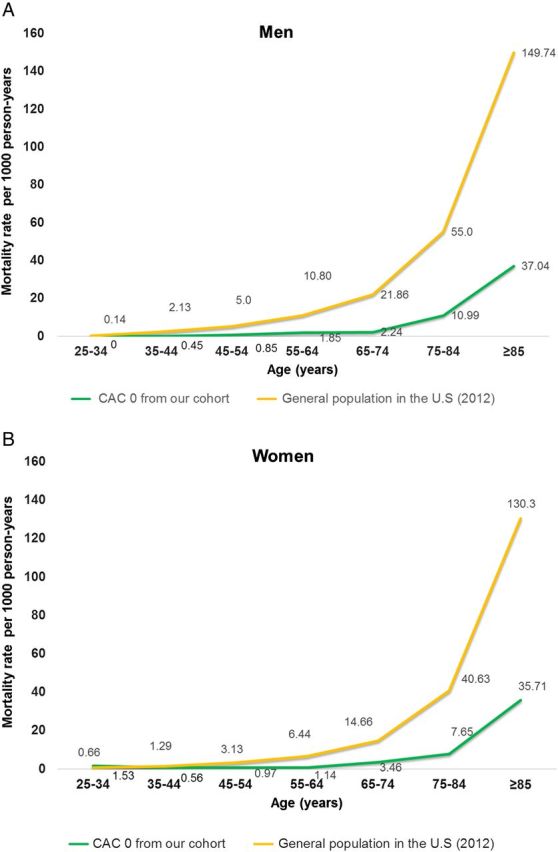
(A) Annual mortality rates per 1000 person-years among men with CAC = 0 compared with those from general US population in 2012. (B) Annual mortality rates per 1000 person-years among women with CAC = 0 compared with those from general US population in 2012.
In sub-analysis of 11 790 patients whose ethnicity are White (n = 9435), Hispanic/Latino (n = 913), African-American (n = 436), or Asian (n = 1006), the mean of CACS was 174.0, 125.2, 144.2, and 144.6, respectively (P < 0.001). During a mean follow-up of 10.2 ± 3.2 years, 465 individuals (3.9%) died. Hispanic/Latinos and African-American patients experienced higher mortality risk compared with White or Asian patients (3.6 vs. 4.7% vs. 9.2 vs. 3.9%, P < 0.001). Compared with patients with CAC score of zero, the mortality rates were significantly higher in patients with increasing CAC scores among all ethnicity groups (Table 3).
Table 3.
Risk-adjusted Cox proportional hazard models for all-cause mortality stratified by CAC score among ethnicity groups in sub-analysis (n = 11 790)
| White |
Hispanic/Latino |
African-American |
Asian |
|||||
|---|---|---|---|---|---|---|---|---|
| HR | 95% CI | HR | 95% CI | HR | 95% CI | HR | 95% CI | |
| CACS 0 | 1.0 | Ref | 1.0 | Ref | 1.0 | Ref | 1.0 | Ref |
| CACS 1–99 | 1.6 | 1.1–2.3 | 1.2 | 0.5–3.3 | 1.5 | 0.6–4.0 | 2.1 | 0.8–6.0 |
| CACS 100–399 | 1.6 | 1.04–2.3 | 3.4 | 1.2–9.3 | 2.2 | 0.7–6.8 | 2.9 | 0.9–8.9 |
| CACS ≥400 | 2.4 | 1.6–3.5 | 3.9 | 1.4–10.8 | 2.7 | 0.9–7.7 | 3.7 | 1.2–11.6 |
Abbreviations as in Table 2.
The additive value of CAC to traditional risk factors to predict all-cause mortality
In men, at 5 years, CAC showed an incremental prognostic value over traditional risk factors alone (AUC: 0.702 vs. 0.655, P = 0.002) (Figure 6A). This incremental value was greater at 15 years (AUC: 0.723 vs. 0.656, P < 0.0001) (Figure 6B). In women, there was a trend towards incremental value of CAC over risk factors in predicting mortality risk at 5 years (AUC: 0.650 vs. 0.612, P = 0.065) (Figure 6C). In women at 15 years, CAC significantly improved this prediction over risk factors alone (AUC: 0.690 vs. 0.624, P < 0.0001) (Figure 6D).
Figure 6.

(A–D) ROC curves for prediction of all-cause mortality by traditional risk factors alone and risk factors plus the CAC score among men and women at 5 years (A: men, C: women) and 15 years (B: men, D: women). Abbreviations as in Figure 1.
Discussion
This is the first study demonstrating the long-term prognostic utility of CAC in asymptomatic patients by age and gender. This long-term observational study builds on previous studies that demonstrated the added prognostic information provided by CAC among asymptomatic patients during intermediate follow-up.4,16,21 In patients who are <75 years old, the ability of CAC to stratify risk at 10 years is similar to what it has previously been described at 5 years.9
An interesting novel finding of this study is the observation that the long-term risk stratification by CAC is attenuated in the older patients. In patients older than 75 years, the ability of CAC to stratify risk was still present, but was lower than in the other groups and lower than was previously described in intermediate follow-up.9 This finding may be explained by competing risks associated with an increased overall mortality rate in older patients. In contrast to the younger and intermediate age patients with CAC = 0, the annualized mortality rate in the patients 75–84 years of age was still relatively low but higher (0.7–1.1%/year) and was even higher in the ≥85-year-old patients (3.7%/year). This increase in mortality rates for the older patients with low CAC may be due to the increase in non-cardiac death in these age groups. Of importance, however, in these older patients with CAC = 0 or low CAC (1–99), the mortality risk at 10 years is much lower than that of the general population.
A CAC = 0 has been shown to confer an extremely low mortality risk over an intermediate duration follow-up, regardless of traditional risk factors.16,22 Our prior study reported demonstrated findings similar to those of this study in 25 253 patients over a duration mean follow-up of 6.8 years.4 Other study similarly reported an excellent survival rate of CAC = 0 with >99% in 44 052 patients at a mean follow-up of 5.6 years.23 The results of our study expand on these intermediate-term findings by demonstrating the consistent associations between CAC = 0 and very low long-term all-cause mortality, except in the older group. In the current study, annualized mortality risk among patients <75 years old with CAC = 0 (30% in men and 56% in women of this age group) was only <0.35%/year, which is comparable with the results of a prior study in this age group showing <0.2%/year of mortality risk.9 In patients ≥75 years of age with CAC = 0 (10.6% of men and 17.8% of women of this age group), our study demonstrated that annualized mortality rate is higher than in the younger and intermediate age groups; however, it is still relatively low. Importantly, this risk is 70% lower than that of the general US adult population in this age group.
The most recent US prevention guidelines recommend using the 10-year Atherosclerotic Cardiovascular Disease (ASCVD) risk score to determine the appropriateness of statin therapy among asymptomatic individuals.24 This guideline considers patients with a ≥7.5% ASCVD risk to be at high risk and suggests initiating statin therapy. However, Kavousi et al.2 have recently reported that nearly all men ≥55 years of age and women ≥65 years of age would have a ≥7.5% predicted 10-year risk and be recommended for treatment intervention with a statin regardless of their risk factor burden, since an estimated 10-year ASCVD risk is heavily weighted based on age. By showing that a substantial proportion of the patients in this age group have a CAC = 0 and that this is associated with low long-term risk, the findings of this study support the concept that selection of the intensity of therapy might be better based on observed sub-clinical atherosclerosis in individual patients rather than on population-based risk.
With respect to gender, among patients who were referred for a CAC scan, we observed that women were likely to have a greater prevalence of family history of CAD compared with men. Possible explanation of the finding may be that a family history of CAD has been considered as a high risk of CAC in women despite they were at a low risk of CAD.25 While there was a lower prevalence of CAC in women, CAC equally predicted mortality risk among men and women in the current study. A previous systematic meta-analysis of 17 850 men and 17 779 women with CAC scanning similarly demonstrated that there was no difference in stratifying risk between men and women.26 Our study also did not show any difference in predicting mortality risk at any level of CAC between genders (P > 0.05).27
Numerous previous studies have shown an independent prognostic value of CAC over clinical risk factors during an intermediate-term follow-up.5,7,11 In our study, we similarly demonstrate that CAC has an incremental value in predicting long-term mortality over traditional risk factors alone among men and a trend towards incremental value in women at the intermediate 5-year follow-up. This incremental value of CAC burden was more prominent in both genders at 15 years.
We recognize several limitations in the current study including that this is a single-centre study. Since CAC scanning was referred for clinical purposes in our cohort, the association between CAC and long-term mortality rate among population-based cohorts remains unclear. In addition, risk factors were self-reported by patients, which may underestimate their true prevalence. Although numerous previous studies demonstrated the prognostic value of CAC beyond other risk scoring such as Framingham Risk Score,7,28 we did not have fasting lipid values to calculate this or other commonly used scores. Furthermore, we cannot determine how the single CAC measurement might compare to multiple assessments of risk factors over time in the prediction of mortality. Further studies examining the comparative ability of CAC and risk scores to predict long-term CVD events appear warranted. There were no data regarding medication use after CAC scanning. Increased CAC has been associated with the increased prescription of statins and aspirin,29,30 but we did not have data about post-CAC scan medication use. However, if patients with non-zero CAC score were prescribed statin therapy, we would expect lower event rates in those groups, which would make our results more conservative. We did not assess the incremental prognostic utility of CCTA adding CAC in the present study. Recent data have suggested that CCTA may be superior to CAC in risk prediction in patients with CAC scores 100–400; however, superiority in unselected asymptomatic patients has not been shown.31 In addition, current guidelines do not recommend the use of CCTA to stratify future mortality or cardiovascular risk among asymptomatic patients32 and current appropriate use criteria consider that CCTA is inappropriate in asymptomatic patients.33 The outcome variable in this study was all-cause mortality. While CVD mortality is the most common cause of death in middle-aged individuals, the risk of death from cancer and other causes increases with age and we were not able to examine cause of death. Further studies examining the relationship between CAC and cardiovascular events during a long-term follow-up are needed.
Conclusion
Increasing CAC was strongly associated with an increased long-term mortality risk in the young and middle age groups of both genders. In older patients, the long-term risk stratification of CAC was lower, due principally to competing risk of mortality. However, even in the older patients, those with absent or low CAC had a significantly lower risk of mortality compared with the general population.
Conflict of interest: none declared.
References
- 1. Go AS, Mozaffarian D, Roger VL, Benjamin EJ, Berry JD, Blaha MJ et al. Executive summary: heart disease and stroke statistics—2014 update: a report from the American Heart Association. Circulation 2014;129:399–410. [DOI] [PubMed] [Google Scholar]
- 2. Kavousi M, Leening MJ, Nanchen D, Greenland P, Graham IM, Steyerberg EW et al. Comparison of application of the ACC/AHA guidelines, adult treatment panel III guidelines, and European Society of Cardiology guidelines for cardiovascular disease prevention in a European cohort. JAMA 2014;311:1416–23. [DOI] [PubMed] [Google Scholar]
- 3. Stone NJ, Robinson JG, Lichtenstein AH, Bairey Merz CN, Blum CB, Eckel RH et al. 2013 ACC/AHA guideline on the treatment of blood cholesterol to reduce atherosclerotic cardiovascular risk in adults: a report of the American college of cardiology/American heart association task force on practice guidelines. J Am Coll Cardiol 2014;63:2889–934. [DOI] [PubMed] [Google Scholar]
- 4. Budoff MJ, Shaw LJ, Liu ST, Weinstein SR, Mosler TP, Tseng PH et al. Long-term prognosis associated with coronary calcification: observations from a registry of 25,253 patients. J Am Coll Cardiol 2007;49:1860–70. [DOI] [PubMed] [Google Scholar]
- 5. Budoff MJ, Nasir K, McClelland RL, Detrano R, Wong N, Blumenthal RS et al. Coronary calcium predicts events better with absolute calcium scores than age-sex-race/ethnicity percentiles: Mesa (multi-ethnic study of atherosclerosis). J Am Coll Cardiol 2009;53:345–52. [DOI] [PMC free article] [PubMed] [Google Scholar]
- 6. Arad Y, Spadaro LA, Goodman K, Newstein D, Guerci AD. Prediction of coronary events with electron beam computed tomography. J Am Coll Cardiol 2000;36:1253–60. [DOI] [PubMed] [Google Scholar]
- 7. Yeboah J, McClelland RL, Polonsky TS, Burke GL, Sibley CT, O'Leary D et al. Comparison of novel risk markers for improvement in cardiovascular risk assessment in intermediate-risk individuals. JAMA 2012;308:788–95. [DOI] [PMC free article] [PubMed] [Google Scholar]
- 8. Greenland P, LaBree L, Azen SP, Doherty TM, Detrano RC. Coronary artery calcium score combined with Framingham score for risk prediction in asymptomatic individuals. JAMA 2004;291:210–5. [DOI] [PubMed] [Google Scholar]
- 9. Tota-Maharaj R, Blaha MJ, McEvoy JW, Blumenthal RS, Muse ED, Budoff MJ et al. Coronary artery calcium for the prediction of mortality in young adults <45 years old and elderly adults >75 years old. Eur Heart J 2012;33:2955–62. [DOI] [PubMed] [Google Scholar]
- 10. Raggi P, Shaw LJ, Berman DS, Callister TQ. Gender-based differences in the prognostic value of coronary calcification. J Womens Health (Larchmt) 2004;13:273–83. [DOI] [PubMed] [Google Scholar]
- 11. Detrano R, Guerci AD, Carr JJ, Bild DE, Burke G, Folsom AR et al. Coronary calcium as a predictor of coronary events in four racial or ethnic groups. New Engl J Med 2008;358:1336–45. [DOI] [PubMed] [Google Scholar]
- 12. Naghavi M. Preventive cardiology: the shape of the future. A synopsis from the screening for heart attack prevention and education (shape) task force report. Herz 2007;32:356–61. [DOI] [PubMed] [Google Scholar]
- 13. Naghavi M, Falk E, Hecht HS, Jamieson MJ, Kaul S, Berman D et al. From vulnerable plaque to vulnerable patient—part iii: executive summary of the screening for heart attack prevention and education (shape) task force report. Am J Cardiol 2006;98:2H–15H. [DOI] [PubMed] [Google Scholar]
- 14. Naghavi M, Falk E, Hecht HS, Shah PK. The first shape (screening for heart attack prevention and education) guideline. Crit Pathw Cardiol 2006;5:187–90. [DOI] [PubMed] [Google Scholar]
- 15. Erbel R, Möhlenkamp S, Moebus S, Schmermund A, Lehmann N, Stang A et al. Coronary risk stratification, discrimination, and reclassification improvement based on quantification of subclinical coronary atherosclerosis: the Heinz Nixdorf Recall study. J Am Coll Cardiol 2010;56:1397–406. [DOI] [PubMed] [Google Scholar]
- 16. Nasir K, Rubin J, Blaha MJ, Shaw LJ, Blankstein R, Rivera JJ et al. Interplay of coronary artery calcification and traditional risk factors for the prediction of all-cause mortality in asymptomatic individuals. Circ Cardiovasc Imaging 2012;5:467–73. [DOI] [PubMed] [Google Scholar]
- 17. Agatston AS, Janowitz WR, Hildner FJ, Zusmer NR, Viamonte M, Detrano R. Quantification of coronary artery calcium using ultrafast computed tomography. J Am Coll Cardiol 1990;15:827–32. [DOI] [PubMed] [Google Scholar]
- 18. Curb JD, Ford CE, Pressel S, Palmer M, Babcock C, Hawkins CM. Ascertainment of vital status through the national death index and the social security administration. Am J Epidemiol 1985;121:754–66. [DOI] [PubMed] [Google Scholar]
- 19. The National Vital Statistics Report (NVSR) “Deaths: Final Data for 2012.” http://www.cdc.gov/nchs/data_access/Vitalstatsonline.htm (1 October 2015, date last accessed).
- 20. Grambsch P. Proportional hazards tests and diagnostics based on weighted residuals. Biometrika 1994;81:515–26. [Google Scholar]
- 21. Shaw LJ, Raggi P, Schisterman E, Berman DS, Callister TQ. Prognostic value of cardiac risk factors and coronary artery calcium screening for all-cause mortality. Radiology 2003;228:826–33. [DOI] [PubMed] [Google Scholar]
- 22. Silverman MG, Blaha MJ, Krumholz HM, Budoff MJ, Blankstein R, Sibley CT et al. Impact of coronary artery calcium on coronary heart disease events in individuals at the extremes of traditional risk factor burden: the multi-ethnic study of atherosclerosis. Eur Heart J 2014;35:2232–41. [DOI] [PMC free article] [PubMed] [Google Scholar]
- 23. Blaha M, Budoff MJ, Shaw LJ, Khosa F, Rumberger JA, Berman D et al. Absence of coronary artery calcification and all-cause mortality. JACC Cardiovasc Imaging 2009;2:692–700. [DOI] [PubMed] [Google Scholar]
- 24. Goff DC Jr, Lloyd-Jones DM, Bennett G, Coady S, D'Agostino RB Sr, Gibbons R et al. 2013 ACC/AHA guideline on the assessment of cardiovascular risk: a report of the American College of Cardiology/American Heart Association task force on practice guidelines. Circulation 2014;129:S49–73. [DOI] [PubMed] [Google Scholar]
- 25. Michos ED, Vasamreddy CR, Becker DM, Yanek LR, Moy TF, Fishman EK et al. Women with a low Framingham risk score and a family history of premature coronary heart disease have a high prevalence of subclinical coronary atherosclerosis. Am Heart J 2005;150:1276–81. [DOI] [PubMed] [Google Scholar]
- 26. Bellasi A, Lacey C, Taylor AJ, Raggi P, Wilson PW, Budoff MJ et al. Comparison of prognostic usefulness of coronary artery calcium in men versus women (results from a meta- and pooled analysis estimating all-cause mortality and coronary heart disease death or myocardial infarction). Am J Cardiol 2007;100:409–14. [DOI] [PubMed] [Google Scholar]
- 27. Lakoski SG, Greenland P, Wong ND, Schreiner PJ, Herrington DM, Kronmal RA et al. Coronary artery calcium scores and risk for cardiovascular events in women classified as “Low risk” based on Framingham risk score: the multi-ethnic study of atherosclerosis (mesa). Arch Intern Med 2007;167:2437–42. [DOI] [PubMed] [Google Scholar]
- 28. Elias-Smale SE, Proenca RV, Koller MT, Kavousi M, van Rooij FJ, Hunink MG et al. Coronary calcium score improves classification of coronary heart disease risk in the elderly: the Rotterdam study. J Am Coll Cardiol 2010;56:1407–14. [DOI] [PubMed] [Google Scholar]
- 29. Rozanski A, Gransar H, Shaw LJ, Kim J, Miranda-Peats L, Wong ND et al. Impact of coronary artery calcium scanning on coronary risk factors and downstream testing the EISNER (early identification of subclinical atherosclerosis by noninvasive imaging research) prospective randomized trial. J Am Coll Cardiol 2011;57:1622–32. [DOI] [PMC free article] [PubMed] [Google Scholar]
- 30. Kalia NK, Miller LG, Nasir K, Blumenthal RS, Agrawal N, Budoff MJ. Visualizing coronary calcium is associated with improvements in adherence to statin therapy. Atherosclerosis 2006;185:394–9. [DOI] [PubMed] [Google Scholar]
- 31. Cho I, Chang HJ, Ó Hartaigh B, Shin S, Sung JM, Lin FY et al. Incremental prognostic utility of coronary CT angiography for asymptomatic patients based upon extent and severity of coronary artery calcium: results from the coronary CT angiography evaluation for clinical outcomes international multicenter (CONFIRM) study. Eur Heart J 2015;36:501–8. [DOI] [PMC free article] [PubMed] [Google Scholar]
- 32. Greenland P, Alpert JS, Beller GA, Benjamin EJ, Budoff MJ, Fayad ZA et al. 2010 ACCF/AHA guideline for assessment of cardiovascular risk in asymptomatic adults: a report of the American College of Cardiology foundation/American Heart Association task force on practice guidelines. Circulation 2010;122:e584–636. [DOI] [PubMed] [Google Scholar]
- 33. Taylor AJ, Cerqueira M, Hodgson JM, Mark D, Min J, O'Gara P et al. ACCF/SCCT/ACR/AHA/ASE/ASNC/NASCI/SCAI/SCMR 2010 appropriate use criteria for cardiac computed tomography. A report of the American College of Cardiology foundation appropriate use criteria task force, the Society of Cardiovascular Computed Tomography, the American College of Radiology, the American Heart Association, the American Society of Echocardiography, the American Society of Nuclear Cardiology, the North American Society for Cardiovascular imaging, the Society for Cardiovascular Angiography and Interventions, and the Society for Cardiovascular Magnetic Resonance. Circulation 2010;122:e525–55. [DOI] [PubMed] [Google Scholar]