Abstract
The Gleason grading system used to render prostate cancer diagnosis has recently been updated to allow more accurate grade stratification and higher prognostic discrimination when compared to the traditional grading system. In spite of progress made in trying to standardize the grading process, there still remains approximately a 30% grading discrepancy between the score rendered by general pathologists and those provided by experts while reviewing needle biopsies for Gleason pattern 3 and 4, which accounts for more than 70% of daily prostate tissue slides at most institutions. We propose a new computational imaging method for Gleason pattern 3 and 4 classification, which better matches the newly established prostate cancer grading system. The computer-aided analysis method includes two phases. First, the boundary of each glandular region is automatically segmented using a deep convolutional neural network. Second, color, shape and texture features are extracted from superpixels corresponding to the outer and inner glandular regions and are subsequently forwarded to a random forest classifier to give a gradient score between 3 and 4 for each delineated glandular region. The F1 score for glandular segmentation is 0.8460 and the classification accuracy is 0.83±0.03.
Keywords: Gleason grading, histopathology segmentation, convolutional neural network, random forest, regression
1 Introduction
With the rapid development and adoption of whole-slide microscopic imaging and the corresponding advances being made in terms of available computing power, the potential for developing a reliable, automated computer-aided diagnosis (CAD) system capable of performing objective, reproducible Gleason scoring while avoiding intra- and inter-observer variability is now technically feasible. The newly established prostate cancer grading system which has been developed by experts in the field, features a five-grade group system (group 1 to 5 as Gleason score ≤6, 3+4, 4+3, 8 and 9–10 respectively). This methodology offers more accurate grade stratification than traditional systems and provides the highest prognostic discrimination for all cohorts on both univariate and multivariate analysis[14]. This paper describes a computational imaging decision support framework which is investigated as a deployable tool to allow accurate discrimination among even the most challenging Gleason patterns 3 and 4 in prostate cancer diagnoses.
There have been many studies on computer-aided Gleason grading, however most of them are not focused analyzing intact glandular regions. In general there are four approaches on prostate Gleason pattern grading including color-statistical based[20], texture-based[9][11], structure-based[16] and tissue-component-based[4][15][19][6]. To achieve significant improvements in discriminating between Gleason score 3 and 4, it is essential to first perform accurate segmentation of individual glandular regions.
There are several prostate glandular segmentation methods for histopathology images using co-occurrence of lumen and nuclei or whole image texture information. These methods may work well for images with Gleason pattern 3 because the Gleason pattern 3 has a relative stable glandular shape while the Gleason pattern 4 consists of a range of glandular patterns including glomeruloid glands, cribriform glands, poorly formed and fused glands and irregular cribriform glands[18][17]. Recently, convolutional neural networks have been investigate for their capacity to perform quick, reliable segmentation in medical images[13]. Ciresan et. al has proposed a convolutional neural network (CNN) to segment neuronal membranes using sliding-window approach[3]. The method predicts the class of each pixel by using its surrounding region, which makes the training and testing process slow because each pixel with its surrounding region needs to be run individually. Meanwhile subjective choices regarding the patch size can affect the segmentation accuracy significantly.
In this paper, we propose a two-phase gland classification method. The classification of each gland is based on the accurate segmentation of glandular regions on Hematoxylin and Eosin (H&E) stained images. First, each image is delineated by the segmentation network to generate an image mask. We use semantic pixel-wise classification to get the binary mask of input RGB image. The segmentation networks includes encoding the image and then decoding it. Next, the features abstracted from each segmented gland are subsequently used as the inputs for a random forest and a score between 3 and 4 is given for each gland. Experimental results show that the two-phase classification approach developed by our team achieves improved prostate glandular segmentation and classification results on H&E stained images compared to state-of-the-art.
2 Methology
2.1 Prostate image segmentation
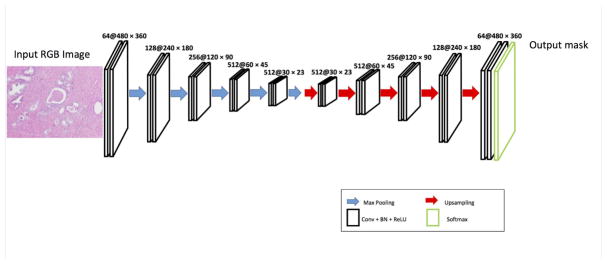
The segmentation network that we have developed is based on a convolution neural network which can be trained end-to-end with stochastic gradient descent to give the semantic pixel-wise segmentation of the original input RGB images. As shown in Figure 1, CNN consists of encoding and decoding module but does not contain a fully connected layer. Both the encoding portion of the network and the decoding component contain 10 convolutional layers. The encoding part includes the typical convolutional network and the convolutional layers are composed of kernel size 3×3 and padding size 1 and are followed by a rectified linear unit (ReLU) max(0, x), batch normalization (BN) layer[8] and 2×2 max pooling layer with stride 2. The max pooling layer is replaced by the upsampling layer[2] in the decoding component of the network. The upsampling layer uses the location from the max pooling layer to reverse operation of max pooling with stride 2. The final layer is the soft-max classifier for the binary classification with the cross-entropy loss function as the objective function to train the network.
Fig. 1.
The architecture of the semantic segmentation network
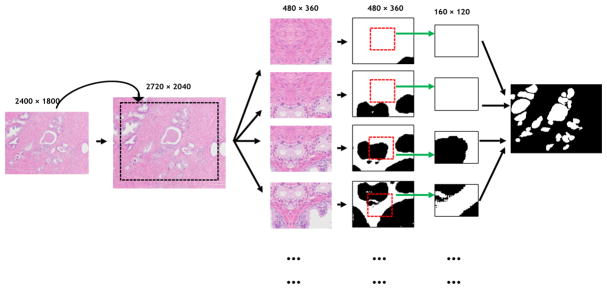
In order to retain the boundary information during the test phase, each image is mirrored by the four boundaries as shown in Figure 2. In this manner, the center of each output image can be utilized to form the seamless segmentation mask and the mask has the same size as the test image. Morphological operations are used as a post-processing step to remove artifacts.
Fig. 2.
Each test image is mirrored by four boundary sub-images in order to retain the boundary information. And each test image is cropped into several sub-images. Only the center of each predicted sub-image mask is kept to form the preliminary mask
2.2 Gland Grading based on segmentaion
Superpixel Segmentation
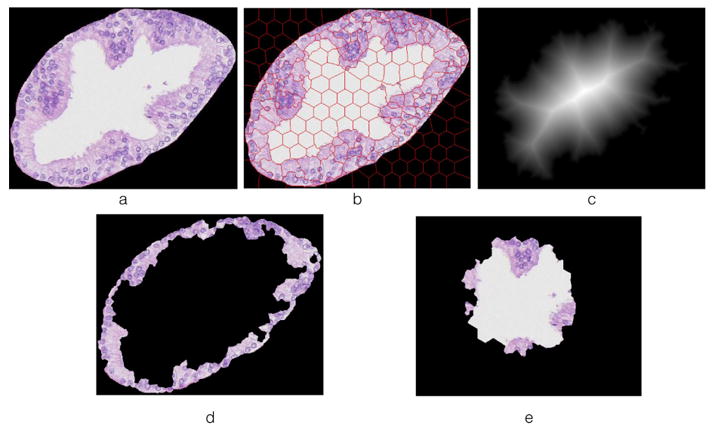
For the Gleason pattern 3 glands, the lumen is typically surrounded by nuclei. While glands begin to merge or fuse together in the Gleason pattern 4 glands, the lumen may not be surrounded by nuclei and their spatial co-localization could be an arbitrary pattern. Therefore we take advantage of the spatial structure pattern to differentiate Gleason pattern 3 and 4. Using superpixel segmentation method[1], the segmented glands from above step is then segmented into two sub-images: (1) the outer boundary image and (2) the inner center image. The segmented region Si is classified to the boundary image if they are adjacent to the background. Suppose the number of segmented regions in the boundary image is m. Then the center of the original image is extracted from the distance map. If there are m nearest superpixel regions adjacent to the center, those m nearest regions form the center image. If the left superpixel regions are less than m, all of them form the center image. An illustration of segmentation of outer boundary image and inner center image is shown in Figure 3.
Fig. 3.

(a) original image; (b) superpixel segmentation on the original image; (c) distance map of the original image; (d) image contains boundary information; (e) image contains center information
Feature Extraction
Texture, shape and color features are extracted from the boundary images and the center images to train the random forest classifier. The texture features are calculated by using Bag-Of-Word on SIFT features. SIFT texture features are extracted from 2/3 of training images and clustered by K-means algorithm. Using Bag-of-Word paradigm, each image has k-bins of spatial histogram of K-means cluster centers as its texture features. Here we use K equals 300 in our experiments after different K value testing. The shape descriptor in each image is represented by HOG features. And we use mean, standard deviation and the 5-bin histograms of intensities for each R, G, B channel to represent the color feature. All the texture, shape and color features are consolidated together. Suppose the set of features from the boundary image is represented by and the set of features from the center image is represented by . To enhance the difference between the boundary image and center image, we use to represent the features of the original gland image. w is is a weight parameter, varing from 0.1 to 0.9.
Random Forest Regression
The grading of each gland between 3 and 4 is based on random forest regression. A random forest is an ensemble of a number of decision trees, with each tree trained using a randomly selected training sets. The output of a decision tree is produced by branching an input left or right down the tree recursively until meet any leaf node. The decision forest combines the predictions from individual tree using an ensemble model and gives the regression output by averaging. The output score of the test image should be in the range of 3 to 4.
3 Experiment Results
Our experiments consist of 22 H&E stained prostate images from 22 difference patients. Using 5-fold cross-validation, each time randomly 17 images are selected as training images and the remaining 5 images are used as testing images for the segmentation network. The images are under 20× magnification with a size of 2400×1800. 25 images are cropped from each image and the size of the cropped image is 480×360. Each cropped image is horizontal flip and vertical flip, so 1275 images are used to train the image segmentation network. Precision (P), recall (R) and F1 score are used to measure the segmentation quantitatively. P is denoted as the intersection between the segmentation results and the manually annotation results divided by the segmentation results while R is divided by the manually annotation results. So we can have We achieve F1 score as 0.8460 which outperforms state-of-the-art methods[18][17]. Table 1 shows the segmentation performance comparison for different methods. Our method achieves the best performance compared to state-of-the-art methods. The segmentation network is implemented by using Caffe[10] on NVIDIA Quadro K5200 GPU with cuDNN acceleration.
Table 1.
Segmentation Performance Comparison for Different Methods
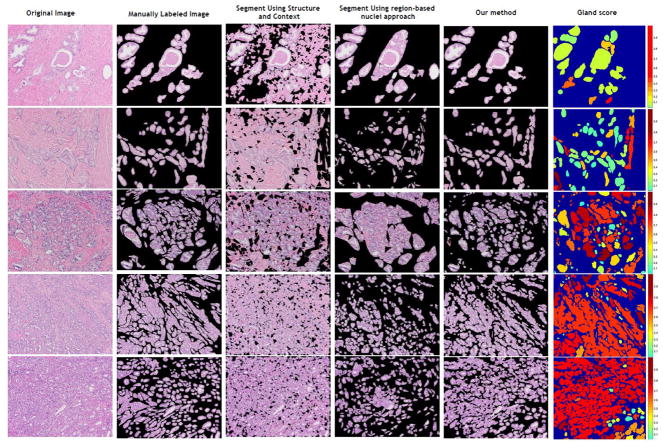
After the each gland is segmented, we use the 634 labeled glands to train the random forest classifier. All these glands are obtained from the 22 H&E stained images. Each gland image is resized as 360×360. The weight parameter w for the feature exaction equals to 0.7 for the best classification accuracy and the number of trees in the random forest is 160 for a stable regression score. We use 10-cross validation to perform the training. The sensitivity, specificity and accuracy for the classification are 0.70±0.15, 0.89±0.04 and 0.83±0.03 respectively. Figure 4 shows the segmentation results for different methods and the scores given for each gland after the segmentation.
Fig. 4.
Results are shown for different methods. The approach in this article performs better than segment using structure and context[17] and segment using region-based nuclei approach[18]. A score is given for each gland after segmentation
4 Conclusion
In this paper, we propose a new method for quantitatively analyzing histopathology prostate cancer images representative of Gleason pattern 3 and 4. The computer-aided analysis framework that our team developed for performing prostate Gleason grading achieves a better segmentation result compared to the state-of-the-art approaches[17][18]. Meanwhile it provides a quick reliable means for grading glandular regions especially those types more often found in Gleason pattern 4. Based on these results, the methods described in the paper may lead to a more reliable approach to assist pathologists in performing stratification of prostate cancer patients and improves therapy planning. In future investigations, we will expand the size and scope of the studies to train a deeper network and gauge performance over a wider set of staining characteristics. Further by using the score distribution of each segmented glandular region, it would help pathologists make a better grading matching the new Gleason grading system.
Acknowledgments
This research was funded, in part, by grants from NIH contract 5R01CA156386-10 and NCI contract 5R01CA161375-04, NLM contracts 5R01LM009239-07 and 5R01LM011119-04.
References
- 1.Achanta R, Shaji A, Smith K, Lucchi A, Fua P, Susstrunk S. Slic superpixels compared to state-of-the-art superpixel methods. Pattern Analysis and Machine Intelligence, IEEE Transactions on. 2012;34(11):2274–2282. doi: 10.1109/TPAMI.2012.120. [DOI] [PubMed] [Google Scholar]
- 2.Badrinarayanan V, Kendall A, Cipolla R. Segnet: A deep convolutional encoder-decoder architecture for image segmentation. 2015. arXiv preprint arXiv:1511.00561. [DOI] [PubMed] [Google Scholar]
- 3.Ciresan D, Giusti A, Gambardella LM, Schmidhuber J. Deep neural networks segment neuronal membranes in electron microscopy images. Advances in neural information processing systems. 2012:2843–2851. [Google Scholar]
- 4.Doyle S, Feldman M, Tomaszewski J, Madabhushi A. A boosted bayesian multiresolution classifier for prostate cancer detection from digitized needle biopsies. Biomedical Engineering, IEEE Transactions on. 2012;59(5):1205–1218. doi: 10.1109/TBME.2010.2053540. [DOI] [PubMed] [Google Scholar]
- 5.Doyle S, Hwang M, Shah K, Madabhushi A, Feldman M, Tomas J. Automated grading of prostate cancer using architectural and textural image features. Biomedical Imaging: From Nano to Macro, 2007. ISBI 2007; 4th IEEE International Symposium on; IEEE; 2007. pp. 1284–1287. [Google Scholar]
- 6.Gorelick L, Veksler O, Gaed M, Gomez JA, Moussa M, Bauman G, Fenster A, Ward AD. Prostate histopathology: Learning tissue component histograms for cancer detection and classification. Medical Imaging, IEEE Transactions on. 2013;32(10):1804–1818. doi: 10.1109/TMI.2013.2265334. [DOI] [PubMed] [Google Scholar]
- 7.Huang PW, Lee CH. Automatic classification for pathological prostate images based on fractal analysis. Medical Imaging, IEEE Transactions on. 2009;28(7):1037–1050. doi: 10.1109/TMI.2009.2012704. [DOI] [PubMed] [Google Scholar]
- 8.Ioffe S, Szegedy C. Batch normalization: Accelerating deep network training by reducing internal covariate shift. 2015 arXiv preprint arXiv:1502.03167. [Google Scholar]
- 9.Jafari-Khouzani K, Soltanian-Zadeh H. Multiwavelet grading of pathological images of prostate. Biomedical Engineering, IEEE Transactions on. 2003;50(6):697–704. doi: 10.1109/TBME.2003.812194. [DOI] [PubMed] [Google Scholar]
- 10.Jia Y, Shelhamer E, Donahue J, Karayev S, Long J, Girshick R, Guadarrama S, Darrell T. Caffe: Convolutional architecture for fast feature embedding. Proceedings of the ACM International Conference on Multimedia; ACM; 2014. pp. 675–678. [Google Scholar]
- 11.Khurd P, Bahlmann C, Maday P, Kamen A, Gibbs-Strauss S, Genega EM, Frangioni JV. Computer-aided gleason grading of prostate cancer histopathological images using texton forests. Biomedical Imaging: From Nano to Macro, 2010 IEEE International Symposium on; IEEE; 2010. pp. 636–639. [DOI] [PMC free article] [PubMed] [Google Scholar]
- 12.Khurd P, Grady L, Kamen A, Gibbs-Strauss S, Genega EM, Frangioni JV. Network cycle features: Application to computer-aided gleason grading of prostate cancer histopathological images. Biomedical Imaging: From Nano to Macro, 2011 IEEE International Symposium on; IEEE; 2011. pp. 1632–1636. [DOI] [PMC free article] [PubMed] [Google Scholar]
- 13.Krizhevsky A, Sutskever I, Hinton GE. Imagenet classification with deep convolutional neural networks. Advances in neural information processing systems. 2012:1097–1105. [Google Scholar]
- 14.Matoso A, Epstein JI. Grading of prostate cancer: Past, present, and future. Current urology reports. 2016;17(3):1–6. doi: 10.1007/s11934-016-0576-4. [DOI] [PubMed] [Google Scholar]
- 15.Nguyen K, Jain AK, Allen RL. Automated gland segmentation and classification for gleason grading of prostate tissue images. Pattern Recognition (ICPR), 2010 20th International Conference on; IEEE; 2010. pp. 1497–1500. [Google Scholar]
- 16.Nguyen K, Sabata B, Jain AK. Prostate cancer grading: Gland segmentation and structural features. Pattern Recognition Letters. 2012;33(7):951–961. [Google Scholar]
- 17.Nguyen K, Sarkar A, Jain AK. Structure and context in prostatic gland segmentation and classification. Medical Image Computing and Computer-Assisted Intervention–MICCAI 2012; Springer; 2012. pp. 115–123. [DOI] [PubMed] [Google Scholar]
- 18.Ren J, Sadimin ET, Wang D, Epstein JI, Foran DJ, Qi X. Computer aided analysis of prostate histopathology images gleason grading especially for gleason score 7. Engineering in Medicine and Biology Society (EMBC), 2015 37th Annual International Conference of the IEEE; IEEE; 2015. pp. 3013–3016. [DOI] [PMC free article] [PubMed] [Google Scholar]
- 19.Riddick A, Shukla C, Pennington C, Bass R, Nuttall R, Hogan A, Sethia K, Ellis V, Collins A, Maitland N, et al. Identification of degradome components associated with prostate cancer progression by expression analysis of human prostatic tissues. British journal of cancer. 2005;92(12):2171–2180. doi: 10.1038/sj.bjc.6602630. [DOI] [PMC free article] [PubMed] [Google Scholar]
- 20.Tabesh A, Teverovskiy M, Pang HY, Kumar VP, Verbel D, Kotsianti A, Saidi O. Multifeature prostate cancer diagnosis and gleason grading of histological images. Medical Imaging, IEEE Transactions on. 2007;26(10):1366–1378. doi: 10.1109/TMI.2007.898536. [DOI] [PubMed] [Google Scholar]


