

Supplemental Digital Content is available in the text
Keywords: competing endogenous RNA, differentially expressed RNAs, human bladder cancer, long-noncoding RNA
Abstract
Human bladder cancer (BCa) is one of the most commonly diagnosed malignancies worldwide. It has high recurrence rates and low-grade malignancy, thus representing an important public health concern. An increasing number of studies suggest that long-noncoding RNAs (lncRNAs) play important roles in various biological processes and disease pathologies, including cancer.
We analyzed the expression profiles of lncRNA, miRNA, and mRNA, along with the clinical information of BCa patients collected from the Cancer Genome Atlas database to identify lncRNA biomarkers for prognosis. We also constructed an lncRNA–miRNA–mRNA global triple network (competitive endogenous RNA network) by bioinformational approach.
This BCa lncRNA–miRNA–mRNA network consisted of 23 miRNA nodes, 52 mRNA nodes, 59 lncRNA nodes, and 365 edges. Subsequent gene ontology (GO) and pathway analyses were performed using BinGO for Cytoscape and Database for Annotation, Visualization, and Integration Discovery, respectively, highlighting important GO terms and pathways that were enriched in the network. Subnetworks were created using 3 key lncRNAs (MAGI2-AS3, ADAMTS9-AS2, and LINC00330), revealing associations with BCa-linked mRNAs and miRNAs. Finally, an analysis of significantly differentiating RNAs found 6 DElncRNAs (AC112721.1, ADAMTS9-AS1, ADAMTS9-AS2, HCG22, MYO16-AS1, and SACS-AS1), 1 DEmiRNA (miRNA-195), and 6 DEmRNAs (CCNB1, FAM129A, MAP1B, TMEM100, AIFM3, and HOXB5) that correlated with BCa patient survival.
Our results provide a novel perspective from which to study the lncRNA-related ceRNA network in BCa, contributing to the development of future diagnostic biomarkers and therapeutic targets.
1. Introduction
Human bladder cancer (BCa) is one of the most common malignancies worldwide, with high morbidity and mortality.[1] BCa encompasses a wide spectrum of disease, ranging from superficial, well-differentiated carcinomas that do not affect survival, to highly aggressive tumors with poor prognosis.[2,3] In 2017, there were approximately 79,030 new cases diagnosed in the United States (60,490 males and 18,540 females), leading to 16,870 deaths (12,240 males and 4630 females).[4] Although BCa is linked to several universal genetic changes, identifying the mechanisms that underlie cancer progression remains challenging due to complicated disease processes and numerous molecular interactions. Therefore, the identification of potential biomarkers and novel targets for prognosis, diagnosis, and treatment is urgently needed.
Recently, the role that long-noncoding RNAs (lncRNAs) may play in cancer progression has received increased attention. These are nonprotein coding transcripts longer than 200 nucleotides[5] that are broadly distributed throughout the genome.[6–9] Previous studies have demonstrated that lncRNAs are involved in modulating gene expression at the transcriptional, post-transcriptional, and epigenetic levels.[10] Evidence also suggests that lncRNAs contribute to the control of a variety of biological processes (BP), including the maintenance of genome integrity, stem cell pluripotency, cell differentiation, genomic imprinting, and X inactivation.[11–13] As such, lncRNAs are thought to associate with the pathogenesis of many different cancers, including hepatocellular liver cancer,[14] esophageal squamous cell carcinoma,[15] colorectal cancer,[16] renal cell carcinoma,[17] gastric cancer,[18] and prostate cancer.[19] These studies indicate that lncRNAs could potentially serve as diagnostic or prognostic markers for human cancer, including BCa. However, the exact functions of most lncRNAs, including any putative role in BCa, are unclear and further study is urgently required.
In order to better understand how noncoding RNAs (ncRNAs) may be involved in BP and pathogenesis, a competitive endogenous RNA (ceRNA) network hypothesis has been proposed.[20] This framework aims to describe how 3 types of RNA transcript (lncRNA, miRNA, and mRNA) interact to regulate transcription, creating a new fundamental “language” that describes transcriptional control by miRNA binding sites and miRNA response elements. A key hypothesis of ceRNA theory is that miRNAs play an important role in the ceRNA network by binding mRNA, inhibiting mRNA expression. LncRNAs also affect transcription by competing with miRNAs, subsequently affecting expression of the target mRNA.[21] Research has also shown that ceRNA and related theories may provide an important new tool to advance tumor diagnoses and treatment options. For example, Sumazin et al[22] systematically investigated an mRNA-related ceRNA network in glioblastoma cells, confirming that these ceRNA interactions mediate the crosstalk between oncogenic pathways. Aiding this research is several well-established RNA databases that provide useful information to understand ncRNA-mediated ceRNA regulatory mechanisms. These include the long-noncoding RNA-associated diseases (LncRNADisease) database,[23] the Human miRNA Disease Database,[24] and database of Differentially Expressed MiRNAs in human Cancers dbDEMC.[25] There are also several miRNA-target interactions databases, including miRcode[26] and miRanda,[27–29] and the ceRNA-specific long-noncoding competing endogenous database (lnCeDB).[30]
To establish if lncRNAs have a role in the progression of BCa, our study constructed a global triple RNA network based on ceRNA theory using data from the Cancer Genome Atlas (TCGA). Gene ontology (GO) and pathway analyses were performed using the BinGO plug-in for Cytoscape and the Database for Annotation, Visualization, and Integration Discovery (DAVID), respectively, to reveal any associations between mRNAs in the network and BCa. Next, important hub lncRNAs were identified in the lncRNA–miRNA–mRNA network and new subnetworks formulated that centered on these lncRNAs. Further GO and pathway analysis of these subnetworks revealed several important processes and miRNAs that link these lncRNAs to BCa. These data provide valuable insights into the molecular progression of BCa and will contribute to identify potential mechanisms of pathogenesis. This will improve the diagnosis and prognosis of BCa, in addition to aiding the identification of putative drug targets.
2. Materials and methods
2.1. Data collection and preprocessing
A total of 418 patients with BCa were enrolled in our comprehensive integrated analysis. Data were downloaded from the TCGA database (http://tcga-data.nci.nih.gov/) using the Data Transfer Tool provided with GDC Apps. For the study, level 3 mRNASeq gene expression data, miRNASeq data, and clinical information of patients were downloaded (http://tcga-data.nci.nih.gov/). Sequencing data were collected using Illumina HiSeq RNASeq and Illumina HiSeq miRNASeq platforms (Illumina, San Diego, CA) and the study was performed in line with the publication guidelines provided by TCGA (http://cancergenome.nih.gov/publicaitons/publicationguidelines). Ethical approval was not necessary in our study because the expression profiles were downloaded from the public database and no new experiments in patients or animals were performed.
2.2. Screening of differentially expressed genes
EdgeR (http://bioconductor.org/packages/release/bioc/html/edgeR.html)[31] was used to screen differentially expressed lncRNAs (DElncRNAs), miRNAs (DEmiRNAs), and mRNAs (DEmRNAs) from the dataset by comparing normal and BCa groups. P values were calculated using post hoc tests using a significance threshold of P < .01 and |fold change (FC)| > 2.0. Hierarchical clustering was visualized using the gplots package of R (http://cran.r-project.org/web/packages/gplots/index.html).[32]
2.3. Competing endogenous RNA network analysis
To investigate the potential roles of lncRNAs within the mediated ceRNA network, a coexpression network of DEmRNAs, DElncRNAs, and DEmiRNAs was built using Cytoscape v 3.5.1 software.[33] miRNA-targeted mRNAs were retrieved from miRTarBase (http://mirtarbase.mbc.nctu.edu.tw/). Each miRNA–mRNA pair used was preciously experimentally validated by reporter assay and at least 2 of the following methods; qRT-PCR, western blotting, microarray, and next-generation sequencing experiments in miRTarBase. In addition, lncRNA–miRNA interactions were constructed based on miRcode (http://www.microde.org/).[26]
2.4. GO and pathway analysis
The GO analysis database (http://geneontology.org) was used to annotates genes and gene products to identify associating biological attributes in the transcriptome and high-throughput genome data.[34,35] Similarly, the Kyoto Encyclopedia of Genes and Genomes (KEGG) knowledge database (http://www.kegg.jp/) was used for the systematic analysis of gene functions, linking genomic information with higher-order functional information.[36] To evaluate pathways and BP that were DE in the ceRNA network, the DAVID[37,38] (http://david.abcc.ncifcrf.gov/) and the BinGO[39] plug-in for Cytoscape were used for functional enrichment analysis. KEGG pathways and GO BP were highlighted at a significance threshold of P < .05[40] and a −log 10 (P) denoted enrichment scores with significant pathway correlations.
2.5. Construction of key lncRNA–miRNA–mRNA subnetworks
Each downloaded lncRNA, and its linked miRNAs and mRNAs in the ceRNA network, were extracted and used to construct new subnetworks using Cytoscape software. In the study, degree centrality (a fundamental parameter in network theory) was adopted to evaluate each node in order to identify key lncRNAs in the subnetwork. Degree centrality was defined as the number of adjacent links for the node and was determined from the number of interactions that connected each RNA to its neighbors. The degree centrality method was calculated using the CytoHubba[41] plug-in for Cytoscape. Further analysis involved identifying the GO and pathway annotations for each of the key lncRNAs by establishing their mRNA neighbors in the lncRNA–miRNA–mRNA subnetwork. GO interaction networks were then reconstructed using the BinGO plug-in for Cytoscape.
2.6. Survival analysis
To identify any prognostic DEmRNA, DEmiRNA, or DElncRNA signatures, clinical data from patients with BCa were collected from the TCGA. Survival curves for each sample with DElncRNAs, DEmiRNAs, and DEmRNAs were creating using the “survival” R package. Univariate survival was estimated using a Kaplan–Meier univariate survival method.[42]P < .01 was considered significant.
3. Results
3.1. Identifying DEmRNAs, DEmiRNAs, and DElncRNAs in BCa samples
The RNA expression profiles of patients with BCa and corresponding clinical information were downloaded from the TCGA database using the Data Transfer Tool. We then used EdgeR to identify significantly DEmRNAs, DEmiRNAs, and DElncRNAs between BCa and normal samples (DEmRNAs, DEmiRNAs, and DElncRNAs). This identified a total of 1819 DEmRNAs, 157 DEmiRNAs, and 666 DElncRNAs. More specifically, there were 1030 (56.2%) up-regulated and 789 (43.37%) down-regulated DEmRNAs (Table S1), 131 (83.4%) up-regulated and 26 (16.5%) down-regulated DEmiRNAs (Table S2), and 246 (36.9%) down-regulated DElncRNAs and 420 (63.1%) up-regulated DElncRNAs identified (Table S3). A heat map demonstrating the complete linkage clustering of DEmRNAs, DEmiRNAs, and DElncRNAs is shown in Fig. 1.
Figure 1.
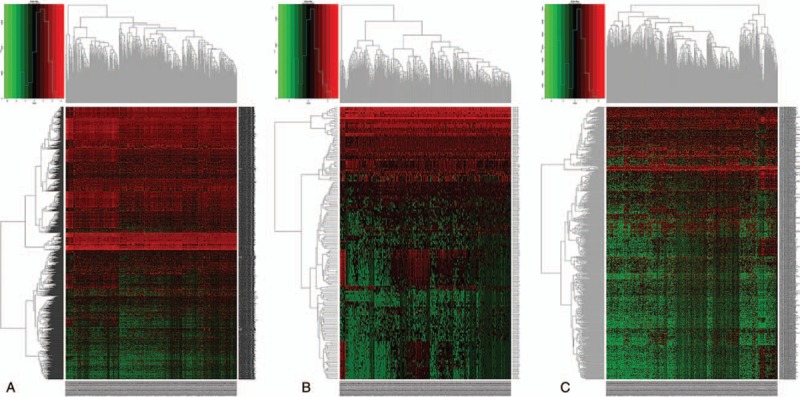
Heatmap of differentially expressed (DE) RNAs comparing patients with bladder cancer to controls. (A) DEmRNAs, (B) DEmiRNAs, and (C) DElncRNAs are shown. The left vertical axis indicates the clusters of differentially expressed RNAs, whereas the right vertical axis indicates RNA names. Red represents up-regulated RNAs and green represents down-regulated RNAs.
3.2. Construction of the ceRNA network
To reveal how lncRNA may mediate transcription in BCa by affecting mRNA and miRNA binding, a ceRNA network based on the lists of DElncRNAs, DEmiRNAs, and DEmRNAs was constructed and visualized using Cytoscape software. As shown in Fig. 2, the lncRNA–miRNA–mRNA network was comprised of 23 miRNA nodes, 52 mRNA nodes, 59 lncRNA nodes, and 365 edges. We found that most DEmRNAs were tumor-related genes and including CBX2, DUSP2, ELAVL2, HOXB5, and ZEB1. Gene information was retrieved from the Onco database (http://www.bushmanlab.org/links/genelist).
Figure 2.
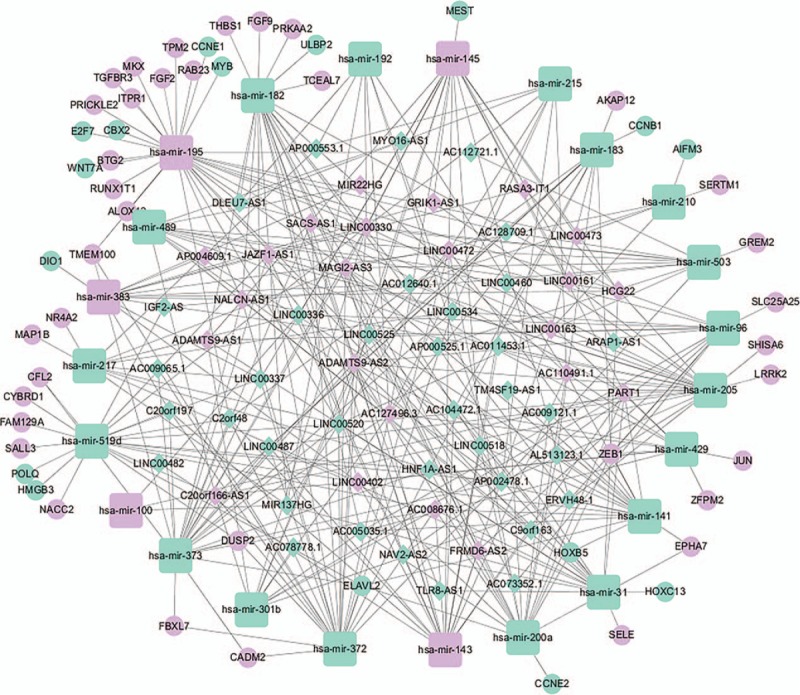
A competitive endogenous RNA network describing lncRNA–miRNA–mRNA interactions in human bladder cancer (BCa). Blue represents up-regulated genes and purple represents down-regulated genes. Diamonds represent lncRNAs, ellipses represent mRNAs, and rounded rectangles represent miRNAs.
3.3. Predicated functions of mRNAs within the lncRNA–miRNA–mRNA network
To establish context of our ceRNA network, we inferred the roles of each lncRNA based on the functions of connected mRNAs. lncRNAs were typically central and connected to one or more mRNAs in the network. The results of an initial GO analysis revealed 300 enriched GO terms at the “Biological Process” level for mRNAs connected to lncRNAs in the network. These included various BP, such as negative regulation of cell migration, regulation of cellular metabolic process, and regulation of cell proliferation. In order to fully explore the inner relationships between these GO terms, a GO interaction network was constructed using the BinGO plug-in for Cytoscape (Fig. 3). We next filtered GO terms with P < .05 and Benjamini corrected P < .05, leaving 122 that were determined to be significantly enriched. The 10 most significant BP are shown in Fig. 4A. Finally, KEGG pathway analysis revealed that 15 pathways were significantly enriched, particularly microRNAs involved in cancer, prostate cancer, and p53 signaling. The 10 most significant KEGG pathways are shown in Fig. 4B.
Figure 3.
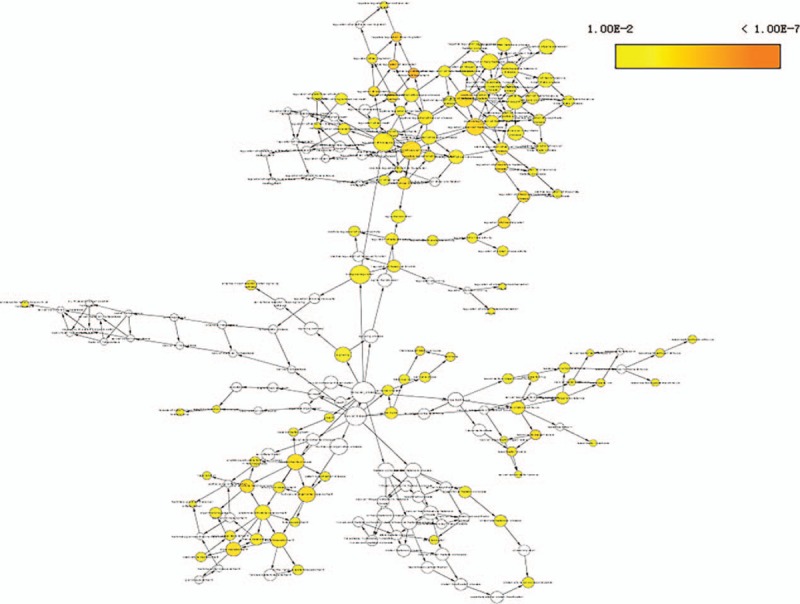
GO terms displayed as an interaction network using the BinGO plug-in for Cytoscape. Yellow nodes are those with P < .05 and a Benjamini corrected P < .05. GO = gene ontology.
Figure 4.
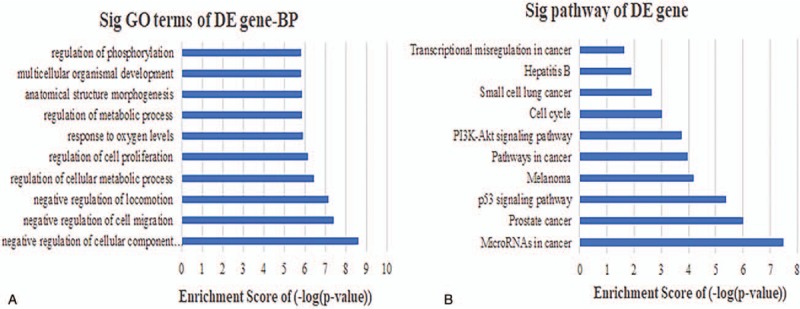
Biological function and pathway analysis of differentially expressed mRNAs. (A) The 10 most significantly enriched GO biological process. (B) The 10 most significantly enriched KEGG pathways. GO = gene ontology.
3.4. The construction of lncRNA–miRNA–mRNA subnetworks containing key lncRNAs
It has been shown in many settings that certain hub nodes play critical roles in biological networks. Accordingly, our ceRNA network revealed 22 nodes with a degree score exceeding 10, indicating that they were particularly important. These hubs consisted of 3 lncRNAs and 19 miRNAs (Table 1). The 3 lncRNAs (MAGI2-AS3, ADAMTS9-AS2, and LINC00330) had particularly high node degrees and were likely key nodes involved in the origin and development of BCa. As it has also been demonstrated that lncRNAs, miRNAs, and mRNAs interact and share similar coexpression patterns in ceRNA networks, linked mRNAs and miRNAs were extracted and new subnetworks for these 3 lncRNAs were constructed. As shown in Figs. 5A, 6A, and 7A, the lncRNA MAGI2-AS3–miRNA–mRNA subnetwork was comprised of 1 lncRNA node, 17 miRNA nodes, 46 mRNA nodes, and 77 edges. The lncRNA ADAMTS9-AS2–miRNA–mRNA subnetwork was composed of 1 lncRNA node, 15 miRNA nodes, 46 mRNA nodes, and 76 edges. The lncRNA LINC00330–miRNA–mRNA subnetwork was composed of 1 lncRNA node, 16 miRNA nodes, 41 mRNA nodes, and 70 edges. GO and pathway analysis using these new subnetworks revealed 319 GO terms and 7 pathways enriched in the lncRNA MAGI2-AS3 network, and 277 GO terms and 8 pathways enriched in the lncRNA ADAMTS9-AS2 network, and 152 GO terms and 6 pathways enriched in the lncRNA LINC00330 network. The GO interaction networks are shown in Figs. 5B, 6B, and 7B. The 10 most significant GO terms for each subnetwork are shown in Figs. 8A, 9A, and 10A, and the 10 most enriched KEGG pathways are shown in Figs. 8B, 9B, and 10B.
Table 1.
Differentially expressed genes with node degree >10.
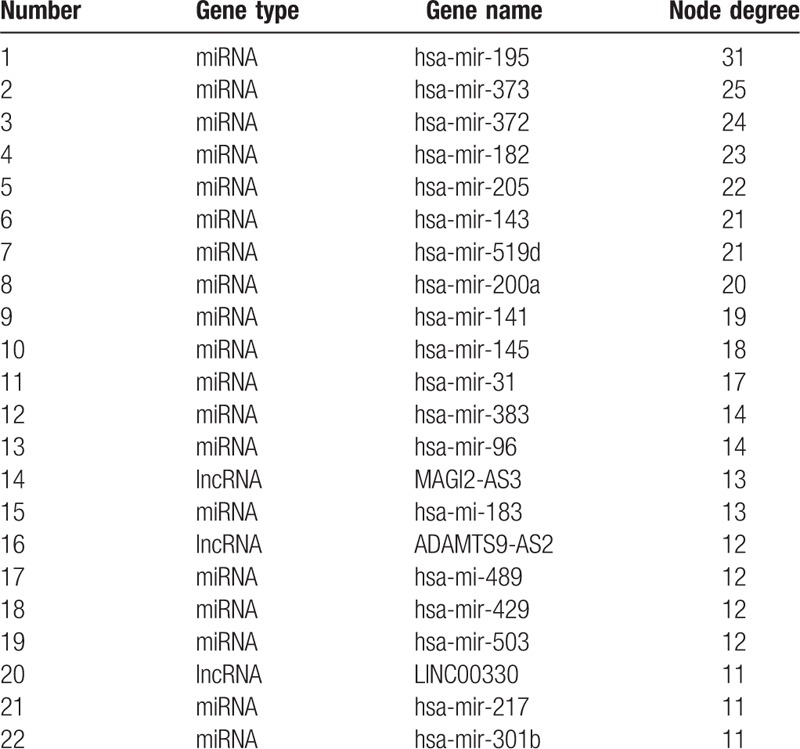
Figure 5.
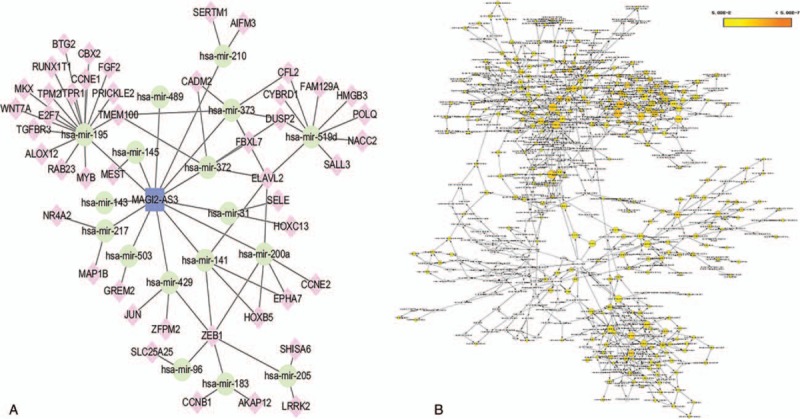
The subnetwork of lncRNA MAGI2-AS3 and related GO terms. (A) The lncRNA MAGI2-AS3 subnetwork. Rounded rectangles represent lncRNAs, ellipses represent miRNA, and diamonds represent mRNAs. (B) GO terms are displayed as an interaction network using the BinGO plug-in for Cytoscape. Yellow nodes are those with P < .05 and a Benjamini corrected P < .05. GO = gene ontology.
Figure 6.
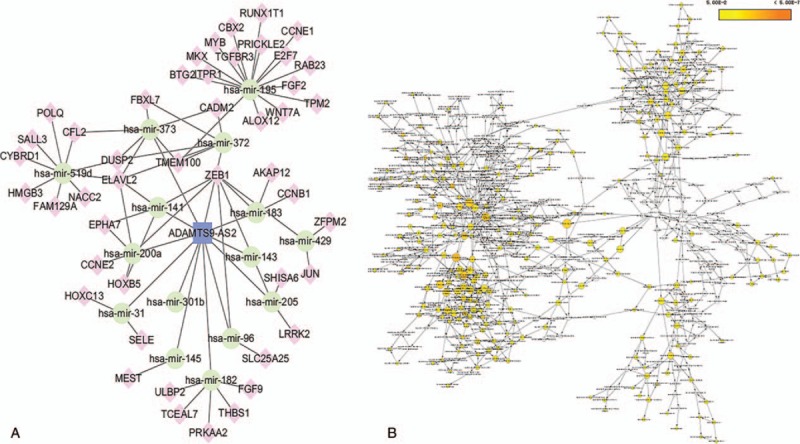
The subnetwork of lncRNA ADAMTS9-AS2 and related GO terms. (A) The lncRNA ADAMTS9-AS2 subnetwork. Rounded rectangles represent lncRNA, ellipses represent miRNA, and diamonds represent mRNAs. (B) GO terms are displayed as an interaction network using the BinGO plug-in for Cytoscape. Yellow nodes are those with P < .05 and a Benjamini corrected P < .05. GO = gene ontology.
Figure 7.
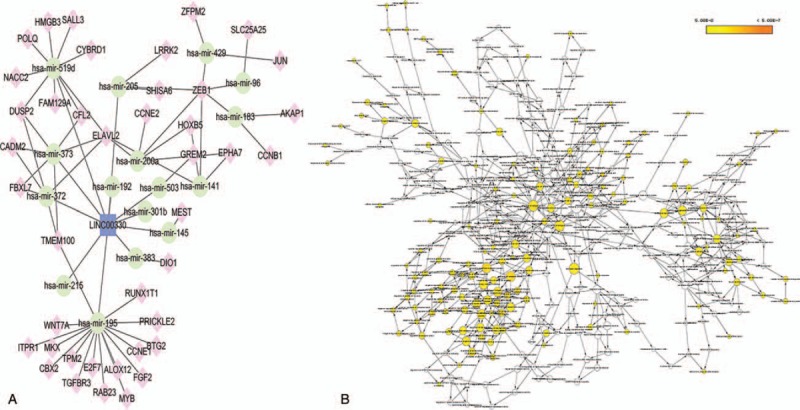
The subnetwork of lncRNA LINC00330 and related GO terms. (A) The lncRNA LINC00330 subnetwork. Rounded rectangles represent lncRNAs, ellipses represent miRNAs, and diamonds represent mRNAs. (B) GO terms are displayed as an interaction network using the BinGO plug-in for Cytoscape. Yellow nodes are those with P < .05 and a Benjamini corrected P < .05. GO = gene ontology.
Figure 8.
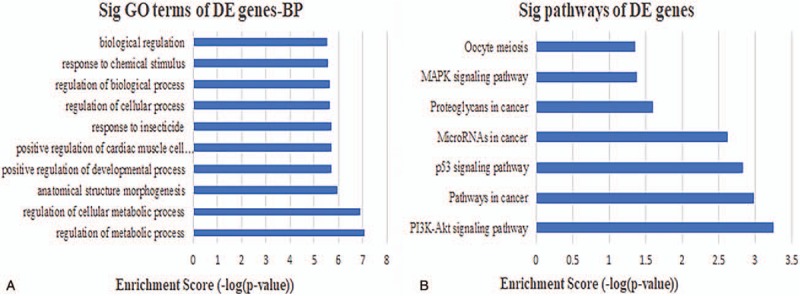
Biological function and pathway analysis of lncRNA MAGI2-AS3-related mRNAs. (A) The 10 most significant mRNA GO biological processes associated with lncRNA MAGI2-AS3. (B) The 10 most significant KEGG pathways in mRNAs linked to lncRNA MAGI2-AS3. GO = gene ontology.
Figure 9.
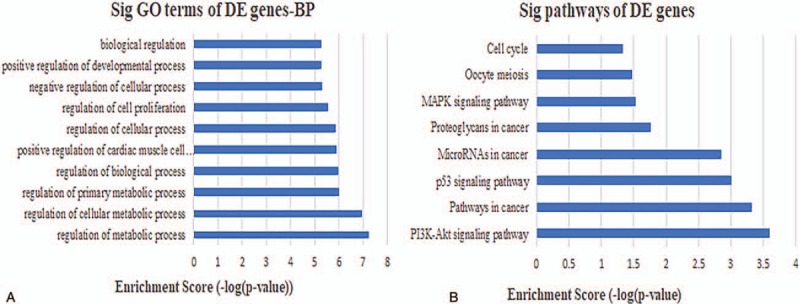
Biological function and pathway analysis of lncRNA ADAMTS9-AS2-related mRNAs. (A) The 10 most significant mRNA GO biological processes associated with lncRNA ADAMTS9-AS2. (B) The 10 most significant KEGG pathways in mRNAs linked to lncRNA ADAMTS9-AS2. GO = gene ontology.
Figure 10.
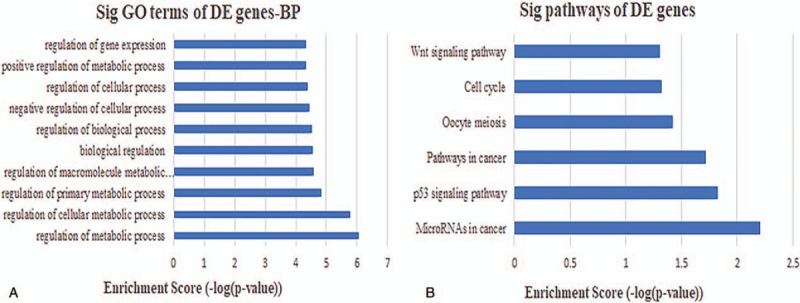
Biological function and pathway analysis of lncRNA LINC00330-related mRNAs. (A) The 10 most significant mRNA GO biological processes associated with lncRNA LINC00330. (B) The 10 most significant KEGG pathways in mRNAs linked to lncRNA LINC00330. GO = gene ontology.
3.5. Survival analysis
To investigate if any highlighted RNAs affected overall survival in patients with BCa, we performed Kaplan–Meier curve analysis to identify any prognostic signatures. This suggested that all of the key DElncRNAs, except LINC00330, associated with BCa progression. High expression of 6 DElncRNAs, including AC112721.1, ADAMTS9-AS1, ADAMTS9-AS2, HCG22, MYO16-AS1, and SACS-AS1, associated with poor prognoses (Fig. 11). Similar to the overall DElncRNA assessments, survival analysis for DEmiRNA-195 showed that DEmirRNAs have negative effects on the overall survival of patients (Fig. 11). In addition, there were 6 DEmRNAs that significantly associated with overall survival, including CCNB1, FAM129A, MAP1B, and TMEM100. High expression of these mRNAs negatively associated with overall survival. Conversely, higher expression of AIFM3 and HOXB5 predicted greater patient survival time.
Figure 11.
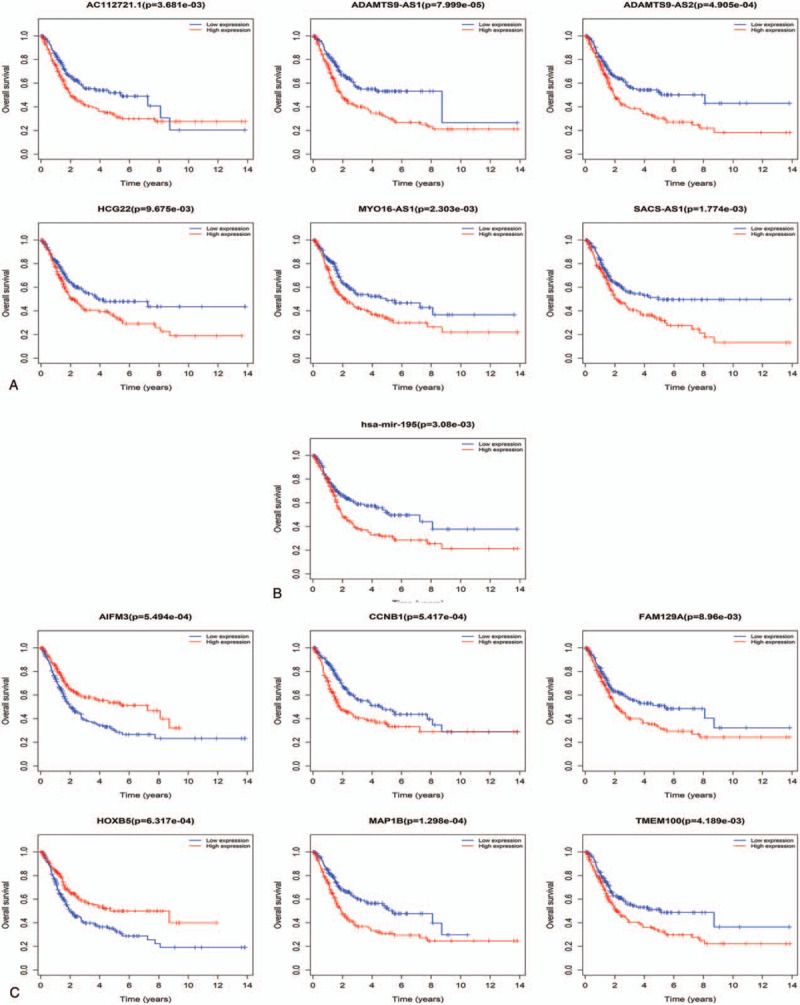
Kaplan–Meier survival curves for differentially expressed RNAs. (A) Six lncRNAs, (B) 1 miRNA, and (C) 6 mRNAs associated with overall survival. The horizontal axis shows overall survival time in years and the vertical axis represents the survival function.
4. Discussion
Human bladder carcinoma is a considerable global health concern,[43] although the molecular mechanisms that contribute to BCa progression remain unclear. This presents an obstacle to the development of new tools for diagnosis, prognosis, and identifying drug targets. While, ncRNAs have been shown to play a role in tumorigenesis through “miRNA-bridges,” a full understand of the interactions that lead to cancer development are uncertain.[44,45] One tool that can be used investigate the links between ncRNAs and cancer are competing endogenous RNA (ceRNA) networks. These can be applied to establish the post-transcriptional layers of gene regulation in a system. To ascertain whether there are ncRNAs that may be involved in the progression of BCa, we systematically constructed ceRNA networks using patient BCa data and examined links to DElncRNAs. This involved integrating multilevel molecular profiles from large-scale studies found in the TCGA database. The initial ceRNA network we constructed was comprised of 23 miRNA nodes, 52 mRNA nodes, 59 lncRNA nodes, and 365 edges, suggesting numerous lncRNAs that may be involved in gene regulatory networks and BCa genesis. To establish a mechanistic underpinning of the role of lncRNAs in BCa, we used GO and pathway analysis to assess biological functions enriched among the DEmRNAs linked in the ceRNA network. This revealed 300 GO terms enriched in BCa versus normal tissue, 122 of which had P < .05 and Benjamini corrected P < .05. These significant GO terms included processes involved in the negative regulation of cell migration, regulation of cellular metabolic process, and regulation of cell proliferation, consistent with previous findings.[46,47] Pathway analysis revealed 15 pathways that were enriched in the dataset, primarily involving microRNAs in cancer, prostate cancer, and the p53 signaling. These pathways have all been shown to play important roles in BCa.[48,49]
Of the 3 RNA families examined in our study, lncRNAs are considered to have the greatest potential as diagnostic and prognostic biomarkers due to close associations between lncRNAs expression and function.[50] For example, many studies have shown that differential lncRNA expression is closely related to tumor pathogenesis and prognosis in breast cancer, gastric cancer, liver cancer, lung cancer, and kidney cancer.[51–55] However, the diagnostic role of lncRNAs in BCa has not been fully investigated. To establish this, our study used the newly constructed ceRNA network to identify lncRNA hub nodes that could serve as novel biomarkers for BCa clinical diagnosis and treatment. This revealed 3 lncRNAs (MAGI2-AS3, ADAMTS9-AS2, and LINC00330) as topological key nodes with node degrees higher than other lncRNAs. This strongly suggests that these key lncRNAs are involved in BCa genesis and progression, although this will require experiment validation in future studies. Nevertheless, we selected these lncRNAs for further analysis, constructing separate subnetworks centered around the individual lncRNAs.
The lncRNA MAGI2-AS3 had the highest node degree among the 3 key lncRNAs and was connected to numerous mRNAs and miRNAs that have been previously been shown to be involved in BCa, such as miR-200 and miR-143, validating our approach. Using the lncRNA MAGI2-AS3–miRNA–mRNA subnetwork formulated in the study, we speculated that MAGI2-AS3 may play a role in altering the expression of BCa-related downstream mRNAs through competitive interactions with certain miRNA families, including miR-200 and miR-143. In support of this hypothesis, recent studies have confirmed that miR-200 and miR-143 play a crucial role in the development of BCa. For example, Adam et al reported that miR-200 expression regulates epithelial-to-mesenchymal transition in BCa cell.[56] Further analysis of the GO and pathway analysis for connected mRNAs indicated 319 GO terms and 7 pathways enriched in the network, all of which have been shown to be involved in BCa.[57] In particular, the PI3K/AKT signaling pathway has been shown to trigger a signaling cascade that regulates cancer cell proliferation, invasion, metastasis, and survival, in addition to affecting patient prognosis.[58–60] The PI3K/AKT signaling pathway has also been implicated in BCa and down-regulation of miR-29c inhibits cell proliferation in a BCa cell line via the PI3K/AKT pathway.[61]
ADAMTS9-AS2 was the second key lncRNA we identified and is an antisense overlapping lncRNA located upstream from ADAMTS9, a newly described tumor suppressor gene.[18] Yao et al examined experimental data to suggest that a decrease in lncRNA ADAMTS9-AS2 expression associated with the diagnosis, clinicopathological characteristics, and prognosis of glioma. This suggests that ADAMTS9-AS2 is involved in suppressing cell migration, partly by regulating the protein coding gene ADAMTS9.[62] Our survival analysis also indicated that ADAMTS9-AS2 was important to the progression of BCa and high expression associated with poor prognosis. Examination of the lncRNA ADAMTS9-AS2–miRNA–mRNA subnetwork created in the study indicated that ADAMTS9-AS2 regulates the expression of several BCa-related mRNAs, again through competitive interactions with various miRNAs, such as miR-200 and miR-141. Several studies have confirmed that both miR-200 and miR-141 have the potential to be used for the diagnosis of invasive bladder tumors, even after being missed through pathologic assessments of bladder biopsy specimens.[63,64] Our analysis also revealed 277 GO terms and 8 pathways enriched in the mRNAs in the subnetwork, all previously implicated in BCa. Among these signaling pathways, the p53 signaling pathway has been shown to play a critical role in cancer pathogenesis and treatment (apoptosis) resistance. p53 is therefore an important cellular drug target[65,66] and is also involved in the pathogenic mechanisms of BCa. For example, Zhu et al confirmed that downregulation of the tumor suppressor gene LOC572558 regulates p53 signaling in BCa.[67]
The lncRNA LINC00330 that was highlighted in the study is a relatively underreported lncRNA, although examination of the LINC00330–miRNA–mRNA subnetwork suggests it may have the greatest potential for use as a diagnostic or prognostic biomarker. Our analysis suggests that LINC00330 regulates the expression of numerous BCa-related mRNAs through interactions with miRNAs involved in the regulation of tumor progression, including miR-195 and miR-145. Both miR-195 and miR-145 are well-described tumor-suppressing miRNAs that promote apoptosis and inhibit cell proliferation, tumor angiogenesis, and metastasis.[68–72] Our survival analysis indicated that a high expression of miR-195 correlates with worse prognoses for patients with BCa. Previous reports also suggest that the lncRNA UCA1 promotes mitochondrial function during BCa by modulating the miR-195/ARL2 signaling pathway.[73] We also examined the GO and pathway annotations for the mRNAs in the subnetwork, revealing 152 GO terms and 6 pathways that were enriched. These included numerous signaling pathways, including the Wnt signaling pathway that has been shown to regulate cell fate decisions and to affect cell proliferation, morphology, migration, apoptosis, or differentiation in a wide varieties of tissues.[74,75] The Wnt signaling pathway has also been shown to be involved in BCa. For instance, Chen et al[76] confirmed that HBO1 promotes BCa proliferation and tumorigenicity via activation of the Wnt signaling pathway. Moreover, we noted that some of the lncRNAs were associated with overall survival in patients with BCa, specifically AC112721.1, ADAMTS9-AS1, HCG22, MYO16-AS1, and SACS-AS1. However, these key lncRNAs were novel RNAs associated with BCa, suggesting that they are seldom reported.
MRNAs, the hub elements of the ceRNA network, can be directly targeted by miRNAs or have indirect interactions with lncRNAs mediated by miRNAs. Similar to the lncRNAs and miRNAs, some mRNAs were also found to be associated with the survival of BCa patients. Examples of such are mRNA CCNB1, FAM129A, MAP1B, TMEM100, AIFM3, and HOXB5. Chai et al[77] revealed that the high-level expression of CCNB1 is closely associated with poor prognosis in hepatocellular carcinoma (HCC) patients. Taylor et al[78] suggested that low expression of FAM129A acted as predictor of poor prognosis with multiple probes, while low tissue mRNA expression of FAM129A was also associated with a poor outcome.[79] Previous studies have demonstrated that MAP1B interacts with p53 to influence mediated cell apoptosis and proliferation, and loss of this gene may contribute to the cancer cell's ability proliferate.[80] In addition, Han et al had found that TMEM100 was used as cancer suppressor in HCC and nonsmall cell lung cancer.[81] Additionally, AIFM3 has been reported to act as a direct target of miR-210 that is related to proliferation of human hepatoma cells.[82] Moreover, Luo et al have confirmed that HOXB5 was over-expressed in BCa tissues and promoted cell proliferation and the migration of BCa cells, indicating HOXB5s ability to act as an oncogene.[83]
5. Conclusions
We have constructed an lncRNA–miRNA–mRNA network based on the ceRNA hypothesis. This has enabled us to conduct an overarching review and analysis of lncRNAs that associate with the development of BCa. Three key lncRNAs were identified (MAGI2-AS3, ADAMTS9-AS2, and LINC00330) that likely play important roles in the development and progression of BCa. This study contributes to understanding the pathogenesis of BCa and the role that lncRNAs play in disease progression. These novel lncRNAs may serve as candidate diagnostic biomarkers or therapeutic targets to improve future treatment options for BCa.
Author contributions
Conceptualization: Yuanhao Wu, Geng Li, Guiyun Ma, Jinxin Liu.
Data curation: Yuanhao Wu.
Formal analysis: Geng Li.
Methodology: Jinxin Liu.
Project administration: Bin Chen.
Resources: Youxin Song.
Software: Guiyun Ma, Youxin Song, Wenjia Zhao.
Supervision: Guiyun Ma, Wenjia Zhao.
Visualization: Youxin Song.
Writing – original draft: Naiqiang Zhu, Jingyi Hou.
Supplementary Material
Supplementary Material
Supplementary Material
Footnotes
Abbreviations: BCa = bladder cancer, BP = biological processes, ceRNA = competitive endogenous RNA, DAVID = Database for Annotation, Visualization, and Integration Discovery, DE = differentially expressed, GO = gene ontology, HCC = hepatocellular carcinoma, KEGG = Kyoto Encyclopedia of Genes and Genomes, lncRNAs = long noncoding RNAs, ncRNAs = noncoding RNAs, TCGA = The Cancer Genome Atlas.
This study was supported by the China Postdoctoral Science Foundation (2017M610815); the Hebei Natural Science Foundation (H2017406031); the Young Talents Project of Hebei Education Department (BJ201602); the National Natural Science Foundation of China (81641136, 81703659, and 81503506) and the Chengde city science and technology research and development projects (20151048).
The authors have no conflicts of interest to disclose.
Supplemental Digital Content is available for this article.
References
- [1].Huang M, Zhong Z, Lv M, et al. Comprehensive analysis of differentially expressed profiles of lncRNAs and circRNAs with associated co-expression and ceRNA networks in bladder carcinoma. Oncotarget 2016;7:47186–200. [DOI] [PMC free article] [PubMed] [Google Scholar]
- [2].Bellmunt J. Bladder cancer. Hematol Oncol Clin North Am 2015;29:xiii–v. [DOI] [PubMed] [Google Scholar]
- [3].Li S, Liu X, Liu T, et al. Identification of biomarkers correlated with the TNM staging and overall survival of patients with bladder cancer. Front Physiol 2017;8:947. [DOI] [PMC free article] [PubMed] [Google Scholar]
- [4].Siegel RL, Miller KD, Jemal A. Cancer statistics, 2017. CA Cancer J Clin 2017;67:7–30. [DOI] [PubMed] [Google Scholar]
- [5].Ponting CP, Oliver PL, Reik W. Evolution and functions of long noncoding RNAs. Cell 2009;136:629–41. [DOI] [PubMed] [Google Scholar]
- [6].Mercer TR, Mattick JS. Structure and function of long noncoding RNAs in epigenetic regulation. Nat Struct Mol Biol 2013;20:300–7. [DOI] [PubMed] [Google Scholar]
- [7].Cao D, Ding Q, Yu W, et al. Long noncoding RNA SPRY4-IT1 promotes malignant development of colorectal cancer by targeting epithelial-mesenchymal transition. Onco Targets Ther 2016;9:5417–25. [DOI] [PMC free article] [PubMed] [Google Scholar]
- [8].Li B, Chen P, Qu J, et al. Activation of LTBP3 gene by a long noncoding RNA (lncRNA) MALAT1 transcript in mesenchymal stem cells from multiple myeloma. J Biol Chem 2014;289:29365–75. [DOI] [PMC free article] [PubMed] [Google Scholar]
- [9].Zhou Q, Chen J, Feng J, et al. Long noncoding RNA PVT1 modulates thyroid cancer cell proliferation by recruiting EZH2 and regulating thyroid-stimulating hormone receptor (TSHR). Tumour Biol 2016;37:3105–13. [DOI] [PubMed] [Google Scholar]
- [10].Popadin K, Gutierrez-Arcelus M, Dermitzakis ET, et al. Genetic and epigenetic regulation of human lincRNA gene expression. Am J Hum Genet 2013;93:1015–26. [DOI] [PMC free article] [PubMed] [Google Scholar]
- [11].Sun J, Lin Y, Wu J. Long non-coding RNA expression profiling of mouse testis during postnatal development. PLoS ONE 2013;8:e75750. [DOI] [PMC free article] [PubMed] [Google Scholar]
- [12].Mattick JS. The central role of RNA in human development and cognition. FEBS Lett 2011;585:1600–16. [DOI] [PubMed] [Google Scholar]
- [13].Yu W, Gius D, Onyango P, et al. Epigenetic silencing of tumour suppressor gene p15 by its antisense RNA. Nature 2008;451:202–6. [DOI] [PMC free article] [PubMed] [Google Scholar]
- [14].Wang F, Yuan JH, Wang SB, et al. Oncofetal long noncoding RNA PVT1 promotes proliferation and stem cell-like property of hepatocellular carcinoma cells by stabilizing NOP2. Hepatology 2014;60:1278–90. [DOI] [PubMed] [Google Scholar]
- [15].Li J, Chen Z, Tian L, et al. LncRNA profile study reveals a three-lncRNA signature associated with the survival of patients with oesophageal squamous cell carcinoma. Gut 2014;63:1700–10. [DOI] [PMC free article] [PubMed] [Google Scholar]
- [16].Hu Y, Chen HY, Yu CY, et al. A long non-coding RNA signature to improve prognosis prediction of colorectal cancer. Oncotarget 2014;5:2230–42. [DOI] [PMC free article] [PubMed] [Google Scholar]
- [17].Fachel AA, Tahira AC, Vilella-Arias SA, et al. Expression analysis and in silico characterization of intronic long noncoding RNAs in renal cell carcinoma: emerging functional associations. Mol Cancer 2013;12:140. [DOI] [PMC free article] [PubMed] [Google Scholar]
- [18].Li F, Huang C, Li Q, et al. Construction and comprehensive analysis for dysregulated long non-coding RNA (lncRNA)-associated competing endogenous RNA (ceRNA) network in gastric cancer. Med Sci Monit 2018;24:37–49. [DOI] [PMC free article] [PubMed] [Google Scholar]
- [19].Crea F, Watahiki A, Quagliata L, et al. Identification of a long non-coding RNA as a novel biomarker and potential therapeutic target for metastatic prostate cancer. Oncotarget 2014;5:764–74. [DOI] [PMC free article] [PubMed] [Google Scholar]
- [20].Salmena L, Poliseno L, Tay Y, et al. A ceRNA hypothesis: the Rosetta Stone of a hidden RNA language. Cell 2011;146:353–8. [DOI] [PMC free article] [PubMed] [Google Scholar]
- [21].Bartel DP. MicroRNAs: target recognition and regulatory functions. Cell 2009;136:215–33. [DOI] [PMC free article] [PubMed] [Google Scholar]
- [22].Sumazin P, Yang X, Chiu HS, et al. An extensive microRNA-mediated network of RNA-RNA interactions regulates established oncogenic pathways in glioblastoma. Cell 2011;147:370–81. [DOI] [PMC free article] [PubMed] [Google Scholar]
- [23].Chen G, Wang Z, Wang D, et al. LncRNADisease: a database for long-non-coding RNA-associated diseases. Nucleic Acids Res 2013;41:D983–6. [DOI] [PMC free article] [PubMed] [Google Scholar]
- [24].Li Y, Qiu C, Tu J, et al. HMDD v2.0: a database for experimentally supported human microRNA and disease associations. Nucleic Acids Res 2014;42:D1070–4. [DOI] [PMC free article] [PubMed] [Google Scholar]
- [25].Yang Z, Ren F, Liu C, et al. dbDEMC: a database of differentially expressed miRNAs in human cancers. BMC Genomics 2010;11(suppl 4):S5. [DOI] [PMC free article] [PubMed] [Google Scholar]
- [26].Jeggari A, Marks DS, Larsson E. miRcode: a map of putative microRNA target sites in the long non-coding transcriptome. Bioinformatics 2012;28:2062–3. [DOI] [PMC free article] [PubMed] [Google Scholar]
- [27].Betel D, Koppal A, Agius P, et al. Comprehensive modeling of microRNA targets predicts functional non-conserved and non-canonical sites. Genome Biol 2010;11:R90. [DOI] [PMC free article] [PubMed] [Google Scholar]
- [28].Betel D, Wilson M, Gabow A, et al. The microRNA.org resource: targets and expression. Nucleic Acids Res 2008;36:D149–53. [DOI] [PMC free article] [PubMed] [Google Scholar]
- [29].Shah MY, Calin GA. MicroRNAs as therapeutic targets in human cancers. Wiley Interdiscip Rev RNA 2014;5:537–48. [DOI] [PMC free article] [PubMed] [Google Scholar]
- [30].Das S, Ghosal S, Sen R, et al. lnCeDB: database of human long noncoding RNA acting as competing endogenous RNA. PLoS ONE 2014;9:e98965. [DOI] [PMC free article] [PubMed] [Google Scholar]
- [31].Robinson MD, McCarthy DJ, Smyth GK. edgeR: a Bioconductor package for differential expression analysis of digital gene expression data. Bioinformatics 2010;26:139–40. [DOI] [PMC free article] [PubMed] [Google Scholar]
- [32].Dean CB, Nielsen JD. Generalized linear mixed models: a review and some extensions. Lifetime Data Anal 2007;13:497–512. [DOI] [PubMed] [Google Scholar]
- [33].Shannon P, Markiel A, Ozier O, et al. Cytoscape: a software environment for integrated models of biomolecular interaction networks. Genome Res 2003;13:2498–504. [DOI] [PMC free article] [PubMed] [Google Scholar]
- [34].Ashburner M, Ball CA, Blake JA, et al. Gene ontology: tool for the unification of biology. The Gene Ontology Consortium. Nat Genet 2000;25:25–9. [DOI] [PMC free article] [PubMed] [Google Scholar]
- [35].Gene Ontology Consortium. The Gene Ontology (GO) project in 2006. Nucleic Acids Res 2006;34:D322–6. [DOI] [PMC free article] [PubMed] [Google Scholar]
- [36].Altermann E, Klaenhammer TR. PathwayVoyager: pathway mapping using the Kyoto Encyclopedia of Genes and Genomes (KEGG) database. BMC Genomics 2005;6:60. [DOI] [PMC free article] [PubMed] [Google Scholar]
- [37].Huang da W, Sherman BT, Lempicki RA. Systematic and integrative analysis of large gene lists using DAVID bioinformatics resources. Nat Protoc 2009;4:44–57. [DOI] [PubMed] [Google Scholar]
- [38].Huang da W, Sherman BT, Lempicki RA. Bioinformatics enrichment tools: paths toward the comprehensive functional analysis of large gene lists. Nucleic Acids Res 2009;37:1–3. [DOI] [PMC free article] [PubMed] [Google Scholar]
- [39].Maere S, Heymans K, Kuiper M. BiNGO: a Cytoscape plugin to assess overrepresentation of gene ontology categories in biological networks. Bioinformatics 2005;21:3448–9. [DOI] [PubMed] [Google Scholar]
- [40].Dennis G, Sherman BT, Hosack DA, et al. DAVID: Database for Annotation, Visualization, and Integrated Discovery. Genome Biol 2003;4:P3. [PubMed] [Google Scholar]
- [41].Chin CH, Chen SH, Wu HH, et al. cytoHubba: identifying hub objects and sub-networks from complex interactome. BMC Syst Biol 2014;8(suppl 4):S11. [DOI] [PMC free article] [PubMed] [Google Scholar]
- [42].Goeman JJ, Oosting J, Cleton-Jansen AM, et al. Testing association of a pathway with survival using gene expression data. Bioinformatics 2005;21:1950–7. [DOI] [PubMed] [Google Scholar]
- [43].Rubio G, García-Mora B, Santamaría C, et al. A flowgraph model for bladder carcinoma. Theor Biol Med Model 2014;11(suppl 1):S3. [DOI] [PMC free article] [PubMed] [Google Scholar]
- [44].Song C, Zhang J, Liu Y, et al. Construction and analysis of cardiac hypertrophy-associated lncRNA-mRNA network based on competitive endogenous RNA reveal functional lncRNAs in cardiac hypertrophy. Oncotarget 2016;7:10827–40. [DOI] [PMC free article] [PubMed] [Google Scholar]
- [45].Wu Q, Guo L, Jiang F, et al. Analysis of the miRNA-mRNA-lncRNA networks in ER+ and ER− breast cancer cell lines. J Cell Mol Med 2015;19:2874–87. [DOI] [PMC free article] [PubMed] [Google Scholar]
- [46].Zhou C, Ding J, Wu Y. Resveratrol induces apoptosis of bladder cancer cells via miR-21 regulation of the Akt/Bcl-2 signaling pathway. Mol Med Rep 2014;9:1467–73. [DOI] [PubMed] [Google Scholar]
- [47].Zheng J, Zhu X, Zhang J. CXCL5 knockdown expression inhibits human bladder cancer T24 cells proliferation and migration. Biochem Biophys Res Commun 2014;446:18–24. [DOI] [PubMed] [Google Scholar]
- [48].Zhao F, Ge YZ, Zhou LH, et al. Identification of hub miRNA biomarkers for bladder cancer by weighted gene coexpression network analysis. Onco Targets Ther 2017;10:5551–9. [DOI] [PMC free article] [PubMed] [Google Scholar]
- [49].Zhang DQ, Zhou CK, Chen SZ, et al. Identification of hub genes and pathways associated with bladder cancer based on co-expression network analysis. Oncol Lett 2017;14:1115–22. [DOI] [PMC free article] [PubMed] [Google Scholar]
- [50].Zhang H, Chen Z, Wang X, et al. Long non-coding RNA: a new player in cancer. J Hematol Oncol 2013;6:37. [DOI] [PMC free article] [PubMed] [Google Scholar]
- [51].Poliseno L, Salmena L, Zhang J, et al. A coding-independent function of gene and pseudogene mRNAs regulates tumour biology. Nature 2010;465:1033–8. [DOI] [PMC free article] [PubMed] [Google Scholar]
- [52].Wang J, Liu X, Wu H, et al. CREB up-regulates long non-coding RNA, HULC expression through interaction with microRNA-372 in liver cancer. Nucleic Acids Res 2010;38:5366–83. [DOI] [PMC free article] [PubMed] [Google Scholar]
- [53].Liu XH, Sun M, Nie FQ, et al. Lnc RNA HOTAIR functions as a competing endogenous RNA to regulate HER2 expression by sponging miR-331-3p in gastric cancer. Mol Cancer 2014;13:92. [DOI] [PMC free article] [PubMed] [Google Scholar]
- [54].Wang L, Zhang N, Wang Z, et al. Pseudogene PTENP1 functions as a competing endogenous RNA (ceRNA) to regulate PTEN expression by sponging miR-499-5p. Biochemistry (Mosc) 2016;81:739–47. [DOI] [PubMed] [Google Scholar]
- [55].Song X, Cao G, Jing L, et al. Analysing the relationship between lncRNA and protein-coding gene and the role of lncRNA as ceRNA in pulmonary fibrosis. J Cell Mol Med 2014;18:991–1003. [DOI] [PMC free article] [PubMed] [Google Scholar]
- [56].Adam L, Zhong M, Choi W, et al. miR-200 expression regulates epithelial-to-mesenchymal transition in bladder cancer cells and reverses resistance to epidermal growth factor receptor therapy. Clin Cancer Res 2009;15:5060–72. [DOI] [PMC free article] [PubMed] [Google Scholar]
- [57].Shen Y, Wang X, Jin Y, et al. Differentially expressed genes and interacting pathways in bladder cancer revealed by bioinformatic analysis. Mol Med Rep 2014;10:1746–52. [DOI] [PMC free article] [PubMed] [Google Scholar]
- [58].Yulyana Y, Ho IA, Sia KC, et al. Paracrine factors of human fetal MSCs inhibit liver cancer growth through reduced activation of IGF-1R/PI3K/Akt signaling. Mol Ther 2015;23:746–56. [DOI] [PMC free article] [PubMed] [Google Scholar]
- [59].Zeng N, Hongbo T, Xu Y, et al. Anticancer activity of caffeic acid n-butyl ester against A431 skin carcinoma cell line occurs via induction of apoptosis and inhibition of the mTOR/PI3K/AKT signaling pathway. Mol Med Rep 2018;17:5652–7. [DOI] [PMC free article] [PubMed] [Google Scholar] [Retracted]
- [60].Zhang W, Xiong Z, Wei T, et al. Nuclear factor 90 promotes angiogenesis by regulating HIF-1α/VEGF-A expression through the PI3K/Akt signaling pathway in human cervical cancer. Cell Death Dis 2018;9:276. [DOI] [PMC free article] [PubMed] [Google Scholar]
- [61].Fan Y, Song X, Du H, et al. Down-regulation of miR-29c in human bladder cancer and the inhibition of proliferation in T24 cell via PI3K-AKT pathway. Med Oncol 2014;31:65. [DOI] [PubMed] [Google Scholar]
- [62].Yao J, Zhou B, Zhang J, et al. A new tumor suppressor LncRNA ADAMTS9-AS2 is regulated by DNMT1 and inhibits migration of glioma cells. Tumour Biol 2014;35:7935–44. [DOI] [PubMed] [Google Scholar]
- [63].Wszolek MF, Rieger-Christ KM, Kenney PA, et al. A microRNA expression profile defining the invasive bladder tumor phenotype. Urol Oncol 2011;29:794.e1–801.e1. [DOI] [PubMed] [Google Scholar]
- [64].Song T, Xia W, Shao N, et al. Differential miRNA expression profiles in bladder urothelial carcinomas. Asian Pac J Cancer Prev 2010;11:905–11. [PubMed] [Google Scholar]
- [65].Stegh AH. Targeting the p53 signaling pathway in cancer therapy: the promises, challenges and perils. Expert Opin Ther Targets 2012;16:67–83. [DOI] [PMC free article] [PubMed] [Google Scholar]
- [66].Park M, Upton D, Blackmon M, et al. Anacardic acid inhibits pancreatic cancer cell growth, and potentiates chemotherapeutic effect by Chmp1A-ATM—p53 signaling pathway. BMC Complement Altern Med 2018;18:71. [DOI] [PMC free article] [PubMed] [Google Scholar]
- [67].Zhu Y, Dai B, Zhang H, et al. Long non-coding RNA LOC572558 inhibits bladder cancer cell proliferation and tumor growth by regulating the AKT-MDM2-p53 signaling axis. Cancer Lett 2016;380:369–74. [DOI] [PubMed] [Google Scholar]
- [68].Li D, Zhao Y, Liu C, et al. Analysis of MiR-195 and MiR-497 expression, regulation and role in breast cancer. Clin Cancer Res 2011;17:1722–30. [DOI] [PubMed] [Google Scholar]
- [69].Ding J, Huang S, Wang Y, et al. Genome-wide screening reveals that miR-195 targets the TNF-α/NF-β pathway by down-regulating IκB kinase alpha and TAB3 in hepatocellular carcinoma. Hepatology 2013;58:654–66. [DOI] [PubMed] [Google Scholar]
- [70].Wang R, Zhao N, Li S, et al. MicroRNA-195 suppresses angiogenesis and metastasis of hepatocellular carcinoma by inhibiting the expression of VEGF, VAV2, and CDC42. Hepatology 2013;58:642–53. [DOI] [PubMed] [Google Scholar]
- [71].Xu T, Zhu Y, Xiong Y, et al. MicroRNA-195 suppresses tumorigenicity and regulates G1/S transition of human hepatocellular carcinoma cells. Hepatology 2009;50:113–21. [DOI] [PubMed] [Google Scholar]
- [72].Zhu Y, Wang C, Becker SA, et al. miR-145 antagonizes SNAI1-mediated stemness and radiation resistance in colorectal cancer. Mol Ther 2018;26:744–54. [DOI] [PMC free article] [PubMed] [Google Scholar]
- [73].Li HJ, Sun XM, Li ZK, et al. LncRNA UCA1 promotes mitochondrial function of bladder cancer via the MiR-195/ARL2 signaling pathway. Cell Physiol Biochem 2017;43:2548–61. [DOI] [PubMed] [Google Scholar]
- [74].Cadigan KM, Nusse R. Wnt signaling: a common theme in animal development. Genes Dev 1997;11:3286–305. [DOI] [PubMed] [Google Scholar]
- [75].Glackin CA. Targeting the Twist and Wnt signaling pathways in metastatic breast cancer. Maturitas 2014;79:48–51. [DOI] [PubMed] [Google Scholar]
- [76].Chen Z, Zhou L, Wang L, et al. HBO1 promotes cell proliferation in bladder cancer via activation of Wnt/α-catenin signaling. Mol Carcinog 2018;57:12–21. [DOI] [PubMed] [Google Scholar]
- [77].Chai N, Xie HH, Yin JP, et al. FOXM1 promotes proliferation in human hepatocellular carcinoma cells by transcriptional activation of CCNB1. Biochem Biophys Res Commun 2018;500:924–9. [DOI] [PubMed] [Google Scholar]
- [78].Taylor BS, Schultz N, Hieronymus H, et al. Integrative genomic profiling of human prostate cancer. Cancer Cell 2010;18:11–22. [DOI] [PMC free article] [PubMed] [Google Scholar]
- [79].Glinsky GV, Glinskii AB, Stephenson AJ, et al. Gene expression profiling predicts clinical outcome of prostate cancer. J Clin Invest 2004;113:913–23. [DOI] [PMC free article] [PubMed] [Google Scholar]
- [80].Lee SY, Kim JW, Jeong MH, et al. Microtubule-associated protein 1B light chain (MAP1B-LC1) negatively regulates the activity of tumor suppressor p53 in neuroblastoma cells. FEBS Lett 2008;582:2826–32. [DOI] [PubMed] [Google Scholar]
- [81].Han Z, Wang T, Han S, et al. Low-expression of TMEM100 is associated with poor prognosis in non-small-cell lung cancer. Am J Transl Res 2017;9:2567–78. [PMC free article] [PubMed] [Google Scholar]
- [82].Yang W, Sun T, Cao J, et al. Downregulation of miR-210 expression inhibits proliferation, induces apoptosis and enhances radiosensitivity in hypoxic human hepatoma cells in vitro. Exp Cell Res 2012;318:944–54. [DOI] [PubMed] [Google Scholar]
- [83].Luo J, Cai Q, Wang W, et al. A microRNA-7 binding site polymorphism in HOXB5 leads to differential gene expression in bladder cancer. PLoS ONE 2012;7:e40127. [DOI] [PMC free article] [PubMed] [Google Scholar]
Associated Data
This section collects any data citations, data availability statements, or supplementary materials included in this article.