Abstract
Cerebrospinal venous anatomy and hemodynamics changes are associated with many central nervous system disorders.
The aim of this study was to detect whether perihematomal edema (PHE) after spontaneous intracerebral hemorrhage (sICH) is associated with cerebral venous outflow volume (CVFV) in the internal jugular veins and vertebral veins.
Newly diagnosed cases of sICH between April 2016 and March 2017 were enrolled and patients were grouped to the mean value of PHE according to previous study. On computed tomography, absolute PHE volume was calculated as the difference between total lesion volume and intracerebral hemorrhage (ICH) volume. Relative PHE volume was defined as absolute PHE volume divided by ICH volume. CVFV was determined by Doppler ultrasound. Patients were divided according to mean values of absolute PHE at 3 and 12 days, and relative PHE (rPHE) at 3 and 12 days.
Significant differences were observed in smoking, alcohol consumption, glycosylated hemoglobin (GHb), secondary intraventricular hemorrhage (sIVH), and CVFV in PHE at 72 hours. Only sIVH and CVFV were significantly different at 12 days in PHE. In rPHE, GHb and sIVH were significantly differed at 72 hours. No significant difference was observed at 12 days in rPHE. The multivariate analyses showed that CVFV was independently associated with late PHE (PHE at 12 ± 3 days) but not with early PHE (PHE at 72 hours) and rPHE.
These results suggest that CVFV may be closely related to PHE after sICH.
Keywords: cerebral venous outflow, perihematomal edema, spontaneous intracerebral hemorrhage
1. Introduction
Spontaneous intracerebral hemorrhage (sICH) is a serious cerebrovascular disease and is associated with a poor prognosis. The mortality and morbidity of sICH have been associated with early hematoma expansion, reduction in cerebral perfusion pressure, and raised intracranial pressure (ICP).[1,2] Intracerebral hemorrhage (ICH) not only lead to primary brain injury through the direct mass effect of the hematoma, but also to secondary brain injury resulting in the formation of perihematomal edema (PHE), which evolves over hours to days. PHE can further augment the mass effect of the hemorrhage.[3] Nevertheless, whether or not PHE formation contributes to morbidity and mortality is still controversial. It is widely accepted that hematoma-induced neuronal damage is irreversible, while that from PHE is reversible, making PHE a potential therapeutic target.[2]
There are several potential mechanisms underlying PHE after ICH. In the very early phase (i.e., over the first few hours), there is the development of hydrostatic pressure and clot retraction, and the serum diffuses from the hematoma into the surrounding cerebral tissue. The second phase (i.e., over the first few days) involves coagulation and thrombin. The third phase is related to erythrocyte lysis and hemoglobin (Hb) toxicity. Nevertheless, the predictors and prognostic significance of growth in cerebral edema after ICH are still controversial.[4]
The internal jugular veins (IJVs) are the main ways of cerebral blood drainage. Duplex ultrasound is a simple method to measure venous blood flow in IJVs and vertebral veins (VVs).[5,6] Several studies have found that cerebrospinal venous anatomy and hemodynamics changes are associated with many central nervous system disorders including leukoaraiosis dementia, normal-pressure hydrocephalus, multiple sclerosis, and edema after stroke.[7–10] Therefore, we hypothesized that venous blood flow in the IJVs and VVs participates in the mechanism of PHE after sICH. Hence, the aim of the present study was to detect whether PHE after sICH is associated with cerebral venous outflow volume (CVFV) in the IJVs and VVs.
2. Methods
2.1. Study design
This cross-sectional study was conducted at the Department of Neurology of Beijing Tiantan Hospital. This study has been approved by the Ethics Committee of Beijing Tiantan Hospital affiliated to the Capital Medical University of China, in compliance with the Declaration of Helsinki. Written informed consent study was obtained from all patients or their legal representative.
2.2. Patients
Between April 2016 and March 2017, newly diagnosed sICH cases were prospectively enrolled. ICH was confirmed by computed tomography (CT) scan. The inclusion criteria were age between 18 and 80 years; patients diagnosed with supratentorial sICH; and time from the onset of the symptoms to the first CT scan was <24 hours. The exclusion criteria were deep coma [Glasgow Coma Scale (GCS) 3–5]; anticoagulant therapy, trauma, tumor, arteriovenous malformations, or subarachnoid hemorrhage; acute thrombolysis- or coagulopathy-caused ICH; systemic disease influencing venous hemodynamics (venous thrombosis, arteriovenous malformation, dural fistulas, massive right ventricular insufficiency, or pulmonary hypertension); or surgical intervention before the follow-up CT scan.
In order to investigate the relationship between CVFV and PHE, we classified the patients according to the mean value of the 72-hour absolute PHE (10.18 mL), 72-hour relative PHE (0.97), 12-day absolute PHE (13.38 mL), and 12-day relative PHE (1.14). Patients with PHE larger than the values presented above were grouped into the larger group and those with PHE smaller than the mean value were grouped in the smaller group.[11]
2.3. Baseline data
Demographics including age, sex, and body mass index (BMI) (kg/m2) were recorded. Blood samples were collected from each patient the day of hospital admission for the measurement of white blood cell, platelets, Hb, creatinine, blood urea nitrogen, uric acid, blood glucose, international normalized ratio, activated partial thromboplastin time, glycosylated hemoglobin (GHb), and erythrocyte sedimentation. Clinical and neurological evaluations were performed, including first blood pressure measurement after onset, as well as history of smoking, hemorrhagic and ischemic stroke, diabetes mellitus, and hypertension. History of smoking was defined as currently smoking or past smoking (i.e., no smoking for the past 5 years). Arterial hypertension was defined as systolic blood pressure ≥140 mm Hg and/or diastolic blood pressure ≥90 mm Hg, or self-reported current treatment for arterial hypertension with antihypertensive medications. On the admission day, the patients were assessed for stroke severity, consciousness state, and the level of handicap according to the National Institutes of Health Stroke Scale[12] and GCS.[13]
2.4. Imaging
Diagnosis was determined by CT scanner (General Electric), with 512 × 512 matrix, FOV of 15 cm, and slice thickness of 9 or 10 mm (supratentorial) and 4.5 or 5 mm (infratentorial). Two neuroradiologists blindly and independently reviewed the CT scans, and hemorrhage with intraventricular extension was documented. Absolute PHE volume was calculated as the difference between total lesion volume and hematoma volume. Briefly, the examiner drew regions of interest by tracing the hyperdense area perimeter, representing the hematoma [Hounsfield unit (HU) range, 40–100 HU], and the hypodense region surrounding the hematoma, indicating PHE (range, 5–33 HU), in each slice throughout the lesion. Hematoma and total lesion volumes were calculated by multiplying the specific traced area by slice thickness and summing the results. PHE was measured by subtracting the hyperdense volume (hematoma) from the total lesion area (hyperdense + hypodense lesion area) (Fig. 1). Relative PHE was then calculated by dividing the absolute PHE by hematoma volume.[14] When PHE was undetectable, PHE volume value of zero was assigned. Hematomas were classified as “deep” if they were located in the basal ganglia, thalamus, or internal capsule; all other hemorrhages were classified as “lobar.”[15]
Figure 1.
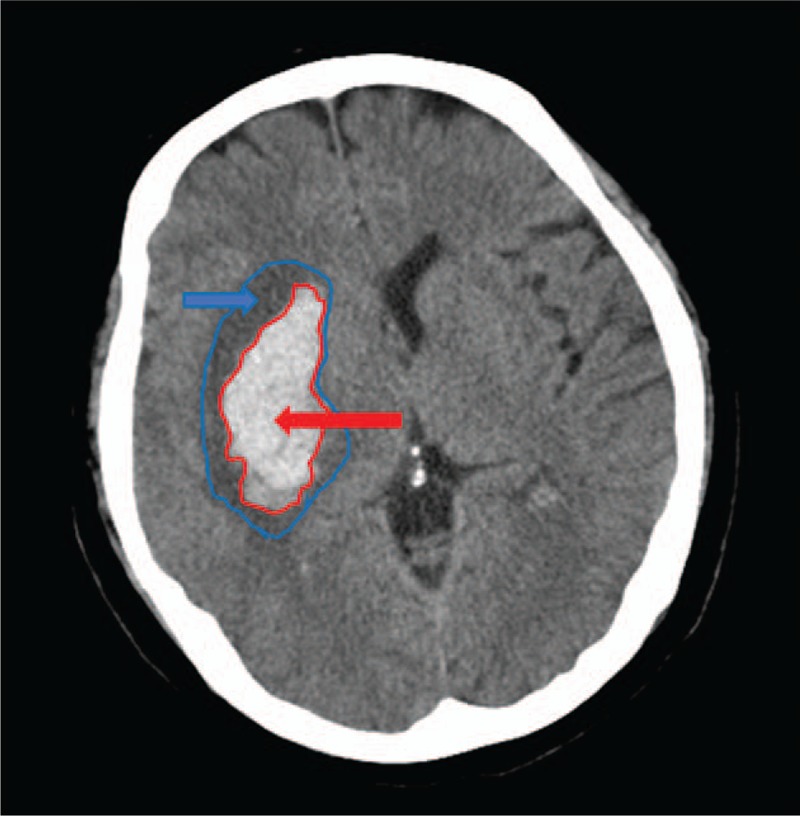
Boundaries of the hematoma and perihematomal edema using predefined radiological criteria: hyperdensity for hematoma regions (red arrow) and hypodensity in perihematomal distribution for perihematomal edema (blue arrow).
2.5. Duplex ultrasound
Color-coded duplex ultrasound was performed in all subjects with a 7-MHz linear transducer (iU22; Philips, Best, The Netherlands). Briefly, subjects were in a head-straight, flat supine position after a 10-minute quiet rest. The vascular ultrasound radiologist was particularly experienced with venous disease and had performed approximately 7000 ultrasound investigations per year over the past few years. Each subject underwent an examination of the laterocervical area of the neck, exploring both the IJVs and VVs. Longitudinal supine scans of the IJVs were obtained from the distal part (J3) above the carotid bifurcation to the subclavian junction (J1), passing through the intermediate portion at the level of the cricoid cartilage (J2). The longitudinal diameters were measured at the levels of J2. Measurements of the cross-sectional area (CSA, mm2) of the IJVs were obtained in real-time at the same point (J2) (Fig. 2). The VV diameters were obtained in the sagittal plane (Fig. 3) and the cross-sectional area was calculated assuming a circular shape. Time-averaged mean velocity (TAMV) (Fig. 4) was measured using the built-in software (iU22; Philips).[7] On the skin, we used a large amount of gel to assure good coupling of the transducer, reduce excessive pressure, and avoid changing the IJV shape and dimension.[16] Venous outflow volume of IJVs and VVs was calculated from the TAMV and the CSA of the vessel (venous outflow volume = CSA × TAMV). The total CVFV was then calculated by adding the IJVs volume and VVs volume.[8]
Figure 2.
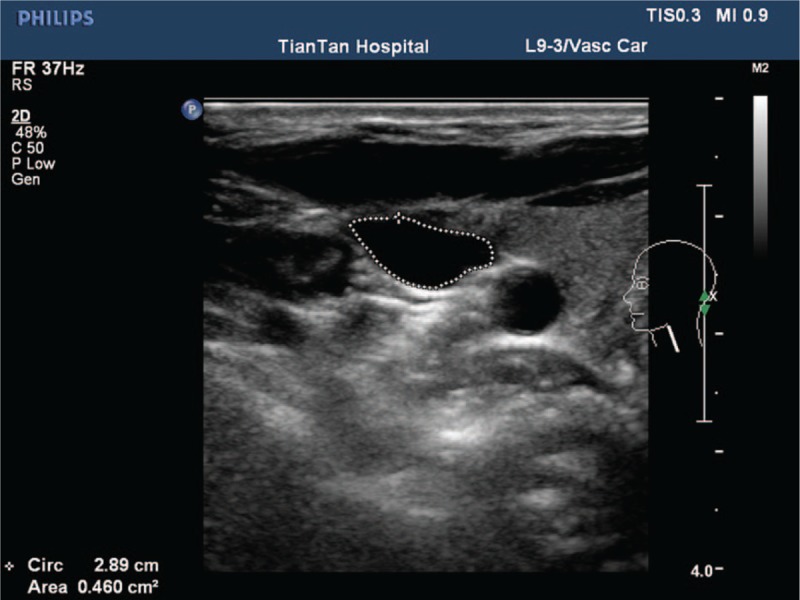
Calculation of the cross-sectional lumen area of the internal jugular vein.
Figure 3.
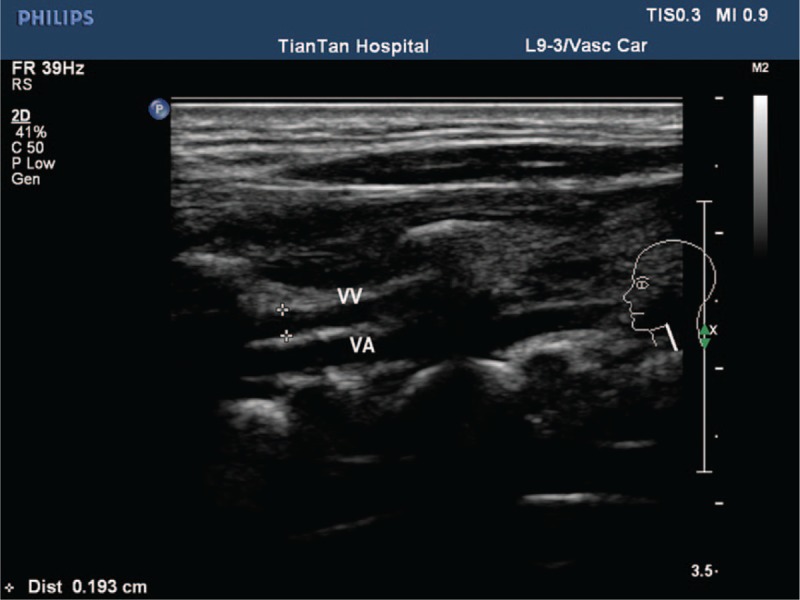
Calculation of the diameter of the VV. VA = vertebral artery, VV = vertebral vein.
Figure 4.
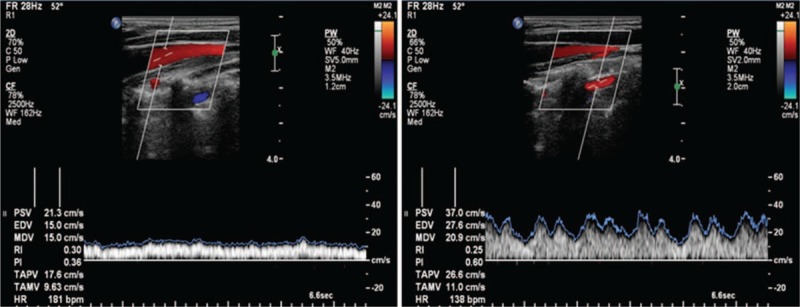
Calculation of the time-averaged mean velocity (TAMV) of the internal jugular vein (left) and vertebral vein (right).
The internal carotid arteries (ICAs) and vertebral arteries (VAs) were analyzed with the head rotated 20° to 30° to the opposite side and at least 2 cm distal of the carotid bifurcation. The intravascular flow volumes (FVs) of ICAs and VAs were calculated as the product of TAMV and the CSA of the circular vessel according to the formula FV = TAMV × CSA = TAMV × [(d/2)2 × π] (where “d” represents for diameter of the blood vessel). The arterial global cerebral blood flow (CBF) volume was determined as the sum of the FVs of the ICA and the VA of both sides.[17,18]
2.6. Statistical analysis
Continuous variables were presented as median (interquartile range) when they were not normally distributed and as mean ± standard deviation when they were normally distributed (according to the Kolmogorov-Smirnov normality test). Univariate analysis was applied to identify variables associated with PHE. The continuous variables were analyzed using the independent Student t test, whereas the categorical variables were analyzed using the chi-square test. The Mann-Whitney U test was used to analyze independent groups in case of non-normally distributed or heterogeneous variables. These covariates were then included in a multivariate binary logistic regression with the threshold of significance set at P < .10. Statistical analyses were performed using SPSS (version 24.0). All analyses were 2 tailed, and significance level was determined as P < .05.
3. Results
3.1. Patients
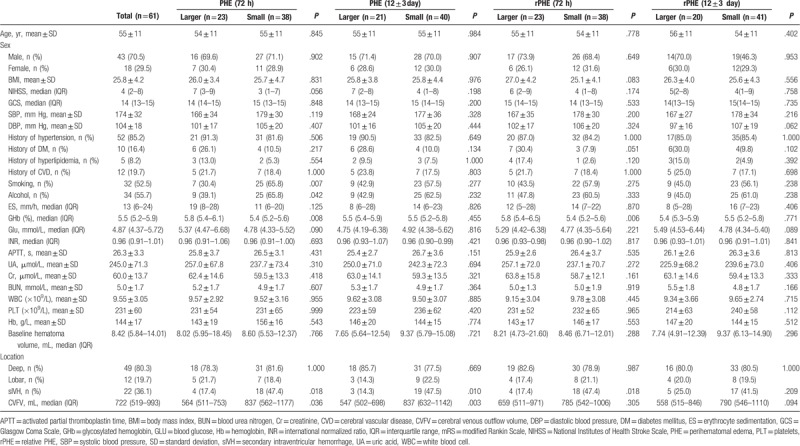
A total of 108 subjects with sICH were enrolled. Among them, 11 cases were excluded for secondary ICH, 25 for surgical treatment before the follow-up CT scan, 2 for incomplete Doppler ultrasound data, and 9 were discharged before the follow-up CT scan. Finally, 61 patients were included for analysis (Fig. 5). Age, sex, and BMI were comparable between groups at the 2 time points (Table 1). Significant differences were observed in smoking, alcohol consumption, GHb, secondary intraventricular hemorrhage (sIVH), and CVFV in PHE at 72 hours. Only sIVH and CVFV were significantly different at 12 days in PHE. In relative PHE (rPHE), GHb, and sIVH were significantly differed at 72 hours. No significant difference was observed at 12 days in rPHE (Table 1).
Figure 5.
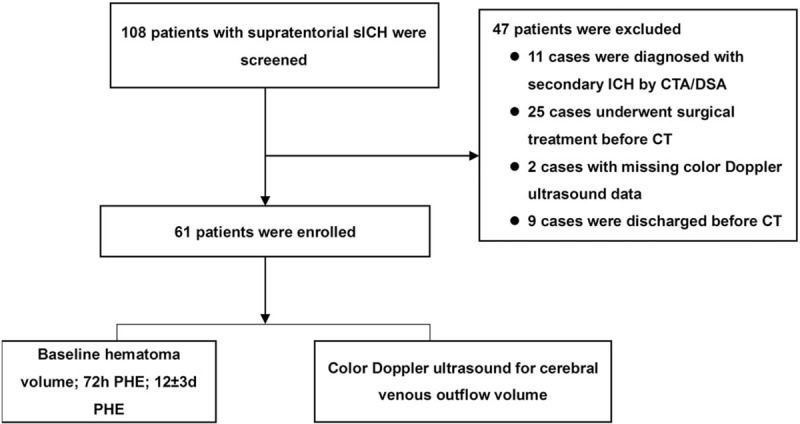
Study flowchart. CT = computed tomography, ICH = intracerebral hemorrhage, sICH = spontaneous intracerebral hemorrhage, PHE = perihematomal edema.
Table 1.
Baseline demographic and univariate analysis of patients with spontaneous intracerebral hemorrhage.
3.2. Multivariate analysis
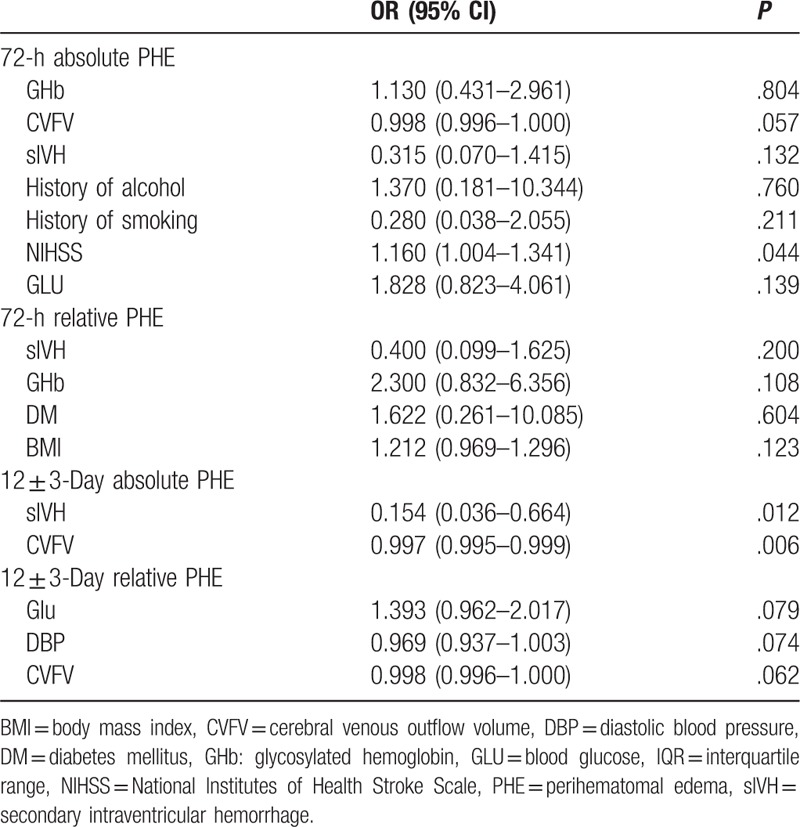
The results of univariate analyses of possible association between venous volume and PHE are shown in Table 1. Variables with P < .10 were entered into multivariate analyses. The results are shown in Table 2. The results indicated that CVFV was independently associated with late PHE (PHE at 12 ± 3 days) but not with early PHE (PHE at 72 hours) and rPHE.
Table 2.
Multivariate analysis of perihematomal edema of spontaneous intracerebral hemorrhage.
4. Discussion
In this prospective cohort study conducted at the Beijing Tiantan Hospital, we found that total CVFV may be an independent predictor of smaller absolute PHE, but we did not find possible association between relative PHE and total CVFV.
This is supported by the anatomical findings of several cerebral venous blood vessels draining blood from the superficial as well as the deep cerebral venous system into the confluent sinus and from there toward the lateral sinuses and the IJVs.[5,6,19] The reported mean total CVFVs of 4 previous studies were 656 ± 113,[20] 669 ± 240,[5,6] 740 ± 209,[21] and 700 ± 270 mL/min.[22] The present study showed a CVFV of 736.77 (539.69–992.71) mL/min, which was consistent with these previous results. The IJVs and VVs might be the principle outflow pathways for intracranial blood.
The mechanisms of PHE have been widely studied. According to previous studies, early stage clot retraction and cytotoxic edema promote the generation of ionic (osmotic) driving forces.[3] In later stage, inflammation is mainly responsible for PHE evolution.[3] Studies have confirmed that some factors are associated with PHE. Indeed, PHE volume is directly related to the initial ICH volume at all times after the ictus.[4] Blood pressure,[23] hyperglycemia,[24,25] body temperature,[26] plasma sodium levels,[27] and high hematocrit value on hospital admission following ICH[28] all contribute to the volume of PHE through the mechanisms mentioned above. According to Starling's principle, transendothelial fluid transfer depends on net hydrostatic and osmotic forces.[29] Therefore, it is easy to conclude that the factors that can increase the hydrostatic pressure may increase the volume of PHE. Abnormalities of intracranial venous drainage are bound to lead to increased intravascular hydrostatic pressure, which may lead to increased PHE. It has been reported that abnormal venous drainage is involved in the formation of malignant edema after ischemic stroke.[19] Furthermore, PHE may result from the same processes, which cause other types of secondary brain injury, and the volume of PHE may reflect the activity of pathological mediators that underlie these processes, including cytokines, complement proteins, and matrix metalloproteinases.[30–32] This overlap makes PHE a potential valuable marker of secondary injury that could provide a useful surrogate endpoint for experimental and clinical studies of novel therapeutic agents to prevent secondary injury after ICH.[3]
The amount of venous drainage should be proportional to the amount of arterial inflow. In the present study, there was no difference in arterial CBF between the 2 groups of PHE, meaning that the outflow of the 2 groups is relatively equal. Therefore, we hypothesized that when ICH occurred, the hematoma itself and PHE may cause oppression on the intracranial veins, leading to the redistribution of the intracranial venous drainage. The redistribution of the drainage may lead to larger amounts of cerebral blood passing through the bypass drainage via the confluence of sinus. Nevertheless, the confluence of sinus is absent in 10% to 40% of the patients,[22,33,34] and the venous collaterals are often small and tortuous, which might make compensatory capacity of the bypass less efficient so that larger PHE will accumulate.[7] Previous studies showed that elevated ICP resulting from stroke leads to alteration of flow velocities within basal veins, vein of Galen, straight sinus, and transversal sinus, supporting our hypothesis that redistribution of intracranial venous drainage occurs after ICH.[9,35]
This study had some limitations. First the number of patients was small. Secondly, the patients had a relatively small amount of hematoma volume. Thirdly, this was a cross-sectional study and no follow-up was conducted to examine the prognosis of the patients. Finally, doubts have been raised about the use of color Doppler ultrasound to determine CVFV,[36,37] but no study directly compared this method against more robust blood flow measurement methods in the context of PHE. Nevertheless, ultrasound is an inexpensive and easily accessible technique, and a number of studies reached valuable conclusions based on this technique.[5,6,20–22] Additional studies are still necessary to examine the factors contributing to PHE in ICH, as well as the prognosis of the patients.
5. Conclusion
This study suggests a potential association between CVFV and PHE, although the exact mechanism still needs further study. Nevertheless, the results suggest that CVFV may participate in the process of the formation of PHE after sICH. This study might provide a novel direction for the treatment of PHE in the future.
Author contributions
Conceptualization: Hao Feng, Wen He, Xingquan Zhao.
Data curation: Hao Feng, Zhanqiang Jin, Wen He, Xingquan Zhao.
Formal analysis: Hao Feng, Zhanqiang Jin, Wen He, Xingquan Zhao.
Funding acquisition: Xingquan Zhao.
Investigation: Hao Feng, Zhanqiang Jin, Wen He, Xingquan Zhao.
Methodology: Hao Feng, Zhanqiang Jin, Wen He, Xingquan Zhao.
Project administration: Xingquan Zhao.
Resources: Hao Feng, Xingquan Zhao.
Software: Hao Feng, Xingquan Zhao.
Supervision: Hao Feng, Zhanqiang Jin, Xingquan Zhao.
Validation: Hao Feng, Zhanqiang Jin, Wen He, Xingquan Zhao.
Visualization: Hao Feng, Xingquan Zhao.
Writing – original draft: Hao Feng, Xingquan Zhao.
Writing – review and editing: Hao Feng, Zhanqiang Jin, Wen He, Xingquan Zhao.
Footnotes
Abbreviations: BMI = body mass index, CBF = cerebral blood flow, CT = computed tomography, CVFV = cerebral venous outflow volume, FV = flow volume, GCS = Glasgow Coma Scale, GHb = glycosylated hemoglobin, Hb = hemoglobin, HU = Hounsfield unit, ICA = internal carotid artery, ICH = intracerebral hemorrhage, ICP = intracranial pressure, IJV = internal jugular vein, PHE = perihematomal edema, rPHE = relative PHE, sICH = spontaneous intracerebral hemorrhage, sIVH = secondary intraventricular hemorrhage, TAMV = time-averaged mean velocity, VA = vertebral artery, VV = vertebral vein.
This study was supported by Beijing Municipal Science and Technology Commission (Z161100002616008).
The authors declare that they have no conflict of interest.
References
- [1].Xi G, Keep RF, Hoff JT. Mechanisms of brain injury after intracerebral haemorrhage. Lancet Neurol 2006;5:53–63. [DOI] [PubMed] [Google Scholar]
- [2].Gupta M, Verma R, Parihar A, et al. Perihematomal edema as predictor of outcome in spontaneous intracerebral hemorrhage. J Neurosci Rural Pract 2014;5:48–54. [DOI] [PMC free article] [PubMed] [Google Scholar]
- [3].Urday S, Kimberly WT, Beslow LA, et al. Targeting secondary injury in intracerebral haemorrhage—perihaematomal oedema. Nat Rev Neurol 2015;11:111–22. [DOI] [PubMed] [Google Scholar]
- [4].Arima H, Wang JG, Huang Y, et al. Significance of perihematomal edema in acute intracerebral hemorrhage: the INTERACT trial. Neurology 2009;73:1963–8. [DOI] [PMC free article] [PubMed] [Google Scholar]
- [5].Doepp F, Schreiber SJ, Von Munster T, et al. How does the blood leave the brain? A systematic ultrasound analysis of cerebral venous drainage patterns. Neuroradiology 2004;46:565–70. [DOI] [PubMed] [Google Scholar]
- [6].Zamboni P, Sisini F, Menegatti E, et al. An ultrasound model to calculate the brain blood outflow through collateral vessels: a pilot study. BMC Neurol 2013;13:81. [DOI] [PMC free article] [PubMed] [Google Scholar]
- [7].Chung CP, Lin YJ, Chao AC, et al. Jugular venous hemodynamic changes with aging. Ultrasound Med Biol 2010;36:1776–82. [DOI] [PubMed] [Google Scholar]
- [8].Monti L, Menci E, Ulivelli M, et al. Quantitative ColourDopplerSonography evaluation of cerebral venous outflow: a comparative study between patients with multiple sclerosis and controls. PLoS One 2011;6:e25012. [DOI] [PMC free article] [PubMed] [Google Scholar]
- [9].Stolz E, Gerriets T, Babacan SS, et al. Intracranial venous hemodynamics in patients with midline dislocation due to postischemic brain edema. Stroke 2002;33:479–85. [DOI] [PubMed] [Google Scholar]
- [10].Rossitti S. Pathophysiology of increased cerebrospinal fluid pressure associated to brain arteriovenous malformations: the hydraulic hypothesis. Surg Neurol Int 2013;4:42. [DOI] [PMC free article] [PubMed] [Google Scholar]
- [11].Hao Feng HZ, Wen He, Jian Zhou, et al. Jugular venous reflux is associated with perihematomal edema after intracerebral hemorrhage. Biomed Res Int 2017;2017:7514639. [DOI] [PMC free article] [PubMed] [Google Scholar]
- [12].Appelros P, Terent A. Characteristics of the National Institute of Health Stroke Scale: results from a population-based stroke cohort at baseline and after one year. Cerebrovasc Dis 2004;17:21–7. [DOI] [PubMed] [Google Scholar]
- [13].Fischer M, Ruegg S, Czaplinski A, et al. Inter-rater reliability of the Full Outline of UnResponsiveness score and the Glasgow Coma Scale in critically ill patients: a prospective observational study. Crit Care 2010;14:R64. [DOI] [PMC free article] [PubMed] [Google Scholar]
- [14].Zhu Y, Wang JL, He ZY, et al. Association of altered serum MicroRNAs with perihematomal edema after acute intracerebral hemorrhage. PLoS One 2015;10:e0133783. [DOI] [PMC free article] [PubMed] [Google Scholar]
- [15].Sun W, Pan W, Kranz PG, et al. Predictors of late neurological deterioration after spontaneous intracerebral hemorrhage. Neurocrit Care 2013;19:299–305. [DOI] [PMC free article] [PubMed] [Google Scholar]
- [16].Farina M, Novelli E, Pagani R. Cross-sectional area variations of internal jugular veins during supine head rotation in multiple sclerosis patients with chronic cerebrospinal venous insufficiency: a prospective diagnostic controlled study with duplex ultrasound investigation. BMC Neurol 2013;13:162. [DOI] [PMC free article] [PubMed] [Google Scholar]
- [17].Schoning M, Walter J, Scheel P. Estimation of cerebral blood flow through color duplex sonography of the carotid and vertebral arteries in healthy adults. Stroke 1994;25:17–22. [DOI] [PubMed] [Google Scholar]
- [18].Scheel P, Ruge C, Petruch UR, et al. Color duplex measurement of cerebral blood flow volume in healthy adults. Stroke 2000;31:147–50. [DOI] [PubMed] [Google Scholar]
- [19].Yu W, Rives J, Welch B, et al. Hypoplasia or occlusion of the ipsilateral cranial venous drainage is associated with early fatal edema of middle cerebral artery infarction. Stroke 2009;40:3736–9. [DOI] [PubMed] [Google Scholar]
- [20].Muller HR. Quantitative determination of blood flow in the internal jugular vein using ultrasound [in German]. Ultraschall Med 1985;6:51–4. [DOI] [PubMed] [Google Scholar]
- [21].Muller HR, Hinn G, Buser MW. Internal jugular venous flow measurement by means of a duplex scanner. J Ultrasound Med 1990;9:261–5. [DOI] [PubMed] [Google Scholar]
- [22].Valdueza JM, Von Munster T, Hoffman O, et al. Postural dependency of the cerebral venous outflow. Lancet 2000;355:200–1. [DOI] [PubMed] [Google Scholar]
- [23].Sykora M, Diedler J, Turcani P, et al. Subacute perihematomal edema in intracerebral hemorrhage is associated with impaired blood pressure regulation. J Neurol Sci 2009;284:108–12. [DOI] [PubMed] [Google Scholar]
- [24].Qureshi AI, Palesch YY, Martin R, et al. Association of serum glucose concentrations during acute hospitalization with hematoma expansion, perihematomal edema, and three month outcome among patients with intracerebral hemorrhage. Neurocrit Care 2011;15:428–35. [DOI] [PubMed] [Google Scholar]
- [25].Song EC, Chu K, Jeong SW, et al. Hyperglycemia exacerbates brain edema and perihematomal cell death after intracerebral hemorrhage. Stroke 2003;34:2215–20. [DOI] [PubMed] [Google Scholar]
- [26].Staykov D, Wagner I, Volbers B, et al. Mild prolonged hypothermia for large intracerebral hemorrhage. Neurocrit Care 2013;18:178–83. [DOI] [PubMed] [Google Scholar]
- [27].Wagner I, Hauer EM, Staykov D, et al. Effects of continuous hypertonic saline infusion on perihemorrhagic edema evolution. Stroke 2011;42:1540–5. [DOI] [PubMed] [Google Scholar]
- [28].Venkatasubramanian C, Mlynash M, Finley-Caulfield A, et al. Natural history of perihematomal edema after intracerebral hemorrhage measured by serial magnetic resonance imaging. Stroke 2011;42:73–80. [DOI] [PMC free article] [PubMed] [Google Scholar]
- [29].Xi G, Keep RF, Hoff JT. Pathophysiology of brain edema formation. Neurosurg Clin N Am 2002;13:371–83. [DOI] [PubMed] [Google Scholar]
- [30].Lim-Hing K, Rincon F. Secondary hematoma expansion and perihemorrhagic edema after intracerebral hemorrhage: from bench work to practical aspects. Front Neurol 2017;8:74. [DOI] [PMC free article] [PubMed] [Google Scholar]
- [31].Ducruet AF, Zacharia BE, Hickman ZL, et al. The complement cascade as a therapeutic target in intracerebral hemorrhage. Exp Neurol 2009;219:398–403. [DOI] [PMC free article] [PubMed] [Google Scholar]
- [32].Castellazzi M, Tamborino C, De Santis G, et al. Timing of serum active MMP-9 and MMP-2 levels in acute and subacute phases after spontaneous intracerebral hemorrhage. Acta Neurochir Suppl 2010;106:137–40. [DOI] [PubMed] [Google Scholar]
- [33].Bisaria KK. Anatomic variations of venous sinuses in the region of the torcular Herophili. J Neurosurg 1985;62:90–5. [DOI] [PubMed] [Google Scholar]
- [34].Hempel KJ, Elmohamed A. Anatomy, form variations and types of the intracranial venous system in man [in German]. Radiologe 1971;11:451–7. [PubMed] [Google Scholar]
- [35].Niesen WD, Rosenkranz M, Schummer W, et al. Cerebral venous flow velocity predicts poor outcome in subarachnoid hemorrhage. Stroke 2004;35:1873–8. [DOI] [PubMed] [Google Scholar]
- [36].Purkayastha S, Sorond F. Transcranial Doppler ultrasound: technique and application. Semin Neurol 2012;32:411–20. [DOI] [PMC free article] [PubMed] [Google Scholar]
- [37].Zamboni P. Why current Doppler ultrasound methodology is inaccurate in assessing cerebral venous return: the alternative of the ultrasonic jugular venous pulse. Behav Neurol 2016;2016:7082856. [DOI] [PMC free article] [PubMed] [Google Scholar]


