Abstract
This study aimed to determine the role of plasma miR-17–92 cluster level in predicting chemoresistance in patients with gastric cancer (GC) undergoing oxaliplatin/capecitabine (XELOX) chemotherapy.
Patients recently diagnosed with advanced GC were chosen as participants based on the inclusion criteria. The plasma levels of miR-17-5p, miR-18a, miR-19a/b, miR-20a, and miR-92-1 (miR-17–92 cluster) were determined through quantitative RT-PCR of blood samples from GC patients and healthy volunteers. All the patients received XELOX chemotherapy, and the effectiveness of the chemotherapy was evaluated.
The miR-17–92 plasma level was increased in advanced GC patients and decreased after XELOX chemotherapy. Moreover, the miR-17–92 cluster level was associated with chemotherapy response but not with chemotherapy-related toxicity. The miR-17–92 cluster plasma level was decreased in chemosensitive patients, but not in chemoresistant patients, after chemotherapy. The sensitivity and specificity of the combined detection of the miR-17–92 cluster in patients with advanced GC were 100% each.
The results suggest that the miR-17–92 plasma level is associated with the progression of advanced GC and effectiveness of XELOX chemotherapy.
Keywords: chemotherapy, gastric cancer, miR-17–92 cluster, oxaliplatin/capecitabine
1. Introduction
Gastric cancer (GC; also referred to as stomach cancer) is a public health problem and is a leading cause of cancer-related deaths on a global scale.[1] Although GC develops in stages over years, it often progresses to an advanced stage in most patients before its initial diagnosis; moreover, the prognosis of GC is often poor.[2]
Systemic chemotherapy is the main therapeutic approach used for treating patients with advanced GC.[3] Drug resistance is a persistent problem that limits the continued success of cancer chemotherapy, delays the administration of effective salvage treatment, and decreases survival rates in patients with GC.[4] Therefore, it is urgent to identify sensitive and objective biomarkers to determine the efficacy of chemotherapy and to change chemotherapy regimens for improving clinical outcomes.
Abnormal microRNA (miRNA) expression is found closely linked to cancer pathogenesis and progression.[5] miRNAs have been used as biomarkers to assess the invasion, metastasis, prognosis, and drug resistance of different cancers.[6] Multiple miRNAs exhibit high sensitivity and specificity for predicting response to chemotherapy.[7] For example, overexpressed miRNAs, including let-7g, miR-1, and miR-34, are associated with chemosensitivity in patients with GC who are treated with cisplatin/fluorouracil.[8] Wu et al[9] reported that multiple miRNAs, including miR-196a and miR-7, are associated with the chemosensitivity of human GC cells to hydroxycamptothec. However, the expression levels of some miRNAs are not stable and consistent in GC possibly because of high genetic heterogeneity in GC patients. The miR-17–92 cluster has been found to be associated with human cancers, including GC,[10] and is a promising marker of drug resistance in hepatocellular carcinoma.[11] Moreover, it may be a candidate predictor for the diagnosis of GC,[10] suggesting its role as a novel biomarker for determining chemotherapy efficacy and disease progression in patients with GC.
Oxaliplatin/capecitabine (XELOX) chemotherapy, which is an efficient, convenient, and less toxic chemotherapeutic regimen, is well accepted as a 1st-line therapy in patients with GC.[12] However, it is very challenging to identify multiple serum miRNAs for predicting response to XELOX chemotherapy in advanced GC patients. An initial study analyzed the relation between the miR-17–92 plasma level and chemosensitivity to XELOX chemotherapy in Qinghai area, which shows high prevalence of GC in China.[13]
2. Materials and methods
2.1. Subjects
Patients who were recently diagnosed with advanced GC between July 1, 2015 and September 30, 2016, at the Affiliated Hospital of Qinghai University were included in this prospective clinical trial. The stage of GC in each patient was determined using the 2010 AJCC TNM Staging System (7th edition). Peripheral blood samples were collected simultaneously from healthy volunteers (control group). This study was approved by the local ethics committee, and the informed consents were signed by all participants or their family.
Patients met the following inclusion criteria were enrolled in the study: presence of at least one measurable lesion, ≥20-mm in diameter on chest radiography, computed tomography, or magnetic resonance imaging, or ≥ 10-mm on spiral computed tomography; a good physical condition and an Eastern Cooperative Oncology Group score of ≤2 points; expected survival of >3 months; normal peripheral hemography and electrocardiography results, and without heart, liver, kidney, and other vital organ abnormalities; and voluntary participation, showing good compliance in all tests, and signed a written informed consent form. The following patients were excluded from the study: pregnant, lactating women or fertile women who did not use contraception; patients with serious and uncontrolled infections, suppurative and chronic infections, or delayed wound healing; patients who previously affected by severe heart diseases, including congestive heart failure, uncontrollable high-risk arrhythmias, unstable angina, myocardial infarction, severe valvular heart disease, and refractory hypertension; and patients with difficult-to-control nervous and/or mental illness, uncontrolled primary brain tumor or CNS metastasis, or intracranial hypertension or neuropsychiatric symptoms and patients who did not comply or cooperate during different tests. The following patients were rejected from inclusion in the study: patients showing serious signs of toxicity or intolerance to the study treatment that were recorded as adverse reactions, and patients who withdrew from the study voluntarily or because of a medical necessity after the advice of the study researchers.
2.2. miRNA detection
PubMed and GeneGlobe databases were searched to determine experimentally validated and GC-associated miRNAs of the miR-17–92 cluster. Venous blood samples were collected from patients with GC before and after the chemotherapy (5 mL each) and were centrifuged. The obtained plasma samples were stored at −80 °C. miRNAs were extracted by miRcute miRNA isolation kit (Tiangen, Beijing, China) and were purified using High Pure RNA Isolation kit (Roche, Basel, Switzerland).
The extracted miRNAs were reverse transcribed using miScript reverse transcription (RT) (QIAGEN, Hilden, Germany). The miR-17–92 cluster level was detected using miScript SYBR Green PCR Kit (QIAGEN). U6 snRNA gene was used as an internal reference gene for PCR amplification. Primers used for amplifying the miR-17–92 cluster are listed in Table 1. PCR was performed using the cycling conditions of pre-denaturation for 3 minutes at 94 °C and amplified for 40 cycles consisting of denaturation for 20 seconds at 94 °C, annealing for 40 seconds at 62 °C, and extension for 15 seconds at 95 °C. Melting curves were obtained by 1 minute at 60 °C, 15 seconds at 95 °C, and 15 minutes at 60 °C.
Table 1.
Primers used for amplifying the miR-17–92 cluster.

2.3. Relative quantification and analysis of miRNA gene expression
After the completion of PCR, fluorescence signals were analyzed automatically using ABI 7300 SDS software (Foster City, CA) and converted to a cycle threshold (Ct) value. Relative miRNA expression values for each sample were normalized to that obtained for the U6 snRNA gene and were calculated using the following formula: relative miRNA expression = 2−ΔΔCt, where ΔCt value = miRNA Ct value − U6 Ct value.[14]
2.4. Chemotherapy
All the patients received XELOX chemotherapy (2 hour-intravenous injections of 130 mg/m2 L-OHP was administered on day 1 and oral 1250 mg/m2 Xeloda twice a day from day 1 to days 14). The treatment cycle was repeated every 21 days. After two cycles, effects of the treatment were evaluated in each patient. Responding patients received 6 cycles of the chemotherapy. Patients who did respond after 2 cycles of the chemotherapy were discontinued from the treatment, and they were followed up until disease progression, after which they were administered other therapeutic options.
2.5. Evaluation of treatment effectiveness
Therapeutic efficiency was determined using Response Evaluation Criteria in Solid Tumors criteria[15] and classified into complete response (CR), partial response (PR), no change/stable disease (SD), and progressive disease (PD). Valid (chemosensitive) and invalid (chemoresistant) responses were defined as CR + PR and SD + PD, respectively.
Follow-up was initiated after the discontinuation of the treatment, and it was repeated every 2 months by providing reminders through telephone calls or through repeated visits to the clinic until patient death.
2.6. Statistical analysis
The count data were analyzed using chi-square test and Fisher exact probability test. Paired rank sum test of independent samples was used to identify differences of the miRNA cluster level before and after chemotherapy. Kaplan–Meier method was applied to analyze survival curves of each factor (log-rank test). Stepwise logistic regression analysis with application of binary logistic regression models was performed to generate a new variable predictor. The new variable predictor was used as a test variable, and chemotherapy response was used as a state variable. ROC curve analysis was performed to calculate area under the curve (AUC). All statistical analyses were performed using SPSS 17.0 with P < .05 as statistically significant.
3. Results
3.1. General characteristics of the study subjects
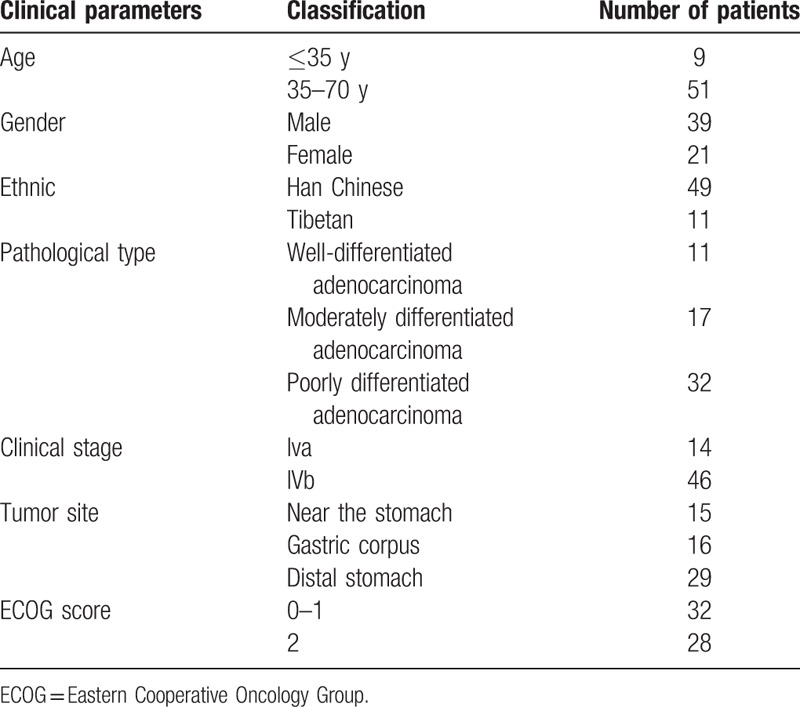
This study included 60 patients (39 men and 21 women; age range, 21–70 years [median age, 56 years]; 9 patients with an age of ≤35 years), 11 of whom were Tibetan. Of the 60 patients, 14 patients had stage IVa GC and 46 patients had stage IVb GC. Pathological analysis showed that tumors of all patients were adenocarcinomas, with 11 patients having well-differentiated adenocarcinomas, 17 patients having moderately differentiated adenocarcinomas, and 32 patients having poorly differentiated adenocarcinomas (Table 2). There were also 20 healthy volunteers (9 men and 11 women; age range, 26–70 years [median age, 56 years]; subjects with an age of ≤35 years, 3).
Table 2.
Clinical characteristics of patients included in this study.
3.2. Chemotherapy response in patients with GC
A total of 34 patients were chemosensitive (56%) and 26 patients were chemoresistant to XELOX chemotherapy. Among 11 Tibetan patients, 5 patients were chemosensitive (45.5%) and 6 patients were chemoresistant. Except for Tibetan patients, in the remaining 49 patients, the total response rate including CP and PR was 59.2% (29/49), which was not statistically significant (X2 = 0.69, P = .406).
3.3. The miR-17–92 plasma level was increased in patients with advanced GC
To investigate the plasma level of miR-17–92 cluster in patients with advanced GC, we performed RT-PCR to detect level of them in patients with GC, and healthy subjects. All the plasma level of miR-17–92 cluster was significantly higher in patients with GC than in controls (P < .01 for all; Fig. 1A).
Figure 1.
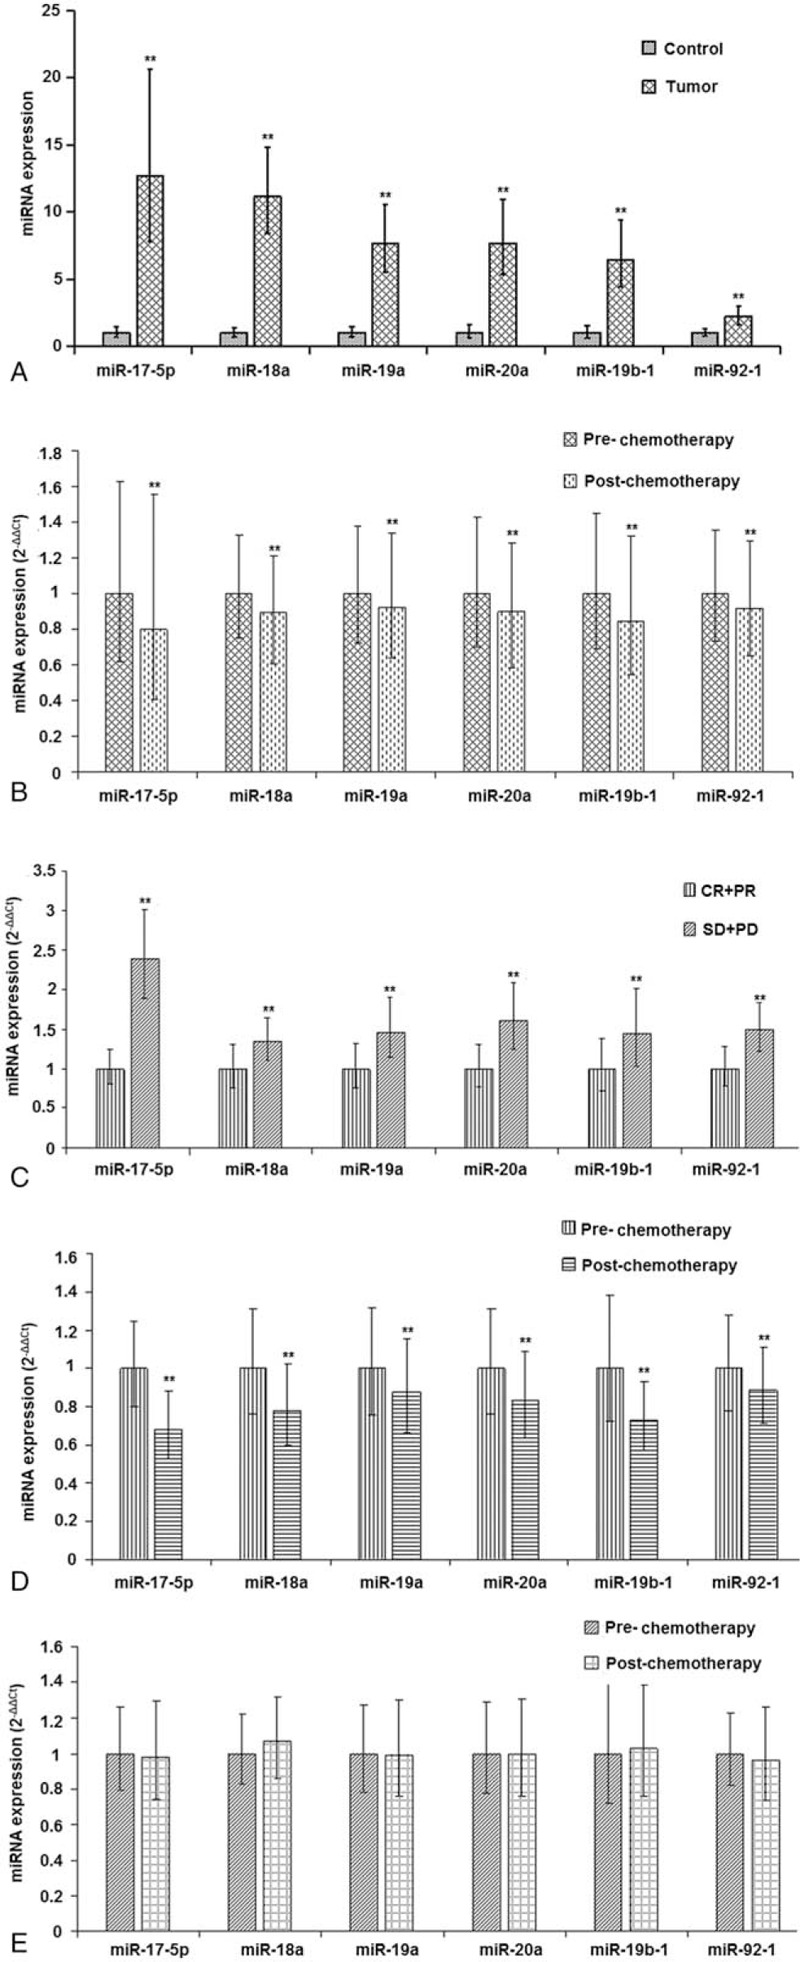
Plasma expression level of miR-17-5p, miR-18a, miR-19a, miR-20a, miR-19b-1, and miR-92-1 in subjects of the different groups.
3.4. Plasma level of miR-17–92 was decreased after chemotherapy
To investigate changes in the plasma level of miR-17–92 cluster in advanced GC patients before and after chemotherapy, we determined the plasma expression level of them through RT-PCR. Plasma expression level of miR-17–92 was lower after chemotherapy compared to that before chemotherapy (P < .01 for all; Fig. 1B).
3.5. Plasma level of miR-17–92 was higher in chemoresistant patients than that in chemosensitive patients before chemotherapy
To investigate differences of miR-17–92 level in patients with advanced GC showing different responses before chemotherapy, we determined the expression level of them in patients before chemotherapy. The miR-17–92 level was higher in chemoresistant patients than that in chemosensitive patients (P < .01 for all; Fig. 1C).
3.6. Plasma level of miR-17–92 was decreased in chemosensitive patients and did not change in chemoresistant patients after chemotherapy
To investigate changes in the plasma level of miR-17–92 in chemosensitive and chemoresistant patients before and after chemotherapy, we determined the expression level of them. The levels of the miRNAs were decreased in chemosensitive patients (P < .01 for all; Fig. 1D). However, no significant difference was found in the miRNAs level in chemoresistant patients between before and after chemotherapy (P > .01 for all; Fig. 1E).
3.7. Median time to progression for patients with GC
Median follow-up duration for patients with GC was 7 months. In November 2016, 32 of 60 patients, including 13 chemosensitive patients and 19 chemoresistant patients, showed disease progression (Fig. 2). Median time to progression for these patients was 5.40 months. Among 28 patients who did not show disease progression, the median follow-up duration was 5 months for chemosensitive patients and 3 months for chemoresistant patients.
Figure 2.
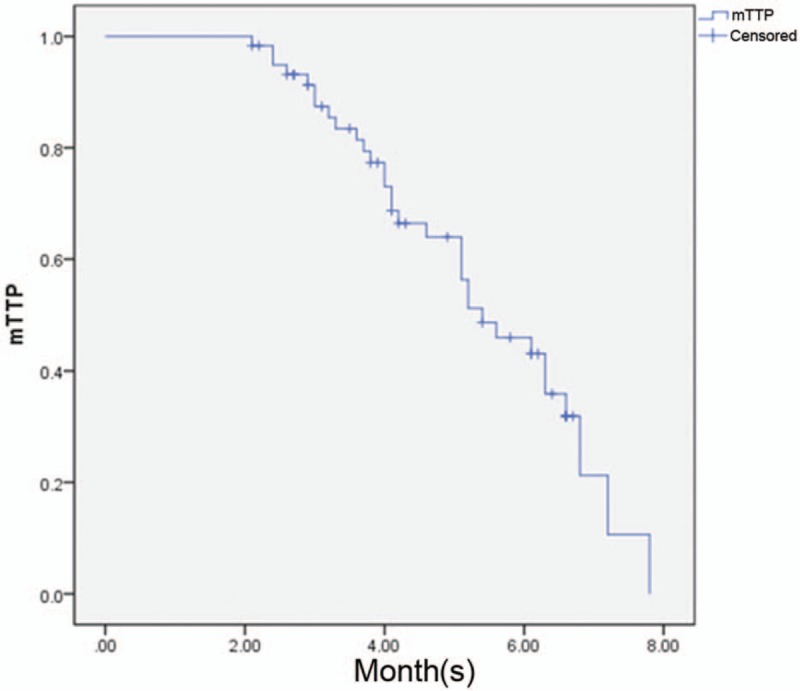
The median time to progression of patients after an 8-month follow-up period.
3.8. The miR17–92 level may be associated with GC progression
To determine the plasma level of miR-17–92 in 32 patients showing disease progression, we determined the plasma level of them before and after chemotherapy, and before and after disease progression. In chemosensitive patients showing disease progression, all miRNAs levels were higher than those before chemotherapy (P < .001, P = .001, P < .001, P < .001, P = .001, and P = .007, respectively) and those after chemotherapy (all P < .001) (Fig. 3). Moreover, in chemoresistant patients showing disease progression, relative expression levels of these miRNAs were also higher than that before chemotherapy (P < .001 for all) and that after chemotherapy (P < .001 for all).
Figure 3.
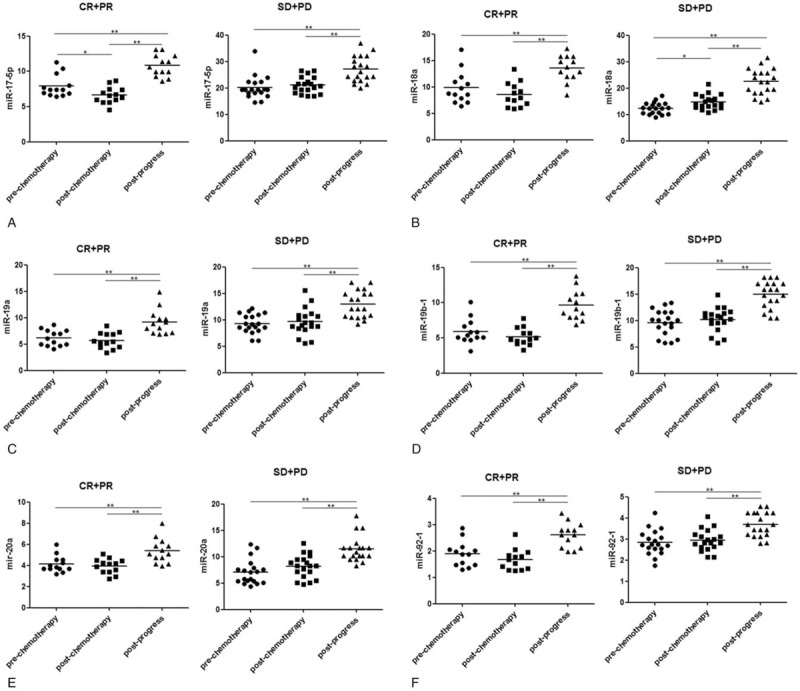
Plasma expression level of the miR-17–92 cluster in 32 patients with gastric cancer before and after chemotherapy and before and after disease progression. CR = complete remission, PD = progressive disease, PR = partial remission, SD = stable disease (no change).
3.9. Plasma levels of the miR17–92 cluster may not be associated with the risk of chemotherapy-related toxicity in patients with GC
The main adverse reactions in 60 patients were hematological toxicity, including leucopenia (4 patients), decreased hemoglobin level (3 patients), and thrombocytopenia; neurotoxicity (7 patients); and allergic reaction (4 patients). No difference was observed in the relative plasma expression level of the miR-17–92 cluster between patients with grade 3 to 4 chemotherapy-related toxicity and those without chemotherapy-related toxicity before chemotherapy (P > .05).
3.10. Combined value of 6 miRNAs for predicting disease progression in patients with advanced GC
The AUC for combined detection by using the 6 miRNAs of miR-17–92 cluster was higher than that for each miRNA alone (Fig. 4A). Overall, the sensitivity and specificity of the combined detection for predicting disease progression in patients with GC were superior to those with each miRNA alone.
Figure 4.
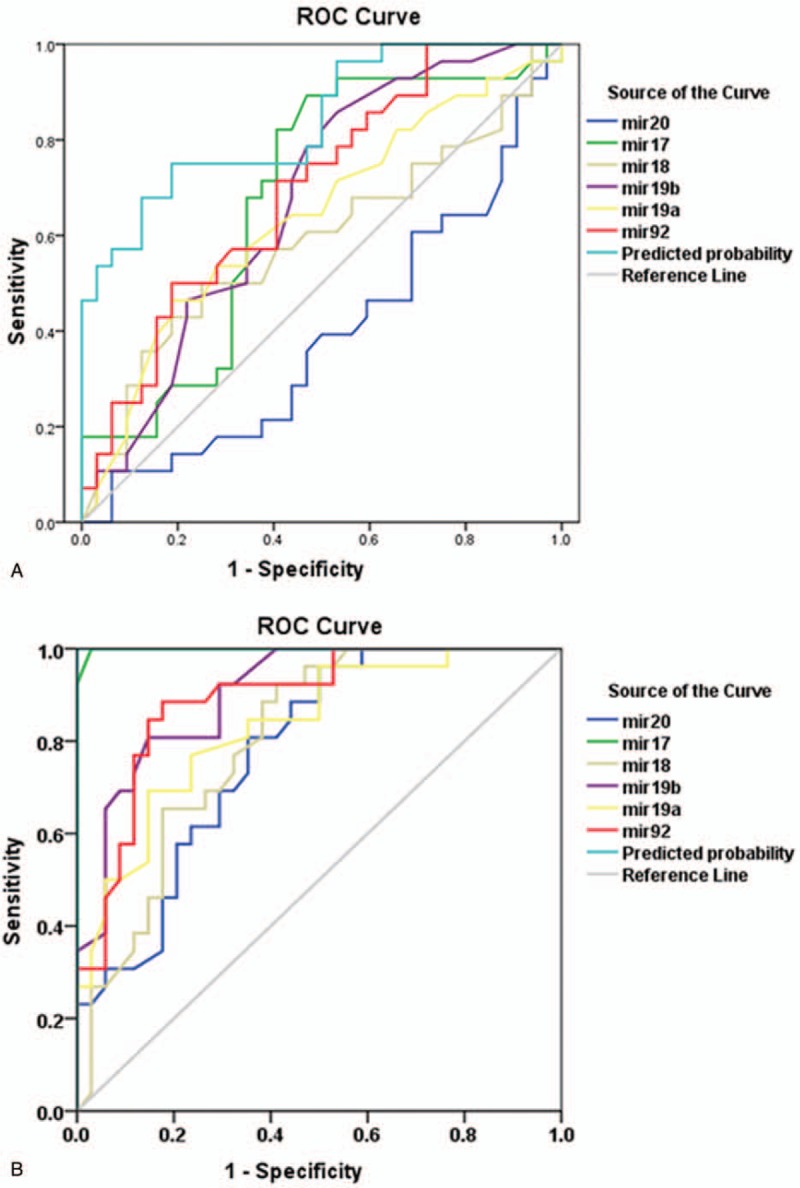
The combined value of miR-20a, miR-17-5p, miR-18a, miR-19b-1, miR-19a, and miR-92-1 for predicting disease progression (A) and chemotherapy efficiency (B) in patients with advanced gastric cancer.
3.11. Combined value of 6 miRNAs for predicting chemotherapy efficiency in patients with advanced GC
The AUC of 6 miRNAs was 0.780, 0.998, 0.804, 0.903, 0.833, and 0.889, respectively (Fig. 4B). The AUC of miR-17-5p was closer to 1, and the sensitivity and specificity of miR-17-5p were 97.1% and 100%, respectively, which were higher than those of other miRNAs. Moreover, the sensitivity and specificity of the combined detection of the 6 miRNAs were 100% each in patients with advanced GC.
4. Discussion
The plasma level of the miR-17–92 cluster was increased in advanced GC patients and deceased after XELOX chemotherapy. In addition, the miR-17–92 plasma level was suggested to be associated with the curative effect of chemotherapy. High plasma level of miR-17–92 before chemotherapy was related to poor response to chemotherapy compared with low plasma expression. As expected, the miR-17–92 level decreased in chemosensitive patients but not in chemoresistant patients after chemotherapy. Moreover, the plasma miR-17–92 level was suggested to be associated with disease progression but not with chemotherapy-related toxicity. Therefore, the combined value of miR-17–92 cluster for predicting disease progression and chemotherapy efficiency in patients with advanced GC was investigated.
The oncogene miR-17–92 cluster is important for the pathogenesis of cancers. miR-17, miR-20a/b, miR-18a, and miR-19a are highly expressed in GC cells.[16] Moreover, miR-92a regulates the self-renewal and proliferation of GC stem cells, highlighting its value as an independent prognostic factor in GC.[17] The negative feedback coupling between miR-17–92 and E2F-/Myc-positive feedback loops regulates uncontrolled cell proliferation in cancers.[18] The miR-17–92 cluster impairs TGF-β signaling response, and increases cell proliferation and promotes cell viability by activating the BRAF oncogene in thyroid follicular cells.[19] Moreover, VEGF-induced expression of the miR-17–92 cluster regulates angiogenesis to promote tumor development.[20] Repression of the miR-17–92 cluster by transcription factor C/EBPβ is negatively correlated with PHLPP2 levels in differentiating acute myeloid leukemia cells.[21] Therefore, expression level of the miR-17–92 cluster may predict GC progression.
The results of this study suggested that the miR-17–92 level was associated with the efficiency of XELOX chemotherapy. The tumor suppressor gene PTEN, which is directly regulated by miR-17-5p, plays an important role along with growth factor receptor α, in inducing chemoresistance in pancreatic cancer.[22] Wu et al[17] reported that miRNAs including miR-19b and miR-92a maintained the stemness of GC stem cells by inducing chemoresistance. One study examined the potential of miR-17–92 in overcoming chemoresistance in cancer stem cells.[23] Zhou et al[24] suggested that overexpressed miR-17–92 induced cisplatin resistance in prostate cancer cells by ERK1/2 phosphorylation. Awan et al[11] reported that miR-17–92 cluster-targeted therapy could enhance the anticancer efficiency of sorafenib. Therefore, we calculated the sensitivity and specificity of the miR-17–92 cluster for predicting chemotherapy efficiency in patients with advanced GC. We found that although the accuracy of miR-17-5p was higher than that of miR-20a, miR-18a, miR-19b-1, miR-19a, or miR-92-1 alone, the combined detection of them could further improve the predictive sensitivity and specificity for detecting chemotherapy response in patients with advanced GC.
There are several limitations in our study. The sample size is relatively small. Additionally, it was not randomized in any manner nor was it multicenter. Therefore, additional studies involving a large sample size are required to determine whether the miR-17–92 cluster is a clinically significant target for improving the chemotherapy response and preventing cancer progression, and whether it is a prognostic marker of advanced GC.
In conclusion, this study indicates that the plasma miR-17–92 level is associated with the progression of advanced GC and effectiveness of XELOX chemotherapy, suggesting the drug resistant potential of miR-17–92. The suppression on miR-17–92 expression may improve chemotherapy efficacy and survival outcomes in patients with advanced GC.
Acknowledgments
The authors thank National Natural Science Foundation of China (project No. 81760730) and Scientific Research Project Funds of Qinghai Department (project No. 2016-ZJ-785) for the support.
Author contributions
Conceptualization: Baohua Fan, Cunfang Shen, Yushuang Luo.
Data curation: Milu Wu, Junhui Zhao, Qijing Guo.
Formal analysis: Milu Wu, Junhui Zhao, Qijing Guo.
Writing – original draft: Baohua Fan, Cunfang Shen.
Writing – review & editing: Yushuang Luo.
Footnotes
Abbreviations: AUC = area under the curve, Ct = cycle threshold, GC = gastric cancer, miRNA = microRNA, PR = partial response, RT = reverse transcription, XELOX = oxaliplatin/capecitabine.
BF and CS are first coauthors.
Funding/support: This work was supported by National Natural Science Foundation of China (project No. 81760730) and Scientific Research Project Funds of Qinghai Department (project No. 2016-ZJ-785).
The authors have no conflicts of interest to disclose.
References
- [1].Torre LA, Bray F, Siegel RL, et al. Global cancer statistics, 2012. CA Cancer J Clin 2015;65:87–108. [DOI] [PubMed] [Google Scholar]
- [2].Yamashita K, Ema A, Hosoda K, et al. Macroscopic appearance of Type IV and giant Type III is a high risk for a poor prognosis in pathological stage II/III advanced gastric cancer with postoperative adjuvant chemotherapy. World J Gastrointest Oncol 2017;9:166–75. [DOI] [PMC free article] [PubMed] [Google Scholar]
- [3].Chan WL, Yuen KK, Siu SW, et al. Third-line systemic treatment versus best supportive care for advanced/metastatic gastric cancer: a systematic review and meta-analysis. Crit Rev Oncol Hematol 2017;116:68. [DOI] [PubMed] [Google Scholar]
- [4].Shah AB, Rejniak KA, Gevertz JL. Limiting the development of anti-cancer drug resistance in a spatial model of micrometastases. Math Biosci Eng 2017;13:1185–206. [DOI] [PMC free article] [PubMed] [Google Scholar]
- [5].Slattery ML, Herrick JS, Pellatt DF, et al. MicroRNA profiles in colorectal carcinomas, adenomas and normal colonic mucosa: variations in miRNA expression and disease progression. Carcinogenesis 2016;37:245. [DOI] [PMC free article] [PubMed] [Google Scholar]
- [6].Hayes J, Peruzzi PP, Lawler S. MicroRNAs in cancer: biomarkers, functions and therapy. Trends Mol Med 2014;20:460–9. [DOI] [PubMed] [Google Scholar]
- [7].Volinia S, Calin GA, Liu C, et al. A microRNA expression signature of human solid tumors defines cancer gene targets. Proc Natl Acad Sci USA 2006;103:2257–61. [DOI] [PMC free article] [PubMed] [Google Scholar]
- [8].Chang HK, Kim HK, Rettig RL, et al. miRNA signature associated with outcome of gastric cancer patients following chemotherapy. BMC Med Genomics 2011;4:79. [DOI] [PMC free article] [PubMed] [Google Scholar]
- [9].Xue-Mei WU, Shao XQ, Meng XX, et al. Genome-wide analysis of microRNA and mRNA expression signatures in hydroxy-camptothecin-resistant gastric cancer cells. Acta Pharmacol Sin 2011;32:259. [DOI] [PMC free article] [PubMed] [Google Scholar]
- [10].Li H, Wu Q, Li T, et al. The miR-17-92 cluster as a potential biomarker for the early diagnosis of gastric cancer: evidence and literature review. Oncotarget 2017;8:45060–71. [DOI] [PMC free article] [PubMed] [Google Scholar]
- [11].Awan FM, Naz A, Obaid A, et al. MicroRNA pharmacogenomics based integrated model of miR-17-92 cluster in sorafenib resistant HCC cells reveals a strategy to forestall drug resistance. Sci Rep 2017;7. [DOI] [PMC free article] [PubMed] [Google Scholar]
- [12].Park YH, Jae-Lyun L, Baek-Yeol R, et al. Capecitabine in combination with Oxaliplatin (XELOX) as a first-line therapy for advanced gastric cancer. Cancer Chemother Pharmacol 2008;61:623. [DOI] [PubMed] [Google Scholar]
- [13].Yan S, Li B, Bai ZZ, et al. Clinical epidemiology of gastric cancer in Hehuang valley of China: a 10-year epidemiological study of gastric cancer. World J Gastroenterol 2014;20:10486–94. [DOI] [PMC free article] [PubMed] [Google Scholar]
- [14].Zhang K, Zhang H, Zhou X, et al. miRNA589 regulates epithelial-mesenchymal transition in human peritoneal mesothelial cells. J Biomed Biotechnol 2014;2012:673096. [DOI] [PMC free article] [PubMed] [Google Scholar]
- [15].Eisenhauer EA, Verweij J. 11 New response evaluation criteria in solid tumors: RECIST GUIDELINE VERSION 1.1. Eur J Cancer Suppl 2009;7:5. [DOI] [PubMed] [Google Scholar]
- [16].Guo J, Miao Y, Xiao B, et al. Differential expression of microRNA species in human gastric cancer versus nonnonropean. J Gastroenterol Hepatol 2009;24:652–7. [DOI] [PubMed] [Google Scholar]
- [17].Wu Q, Yang Z, Wang F, et al. MiR-19b/20a/92a regulates the self-renewal and proliferation of gastric cancer stem cells. J Cell Sci 2013;126:4220–9. [DOI] [PubMed] [Google Scholar]
- [18].Aguda BD, Kim Y, Piperhunter MG, et al. MicroRNA regulation of a cancer network: consequences of the feedback loops involving miR-17-92, E2F, and Myc. Proc Nat Acad Sci U S A 2008;105:19678–83. [DOI] [PMC free article] [PubMed] [Google Scholar]
- [19].Fuziwara CS, Martins FE, Kimura ET. Abstract 5210: MicroRNA miR-17-92 impairs TGFβ signaling responsiveness in BRAF oncogene-activated thyroid cells. Cancer Res 2014;74:5210–15210. [Google Scholar]
- [20].Chamorro-Jorganes A, Lee M, Araldi E, et al. VEGF-induced expression of miR-17-92 cluster in endothelial cells is mediated by ERK/ELK1 activation and regulates angiogenesis. Circ Res 2016;118:38–47. [DOI] [PMC free article] [PubMed] [Google Scholar]
- [21].Yan Y, Hanse EA, Stedman K, et al. Transcription factor C/EBP-β induces tumor-suppressor phosphatase PHLPP2 through repression of the miR-17-92 cluster in differentiating AML cells. Cell Death Differ 2016;23:1232. [DOI] [PMC free article] [PubMed] [Google Scholar]
- [22].Gu J, Wang D, Zhang J, et al. GFRα2 prompts cell growth and chemoresistance through down-regulating tumor suppressor gene PTEN via Mir-17-5p in pancreatic cancer. Cancer Lett 2016;380:434. [DOI] [PubMed] [Google Scholar]
- [23].Cioffi M, Trabulo S, Sanchez-Ripoll Y, et al. The miR-17-92 cluster counteracts quiescence and chemoresistance in a distinct subpopulation of pancreatic cancer stem cells. Gut 2015;64:1936–48. [DOI] [PMC free article] [PubMed] [Google Scholar]
- [24].Zhou P, Ma L, Zhou J, et al. miR-17-92 plays an oncogenic role and conveys chemo-resistance to cisplatin in human prostate cancer cells. Int J Oncol 2016;48:1737. [DOI] [PubMed] [Google Scholar]


