Supplemental Digital Content is available in the text
Keywords: differently expressed genes, gene ontology, insulinoma, protein–protein interaction
Abstract
Insulinoma is a rare type tumor and its genetic features remain largely unknown. This study aimed to search for potential key genes and relevant enriched pathways of insulinoma.
The gene expression data from GSE73338 were downloaded from Gene Expression Omnibus database. Differentially expressed genes (DEGs) were identified between insulinoma tissues and normal pancreas tissues, followed by pathway enrichment analysis, protein–protein interaction (PPI) network construction, and module analysis. The expressions of candidate key genes were validated by quantitative real-time polymerase chain reaction (RT-PCR) in insulinoma tissues.
A total of 1632 DEGs were obtained, including 1117 upregulated genes and 514 downregulated genes. Pathway enrichment results showed that upregulated DEGs were significantly implicated in insulin secretion, and downregulated DEGs were mainly enriched in pancreatic secretion. PPI network analysis revealed 7 hub genes with degrees more than 10, including GCG (glucagon), GCGR (glucagon receptor), PLCB1 (phospholipase C, beta 1), CASR (calcium sensing receptor), F2R (coagulation factor II thrombin receptor), GRM1 (glutamate metabotropic receptor 1), and GRM5 (glutamate metabotropic receptor 5). DEGs involved in the significant modules were enriched in calcium signaling pathway, protein ubiquitination, and platelet degranulation. Quantitative RT-PCR data confirmed that the expression trends of these hub genes were similar to the results of bioinformatic analysis.
The present study demonstrated that candidate DEGs and enriched pathways were the potential critical molecule events involved in the development of insulinoma, and these findings were useful for better understanding of insulinoma genesis.
1. Introduction
As one most common functional neuroendocrine tumor originated from pancreatic islet β-cells, insulinoma is considered as relatively rare type tumor and its incidence rate is estimated as 1 to 4 in million people each year yet.[1] In fact, early diagnosis of insulinoma is difficult due to the clinical features of the small tumor size and solitary occurrence, likely leading to high morbidity.[2] Typical clinical characteristics include uncontrolled insulin production and hypoglycemia even in early stage of insulinoma.[1,3] In spite of most insulinomas belong to the solid benign tumor, approximately 10% of them are malignancy with local invasion or distant metastases.[1,3,4] Increasing evidences indicate that the initiation and progression of insulinoma involve multiple factors, such as gene aberrations and cellular context and influences.[5–7] However, little knowledge focus on molecular mechanism underlying insulinoma biological behaviors that are limited to be predicted by histopathological features. Thus, it is extremely important to unveil the gene expression patters and molecular biomarkers for early diagnosis, prevention, and personalized treatment of insulinoma.
The high-throughput microarray platforms are increasingly valued as promising tools in depicting gene expression profiles during tumorigenesis and tumor progression.[8–10] Microarray analysis is suitable for screening differentially expressed genes and their involvements in biological processes (BP), cellular components (CC), molecular functions (MF), or signaling pathways.[10] Numerous core slice data have been produced by gene chip, and are then deposited into public databases, such as the Gene Expression Omnibus (GEO) database of the National Center of Biotechnology Information (http://www.ncbi.nlm.nih.gov/geo/). Extracting and reanalyzing these data can provide valuable clues for revealing molecular mechanisms of rare tumors.[10,11]
In this study, the original data (GSE73338) was downloaded from GEO. The gene expression profiles of insulinoma samples were extracted and compared with those in normal pancreas tissues to identify the differently expressed genes (DEGs). Subsequently, the DEGs were screened with the application of GEO2R (http://www.ncbi.nlm.nih.gov/geo/geo2r/), followed by gene ontology (GO) and pathway enrichment analysis. Validation of key candidate DEGs expressions was performed through quantitative real-time polymerase chain reaction (RT-PCR). By analyzing their biological functions and pathways, we provided the further insight of insulinoma development at molecular level and exhibited potential biomarkers for diagnosis and drug targets.
2. Materials and methods
2.1. Microarray dataset
The gene expression profiles of 17 insulinoma tissues and 8 normal pancreas tissues of GSE73338 were obtained from GEO database. The microarray data of GSE73339 were conducted on GPL20945 platform (18.5K human oligo microarrays), from Ohio State University Cancer Center.
2.2. DEGs identifying
GEO2R tool, the approach based on limma (linear models for microarray analysis) R package for background correction and normalization of raw microarray data, was used to identify DEGs between insulinoma and normal pancreas tissues. Benjamini–Hochberg false discovery rate method was applied to correct for multiple testing in GEO2R. Log fold change (FC) represented the FC of the gene expression of insulinoma against that of normal pancreas tissue, and P < .05 and |logFC| > 1 as the cut-off criterion was set for statistically significant DEGs. DEGs volcano was generated by R package of pheatmap.
2.3. GO and pathway enrichment analysis of DEGs
GO analysis is commonly applied to annotate genes and gene products and identify specific biological attributes for large-scale molecular datasets by high-throughput microarrays. The Database for Annotation, Visualization and Integrated Discovery (DAVID, https://david.ncifcrf.gov/) is a web-accessible program that provides a comprehensive set of functional annotation tools for researchers to understand biological meaning from large gene lists. GO and Kyoto Encyclopedia of Genes and Genomes (KEGG) pathway enrichment analysis was exerted for DEGs through DAVID online tool.
2.4. Integration of PPI network and module analysis
Search Tool for the Retrieval of Interacting Genes (STRING) database (https://string-db.org/) is the popular online tool for evaluating protein–protein interaction (PPI) network. Therefore, the interactions of DEGs were analyzed by STRING. To avoid uncertain PPI, a high confidence with interaction score more than 0.7 was set as significance. Subsequently, PPI network was constructed by cytoscape software (version 3.5.1), and module analysis was done by the plug-in Molecular Complex Detection (MCODE). Representative modules were listed by the criteria of both MCODE scores and the number of nodes more than 5. DEGs in the representative modules were subjected to functional and pathway enrichment analysis.
2.5. Patient samples and quantitative RT-PCR
Quantitative RT-PCR was conducted to validate the expressions of these 7 hub genes in insulinoma tissues. Four pairs of tumor tissues and adjacent normal pancreatic tissues were collected from patients with insulinoma in Shiyan Taihe Hospital. Ethical approval was obtained from Ethical Review Committee of Shiyan Taihe Hospital, and informed consent was signed by all enrolled patients according to the Declaration of Helsinki. Total RNAs were extracted from tissues using TRIzol reagent (Invitrogen, Carlsbad, CA) according to instruction, followed by reverse transcription with Primescript RT Master Mix (Takara, Otsu, Japan) and cDNA amplification through SYBR-Green Master Mix Taq Kit (Takara). The expressions of these hub genes were normalized to against beta-actin expression. The data were calculated by the 2−ΔΔCt method. Primers used in the present study were cited from PrimerBank online (https://pga.mgh.harvard.edu/primerbank/) and listed in Appendix S1.
2.6. Statistical analysis
The data of gene expressions were presented as mean ± standard deviation and analyzed using unpaired Student t test by GraphPad Prism 6 (La Jolla, CA). P < .05 was considered as significant difference.
3. Results
3.1. Identification of DEGs
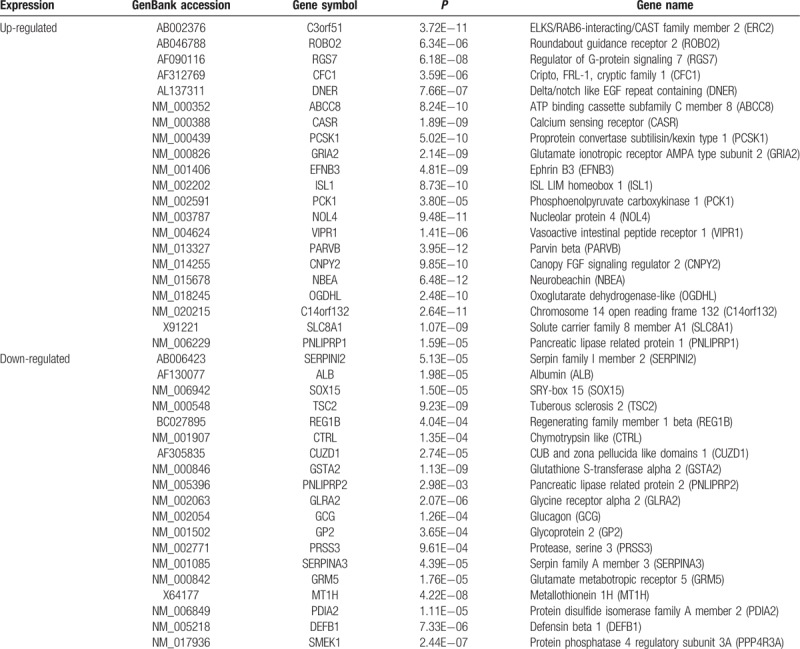
In total, 1631 DEGs, comprising 1117 upregulated and 514 downregulated genes, were identified between insulinoma and normal pancreas (Appendix S2). DEGs expressions were illustrated by volcano map (Fig. 1), and the top 20 upregulated and downregulated DEGs were showed in Table 1.
Figure 1.
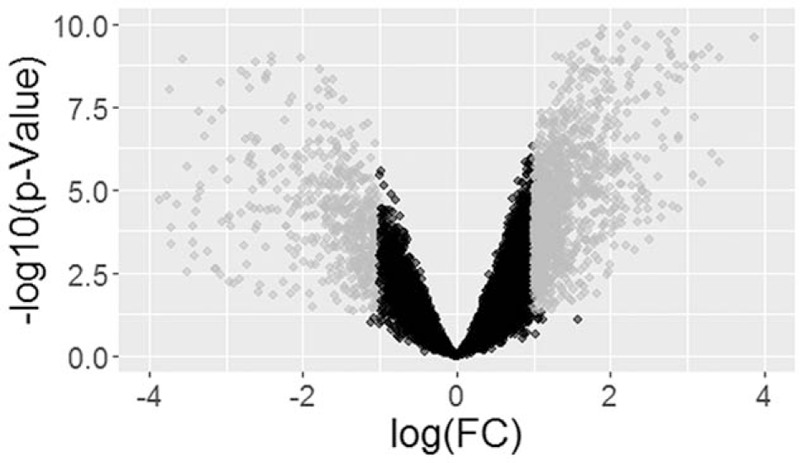
The volcano of differently expressed genes (DEGs). The gray dots represented the significant DEGs with fold change ≤ 2, while black dots indicated nonsignificant DEGs with fold change > 2.
Table 1.
Top 20 up-regulated and down-regulated of significant differently expressed genes.
3.2. GO term enrichment analysis
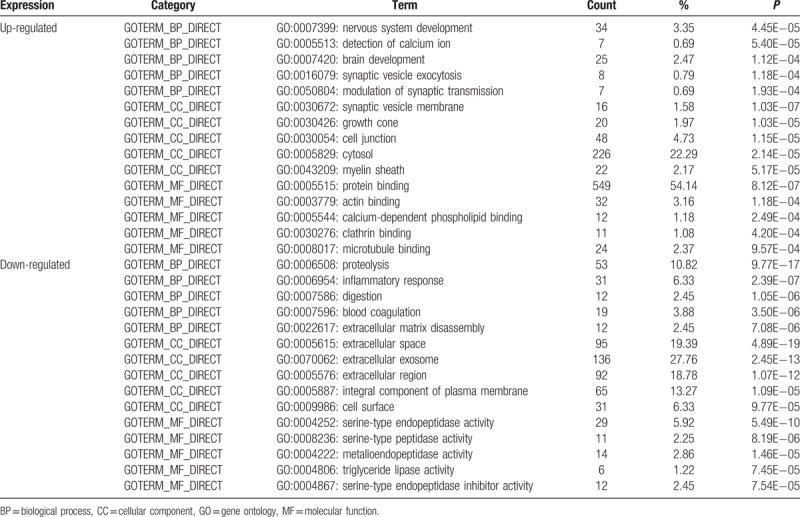
All significant DEGs were divided into upregulated genes and downregulated genes. GO categories and KEGG pathway analysis were conducted for these 2 lists of genes, respectively. Results of GO categories were presented by 3 functional groups, which were group BP, CC, and MF (Table 2). In group BP, upregulated DEGs were significantly enriched in nervous system development, detection of calcium ion, brain development, synaptic vesicle exocytosis, and modulation of synaptic transmission, while the downregulated DEGs were mainly enriched in proteolysis, inflammatory response, digestion, blood coagulation, and extracellular matrix disassembly. For group CC, upregulated DEGs mainly enriched in synaptic vesicle membrane, growth cone, cell junction, cytosol, and myelin sheath, and downregulated DEGs mainly enriched in extracellular space, extracellular exosome, extracellular region, integral component of plasma membrane, and cell surface. In addition, GO results of group MF showed that upregulated DEGs mainly enriched in protein binding, actin binding, calcium-dependent phospholipid binding, clathrin binding, and microtubule binding, and downregulated DEGs mainly enriched in serine-type endopeptidase activity, serine-type peptidase activity, metalloendopeptidase activity, triglyceride lipase activity, and serine-type endopeptidase inhibitor activity.
Table 2.
Gene ontology analysis of differentially expressed genes associated with insulinoma.
3.3. Pathway enrichment results
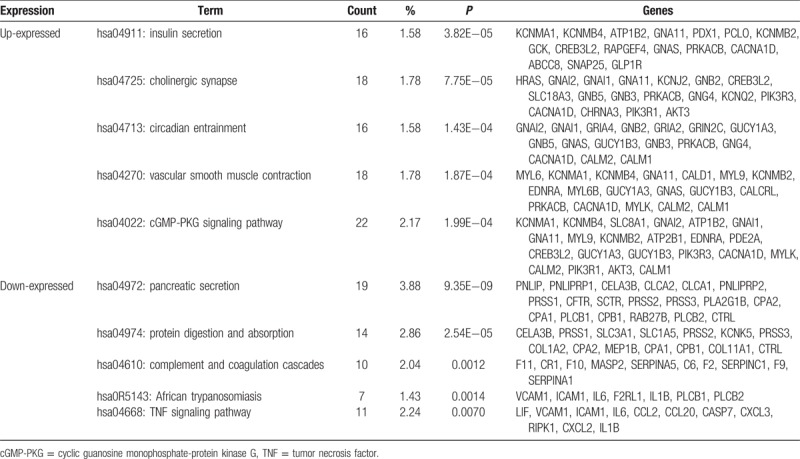
Several significant enriched pathways were acquired through KEGG pathway analysis (Table 3). The top 5 enriched pathways for upregulated genes included insulin secretion, cholinergic synapse, circadian entrainment, vascular smooth muscle contraction, and cyclic guanosine monophosphate-protein kinase G signaling pathway. Meanwhile, downregulated DEGs strikingly enriched in pathway of pancreatic secretion, protein digestion and absorption, complement and coagulation cascades, African trypanosomiasis, and tumor necrosis factor signaling.
Table 3.
Results of significant Kyoto Encyclopedia of Genes and Genomes pathway of differentially expressed genes associated with insulinoma.
3.4. Identification of key candidate genes and pathways by PPI network and module analysis
PPI network complex consisted of 328 nodes and 192 edges, wherein node and edge represented gene and interaction between 2 genes (Fig. 2). Seven nodes with the interaction degrees more than 10 were screened as hub genes (Fig. 2 and Table 4).[12] In addition, module analysis was conducted to detect the highly connected regions of PPI network, and 3 representative modules were obtained. Further functional and pathway enrichment analysis revealed that genes in these 3 representative modules were mostly implicated in G protein-coupled receptors (GPCR) signaling pathway, gastrin-cAMP responsive element binding protein (CREB) signaling pathway via protein kinase C (PKC) and mitogen-activated protein kinase (PPARγ), and extracellular matrix organization (Table 5).
Figure 2.
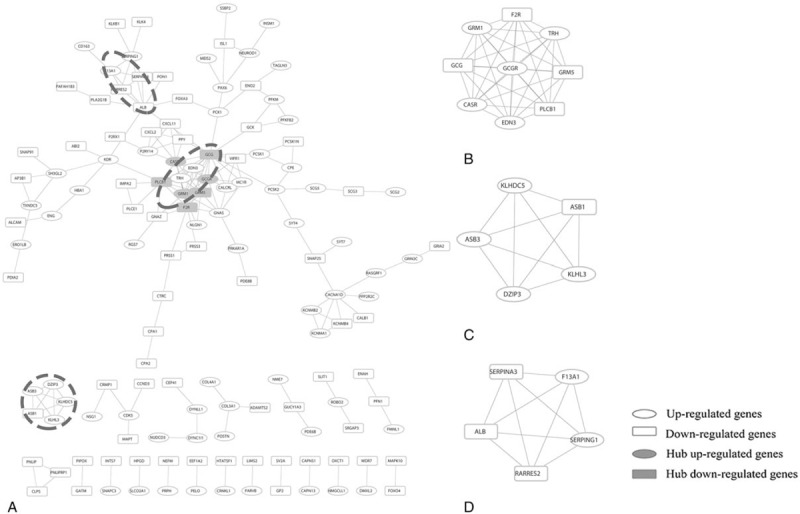
Protein–protein interaction (PPI) and modules analysis. (A) PPI network results and (B–D) represented modules 1, 2, and 3, respectively.
Table 4.
The hub genes identified by protein–protein interaction network analysis.

Table 5.
Pathway enrichment of differently expressed genes in the top 3 modules.

3.5. Validation of identified hub gene expressions
Human-derived insulinoma cell line has not been established worldwide, and insulinoma is a relatively rare type tumor. Only 4 pairs of insulinoma tissue samples and adjacent normal tissue samples from our center were collected for further expression detection of these hub genes. As shown in Fig. 3, the identified hub genes exhibited the similar trend as predicted by bioinformatics analysis. All of the cases indicated upregulation of calcium sensing receptor (CASR) and coagulation factor II thrombin receptor (F2R), and downregulation of glucagon (GCG) and glutamate metabotropic receptor 5 (GRM5) in tumor tissues compared with adjacent normal tissues. Of 4 patients, 3 cases demonstrated significantly higher expression of glucagon receptor (GCGR) while 1 case showed decreased expression of GCGR in tumor tissues in comparison with adjacent normal tissues. Three of 4 cases displayed the upregulation of glutamate metabotropic receptor 1 (GRM1) and downregulation of phospholipase C, beta 1 (PLCB1) in tumor tissues in comparison with adjacent normal tissues. However, the expression of GRM1 and PLCB1 was not significantly different between tumor tissues and adjacent normal tissues from the other one case.
Figure 3.
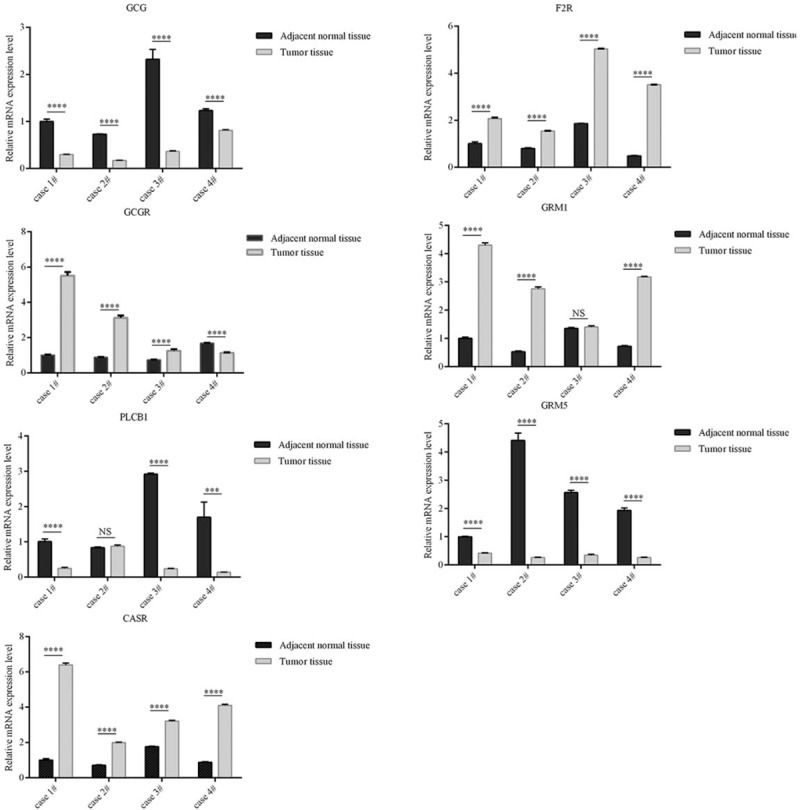
Quantitative real-time polymerase chain reaction results for 7 identified hub genes. Expression of these DEGs was normalized to ACTB expression. The statistical significance of differences was analyzed by the Student t test. ∗∗∗P < .001, ∗∗∗∗P < .0001. ACTB = beta-actin, DEGs = differently expressed genes, NS = nonsignificance.
4. Discussion
Genetic alteration is widely accepted as a robust molecule event of tumor. Unfortunately, little knowledge has focused on genetic alterations in insulinoma. In the present study, key candidate genes and enriched pathways of insulinoma were identified by bioinformatic analysis. We extracted the gene expression data from GSE73338 and obtained 1117 upregulated and 514 downregulated DEGs in insulinoma. Functional annotation showed that these DEGs were mainly involved in insulin secretion and pancreatic secretion KEGG pathway. Seven key candidate genes were filter out from identified DEGs by combination of PPI and module analysis. The expressions of identified hub genes were further confirmed by quantitative RT-PCR in insulinoma tissues.
Previous studies showed that abnormal insulin secretion was one of the prominent molecular events of insulinoma, and therefore, insulin was excessively biosynthesized and uncontrollably released into blood.[1,3] A similar result presented here was that insulin secretion pathway ranked as 1 the most significant enriched KEGG pathways. In total, 16 DEGs involved in insulin secretion pathway were overexpressed in insulinoma, suggesting that these DEGs were the major factors involved in insulin secretion activation and hyperinsulinism persistence. Furthermore, 19 downregulated DEGs were included in pancreatic secretion pathway. In fact, the involvement of DEGs in these 2 enriched pathways needs further investigation. Some DEGs seem to have multiple functions. For instance, cystic fibrosis transmembrane conductance regulator (CFTR) and phospholipase A2 group IB (PLA2G1B) included in pancreatic secretion pathway exerted the function on controlling insulin release,[13,14] and inducing postprandial hyperglycemia.[15]
To identified key candidate genes, the PPI network analysis was conducted and GCG, GCGR, PLCB1, CASR, F2R, GRM1, and GRM5 were filtered out. All these hub genes had been validated by quantitative RT-PCR, and exhibited the same expression directions as the results of bioinformatic analysis. GCG encoded preproprotein and was eventually cleaved into 4 mature peptides, including glucagon, a well-known molecule of counteracting the action of insulin and raising blood glucose level by stimulating glycogenolysis and gluconeogenesis.[16,17] The contribution of GCG downregulation to hypoglycemia might via decreasing expression of glucagon. In addition, glucagon is a ligand for a specific G-protein linked receptor whose signaling pathway controls cell proliferation, and increasing evidences showed that overexpression of glucagon could suppress the α/β-cell proliferation.[18,19] GCGR, which encoded glucagon receptor, plays an important role in controlling blood glucose level. Recent integrate microarray analysis identified GCGR as the hub gene in pancreatic neuroendocrine tumor (pNET) as well.[20] Our results revealed that GCGR up-regulation in insulinoma (Table S2). GCGR could enhance insulin secretion, pancreatic insulin content, and β-cell mass.[21] By contrary, mice model with deficient GCGR expression presented hyperglucagonemia, pancreatic α cell hyperplasia, and metastasis of pNET.[22] These results suggested that GCGR played a critical role in insulin secreting and blood glucose level reducing abnormally. Phospholipase C, β1 encoded by PLCB1 was implicated in intracellular signal transduction by catalyzing the formation of inositol 1,4,5-trisphosphate and diacylglycerol from phosphatidylinositol 4,5-bisphosphate.[23,24] PLCB1 inhibition was correlated to insulin secretion of β-cell by targeting PPARγ.[25] These data partly supported that reducing expression of PLCB1 presented here might be a key factor regulating insulin secretion in insulinoma. CASR encodes protein named calcium-sensing receptor, a G protein-coupled receptor located at plasma membrane, and plays a pivotal role in regulating diverse processes including inflammation, hormone secretion, gene expression, proliferation, differentiation, and apoptosis.[26] However, the roles of CASR remain to be inconsistent in different tumors. For instance, CASR promotes proliferation of human breast cancer cell lines, whereas prevents cell growth in colon cancer.[27,28] Its high expression and function on insulin secretion were described in a malignant metastatic insulinoma as well.[29] The highly expressed CASR in this work might be a central step for tumorigenesis and insulin release of insulinoma. F2R, a member of protease-activated receptor family and regulator of coagulation and thrombogenesis, was strikingly increasing in insulinoma according to the present study. This was consistent with previous researches demonstrating that F2R overexpression was associated with tumor proliferation, survival, angiogenesis, and metastasis, and F2R enhancement could promote β-cell proliferation and insulin release.[30,31] GRM1 and GRM5 were the members of metabotropic glutamate receptor family. GRM1 was the hub gene of colorectal cancer and upregulated during tumorigenesis,[32] while GRM5 suppressed the cell proliferation of osteosarcoma.[33] The similar expression trends of GRM1 and GRM5 were showed in our results, indicating that both 2 genes might be the potential biomarkers of insulinoma.
Module analysis was useful to screen clusters of genes with high interaction. Three top modules were screened out. Functional and pathway enrichment analysis revealed that DEGs comprised in these modules mainly enriched in PKC-activating G-protein coupled receptor signaling pathway, protein ubiquitination and platelet degranulation. PKC-activating G-protein coupled receptor signaling pathway is well known for the transducer of extracellular signals into intracellular effector and regulator of intracellular transducing molecules,[34,35] and is activated in human cancers frequently.[34] G protein-coupled receptors are abundantly expressed in islet cells and most of them are the critical regulator of insulin secretion.[36,37] Thus, PKC-activating G-protein coupled receptor signaling pathway plays diverse roles in cellular functions like cell viability, proliferation, and hormone release including insulin secretion.[37,38] Protein ubiquitination is a fundament post-translational modification, and predominantly regulates cell cycle resulting in abnormal proliferation in various tumors.[39,40] Meanwhile, the function of protein ubiquitination has been revealed in regulating insulin secretion detail.[41,42] Platelet degranulation has been mainly investigated in regulating thrombogenesis and cardiovascular diseases.[43] Few investigations have focused on the relation of platelet degranulation to human cancers, except a recent study with results of platelet degranulation activating prosurvival signaling through releasing small molecules in ovarian cancer.[44]
In conclusion, the present study identified candidate DEGs and BP involved in the tumorigenesis and abnormal insulin secretion of insulinoma by a bioinformatic approach. Our findings provided a novel insight on elucidating the molecular mechanism of insulinoma. However, further experiments are essential to validate the functions of candidate DEGs and enriched BP.
Acknowledgment
The authors thank Scarpa A for sharing the expression profiling array of GSE73338.
Author contributions
Data curation: Yunyan Wan.
Formal analysis: Li Gong, Yunyan Wan.
Funding acquisition: Yunyan Wan.
Investigation: Wuhua Zhou.
Methodology: Wuhua Zhou, Yunyan Wan.
Project administration: Bin Jiang.
Resources: Xuefeng Li, Xiangfei Wang.
Software: Wuhua Zhou, Xiangfei Wang.
Supervision: Xuefeng Li, Bin Jiang.
Validation: Wuhua Zhou, Huili Li, Bin Jiang.
Writing – original draft: Wuhua Zhou, Li Gong.
Writing – review and editing: Wuhua Zhou, Li Gong, Yunyan Wan, Bin Jiang.
Supplementary Material
Supplementary Material
Footnotes
Abbreviations: BP = biological processes, CC = cellular components, DAVID = the Database for Annotation, Visualization and Integrated Discovery, DEGs= differently expressed genes, FC = fold change, GEO = Gene Expression Omnibus, GO = gene ontology, GSE = gene set enrichment, KEGG = Kyoto Encyclopedia of Genes and Genomes, MF = molecular functions, pNET = pancreatic neuroendocrine tumor, PPI = protein–protein interaction, RT-PCR = real-time polymerase chain reaction, STRING = Search Tool for the Retrieval of Interacting Genes.
WZ and LG have contributed equally to this work.
This work was supported by grants from the Municipal Science and Technology Program of Shiyan City (15K67).
The authors have no conflicts of interest to disclose.
Supplemental Digital Content is available for this article.
References
- [1].Okabayashi T, Shima Y, Sumiyoshi T, et al. Diagnosis and management of insulinoma. World J Gastroenterol 2013;19:829–37. [DOI] [PMC free article] [PubMed] [Google Scholar]
- [2].Vaidakis D, Karoubalis J, Pappa T, et al. Pancreatic insulinoma: current issues and trends. Hepatobiliary Pancreat Dis Int 2010;9:234–41. [PubMed] [Google Scholar]
- [3].Grant CS. Insulinoma. Best Pract Res Clin Gastroenterol 2005;19:783–98. [DOI] [PubMed] [Google Scholar]
- [4].Hirshberg B, Cochran C, Skarulis MC, et al. Malignant insulinoma: spectrum of unusual clinical features. Cancer 2005;104:264–72. [DOI] [PMC free article] [PubMed] [Google Scholar]
- [5].Jonkers YM, Claessen SM, Veltman JA, et al. Molecular parameters associated with insulinoma progression: chromosomal instability versus p53 and CK19 status. Cytogenet Genome Res 2006;115:289–97. [DOI] [PubMed] [Google Scholar]
- [6].Jonkers YM, Claessen SM, Perren A, et al. Chromosomal instability predicts metastatic disease in patients with insulinomas. Endocr Relat Cancer 2005;12:435–47. [DOI] [PubMed] [Google Scholar]
- [7].Delellis RA, Lloyd RV, Heitz PU. Pathology and Genetics of Tumours of Endocrine Organs. Lyon, France: IARC Press; 2004. [Google Scholar]
- [8].Armstrong NJ, Ma VDW. Microarray data analysis: from hypotheses to conclusions using gene expression data. Cell Oncol 2016;26:279–90. [DOI] [PMC free article] [PubMed] [Google Scholar]
- [9].Elek J, Park KH, Narayanan R. Microarray-based expression profiling in prostate tumors. In Vivo 2000;14:173–82. [PubMed] [Google Scholar]
- [10].Kulasingam V, Diamandis EP. Strategies for discovering novel cancer biomarkers through utilization of emerging technologies. Nat Clin Pract Oncol 2008;5:588–99. [DOI] [PubMed] [Google Scholar]
- [11].Loging WT, Lal A, Siu IM, et al. Identifying potential tumor markers and antigens by database mining and rapid expression screening. Genome Res 2000;10:1393–402. [DOI] [PMC free article] [PubMed] [Google Scholar]
- [12].Guo Y, Bao Y, Ma M, et al. Identification of key candidate genes and pathways in colorectal cancer by integrated bioinformatical analysis. Int J Mol Sci 2017;18:E722. [DOI] [PMC free article] [PubMed] [Google Scholar]
- [13].Edlund A, Huhn M, Flodstrom-Tullberg M, et al. Active CFTR channels are important for insulin- and glucagon secretion. Diabetologia 2010;53:S225. [Google Scholar]
- [14].Sun XS, Yi YL, Xie WL, et al. CFTR influences beta cell function and insulin secretion through non-cell autonomous exocrine-derived factors. Endocrinology 2017;158:3325–38. [DOI] [PMC free article] [PubMed] [Google Scholar]
- [15].Labonté ED, Kirby RJ, Schildmeyer NM, et al. Group 1B phospholipase A2-mediated lysophospholipid absorption directly contributes to postprandial hyperglycemia. Diabetes 2006;55:935–41. [DOI] [PMC free article] [PubMed] [Google Scholar]
- [16].Sandoval DA, D’Alessio DA. Physiology of proglucagon peptides: role of glucagon and GLP-1 in health and disease. Physiol Rev 2015;95:513–48. [DOI] [PubMed] [Google Scholar]
- [17].Lee YH, Wang MY, Yu XX, et al. Glucagon is the key factor in the development of diabetes. Diabetologia 2016;59:1372–5. [DOI] [PubMed] [Google Scholar]
- [18].Kedees MH, Grigoryan M, Guz Y, et al. Differential expression of glucagon and glucagon-like peptide 1 receptors in mouse pancreatic alpha and beta cells in two models of alpha cell hyperplasia. Mol Cell Endocrinol 2009;311:69–76. [DOI] [PMC free article] [PubMed] [Google Scholar]
- [19].Liu Z, Kim W, Chen Z, et al. Insulin and glucagon regulate pancreatic alpha-cell proliferation. PLoS ONE 2011;6:e16096. [DOI] [PMC free article] [PubMed] [Google Scholar]
- [20].Zhou H, Chen Q, Tan W, et al. Integrated clinicopathological features and gene microarray analysis of pancreatic neuroendocrine tumors. Gene 2017;625:72–7. [DOI] [PubMed] [Google Scholar]
- [21].Gelling RW, Vuguin PM, Du XQ, et al. Pancreatic beta-cell overexpression of the glucagon receptor gene results in enhanced beta-cell function and mass. Am J Physiol Endocrinol Metab 2009;297:E695–707. [DOI] [PMC free article] [PubMed] [Google Scholar]
- [22].Yu R, Dhall D, Nissen NN, et al. Pancreatic neuroendocrine tumors in glucagon receptor-deficient mice. PLoS ONE 2011;6:e23397. [DOI] [PMC free article] [PubMed] [Google Scholar]
- [23].Filtz TM, Grubb DR, Mcleod-Dryden TJ, et al. Gq-initiated cardiomyocyte hypertrophy is mediated by phospholipase Cbeta1b. FASEB J 2009;23:3564–70. [DOI] [PubMed] [Google Scholar]
- [24].Sengelaub CA, Navrazhina K, Ross JB, et al. PTPRN2 and PLCβ1 promote metastatic breast cancer cell migration through PI(4,5)P2-dependent actin remodeling. EMBO J 2016;35:62–76. [DOI] [PMC free article] [PubMed] [Google Scholar]
- [25].Fiume R, Ramazzotti G, Faenza I, et al. Nuclear PLCs affect insulin secretion by targeting PPARgamma in pancreatic beta cells. FASEB J 2012;26:203–10. [DOI] [PubMed] [Google Scholar]
- [26].Tennakoon S, Aggarwal A, Kallay E. The calcium-sensing receptor and the hallmarks of cancer. Biochim Biophys Acta 2016;1863:1398–407. [DOI] [PubMed] [Google Scholar]
- [27].El Hiani Y, Lehen’kyi V, Ouadid-Ahidouch H, et al. Activation of the calcium-sensing receptor by high calcium induced breast cancer cell proliferation and TRPC1 cation channel over-expression potentially through EGFR pathways. Arch Biochem Biophys 2009;486:58–63. [DOI] [PubMed] [Google Scholar]
- [28].Bhagavathula N, Nerusu KC, Chakrabarty S, et al. Role of calcium sensing receptor in promoting differentiation in colon carcinoma cells. Cancer Res 2006;66:769–79. [Google Scholar]
- [29].Ono Y, Oda N, Ishihara S, et al. Insulinoma cell calcium-sensing receptor influences insulin secretion in a case with concurrent familial hypocalciuric hypercalcemia and malignant metastatic insulinoma. Eur J Endocrinol 2008;159:81–6. [DOI] [PubMed] [Google Scholar]
- [30].Kreutter G, Kassem M, El Habhab A, et al. Endothelial microparticles released by activated protein C protect beta cells through EPCR/PAR1 and annexin A1/FPR2 pathways in islets. J Cell Mol Med 2017;21:2759–72. [DOI] [PMC free article] [PubMed] [Google Scholar]
- [31].Yin YJ, Salah Z, Maoz M, et al. Oncogenic transformation induces tumor angiogenesis: a role for PAR1 activation. FASEB J 2003;17:163–74. [DOI] [PubMed] [Google Scholar]
- [32].Palaniappan A, Ramar K, Ramalingam S. Computational identification of novel stage-specific biomarkers in colorectal cancer progression. PLoS ONE 2016;11:1–21. [DOI] [PMC free article] [PubMed] [Google Scholar]
- [33].Liao S, Ruiz Y, Gulzar H, et al. Osteosarcoma cell proliferation and survival requires mGluR5 receptor activity and is blocked by Riluzole. PLoS ONE 2017;12:e0171256. [DOI] [PMC free article] [PubMed] [Google Scholar]
- [34].Dorsam RT, Gutkind JS. G-protein-coupled receptors and cancer. Nat Rev Cancer 2007;7:79–94. [DOI] [PubMed] [Google Scholar]
- [35].Rosenbaum DM, Rasmussen SG, Kobilka BK. The structure and function of G-protein-coupled receptors. Nature 2009;459:356–63. [DOI] [PMC free article] [PubMed] [Google Scholar]
- [36].Chu ZL, Jones RM, He H, et al. A role for beta-cell-expressed G protein-coupled receptor 119 in glycemic control by enhancing glucose-dependent insulin release. Endocrinology 2007;148:2601–9. [DOI] [PubMed] [Google Scholar]
- [37].Yamada H, Yoshida M, Ito K, et al. Potentiation of glucose-stimulated insulin secretion by the GPR40-PLC-TRPC pathway in pancreatic beta-cells. Sci Rep 2016;6:25912. [DOI] [PMC free article] [PubMed] [Google Scholar]
- [38].Heasley LE. Autocrine and paracrine signaling through neuropeptide receptors in human cancer. Oncogene 2001;20:1563–9. [DOI] [PubMed] [Google Scholar]
- [39].Hoeller D, Dikic I. Targeting the ubiquitin system in cancer therapy. Nature 2009;458:438–44. [DOI] [PubMed] [Google Scholar]
- [40].Nakayama KI, Nakayama K. Ubiquitin ligases: cell-cycle control and cancer. Nat Rev Cancer 2006;6:369–81. [DOI] [PubMed] [Google Scholar]
- [41].Kawaguchi M, Minami K, Nagashima K, et al. Essential role of ubiquitin-proteasome system in normal regulation of insulin secretion. J Biol Chem 2006;281:13015–20. [DOI] [PubMed] [Google Scholar]
- [42].Lopez-Avalos MD, Duvivier-Kall VF, Xu G, et al. Evidence for a role of the ubiquitin-proteasome pathway in pancreatic islets. Diabetes 2006;55:1223–31. [DOI] [PubMed] [Google Scholar]
- [43].Blann AD, Nadar SK, Lip GY. The adhesion molecule P-selectin and cardiovascular disease. Eur Heart J 2003;24:2166–79. [DOI] [PubMed] [Google Scholar]
- [44].Egan K, Crowley D, Smyth P, et al. Platelet adhesion and degranulation induce pro-survival and pro-angiogenic signalling in ovarian cancer cells. PLoS ONE 2011;6:e26125. [DOI] [PMC free article] [PubMed] [Google Scholar]
Associated Data
This section collects any data citations, data availability statements, or supplementary materials included in this article.


