Abstract
The mechanisms by which metformin (dimethylbiguanide) inhibits hepatic gluconeogenesis at concentrations relevant for type 2 diabetes therapy remain debated. Two proposed mechanisms are 1) inhibition of mitochondrial Complex 1 with consequent compromised ATP and AMP homeostasis or 2) inhibition of mitochondrial glycerophosphate dehydrogenase (mGPDH) and thereby attenuated transfer of reducing equivalents from the cytoplasm to mitochondria, resulting in a raised lactate/pyruvate ratio and redox-dependent inhibition of gluconeogenesis from reduced but not oxidized substrates. Here, we show that metformin has a biphasic effect on the mitochondrial NADH/NAD redox state in mouse hepatocytes. A low cell dose of metformin (therapeutic equivalent: <2 nmol/mg) caused a more oxidized mitochondrial NADH/NAD state and an increase in lactate/pyruvate ratio, whereas a higher metformin dose (≥5 nmol/mg) caused a more reduced mitochondrial NADH/NAD state similar to Complex 1 inhibition by rotenone. The low metformin dose inhibited gluconeogenesis from both oxidized (dihydroxyacetone) and reduced (xylitol) substrates by preferential partitioning of substrate toward glycolysis by a redox-independent mechanism that is best explained by allosteric regulation at phosphofructokinase-1 (PFK1) and/or fructose 1,6-bisphosphatase (FBP1) in association with a decrease in cell glycerol 3-phosphate, an inhibitor of PFK1, rather than by inhibition of transfer of reducing equivalents. We conclude that at a low pharmacological load, the metformin effects on the lactate/pyruvate ratio and glucose production are explained by attenuation of transmitochondrial electrogenic transport mechanisms with consequent compromised malate–aspartate shuttle and changes in allosteric effectors of PFK1 and FBP1.
Keywords: metformin, metabolic regulation, metabolic disease, gluconeogenesis, redox regulation, dimethylbiguanide, mitochondrial glycerophosphate dehydrogenase, phosphofructokinase-1
Introduction
Metformin (dimethylbiguanide) is the most widely prescribed drug for lowering blood glucose in type 2 diabetes (1). Its therapeutic effect is in part mediated by inhibition of hepatic glucose production (2) and is thought to involve chronic changes in gene expression (3–5) and acute inhibition of gluconeogenesis (6–8). The first mechanism that was identified for the acute suppression of gluconeogenesis was the inhibition of Complex 1 of the respiratory chain (NADH:ubiquinone oxidoreductase) with a consequent decrease in the cell ATP/ADP ratio in conjunction with a more reduced mitochondrial and cytoplasmic NADH/NAD redox state as determined from the raised ratios of 3-hydroxybutyrate/acetoacetate and lactate/pyruvate, respectively (9–13). The inhibition of gluconeogenesis was attributed to either the decrease in the cell ATP/ADP ratio (9, 10, 14) or to activation of AMPK3 resulting from the raised AMP (15). Subsequently, arguments were proposed in support of AMPK-independent mechanisms through either lowering of ATP or raised AMP (16) causing inhibition of glucagon signaling (17) or FBP1 (18) or alternatively through inhibition of mitochondrial glycerophosphate dehydrogenase (mGPDH) (19, 20). Cellular studies using high millimolar metformin concentrations and showing substantial lowering of gluconeogenesis and cell ATP are now thought to be of limited relevance, because in diabetes therapy, blood metformin concentrations are in the low micromolar range, and substantial lowering of ATP is thought not to occur during metformin therapy (1, 6).
Recently, two distinct mechanisms have been proposed to explain the inhibition of gluconeogenesis by a pharmacological metformin dose of therapeutic relevance. One proposes mild elevation in AMP through compromised hepatic energy status, resulting in inhibition of glucagon signaling (17) and allosteric inhibition of FBP1 (18). The other proposes inhibition by metformin of mGPDH, the key enzyme of the GP-shuttle, which is one of two shuttles that transfers reducing equivalents from the cytoplasm to the mitochondria (19, 20). mGPDH is a flavin-linked mitochondrial dehydrogenase that catalyzes G3P oxidation to dihydroxyacetone-P on the cytoplasmic side coupled to the reduction of FAD and transfer of electrons to the respiratory chain via ubiquinone (21). Inhibition of mGPDH by metformin is proposed to cause simultaneously a more reduced cytoplasmic NADH/NAD state evident from a higher lactate/pyruvate ratio and a more oxidized mitochondrial NADH/NAD redox state evident from a lower ratio of 3-hydroxybutyrate/acetoacetate (19, 20). A key caveat to this mechanism is that it predicts inhibition of gluconeogenesis from reduced substrates (lactate and glycerol) but not from oxidized substrates (pyruvate and dihydroxyacetone), whereas the first mechanism proposing inhibition of FBP1 by AMP predicts redox-independent inhibition of gluconeogenesis from oxidized and reduced substrates. A further caveat to the second mechanism is that it predicts a more oxidized mitochondrial NADH/NAD ratio (lower 3-hydroxybutyrate/acetoacetate) as opposed to a more reduced state, as occurs by inhibition of Complex 1 and as documented from hepatocyte studies with metformin (9–12). To date, a more oxidized mitochondrial NADH/NAD ratio in response to metformin has only been shown in liver in vivo (19, 20) but not in isolated hepatocytes. The aims of this study were, first, to test whether metformin has a dose-dependent effect on the mitochondrial NADH/NAD ratio in hepatocytes and, second, to explore the mechanism(s) by which a low metformin dose that is within the therapeutic range, affects gluconeogenesis and compare this with inhibition and/or stimulation of transfer of NADH-reducing equivalents from the cytoplasm to the mitochondria by the GP-shuttle or the malate–aspartate shuttle (MA-shuttle). We report that clinically relevant doses of metformin cause a more oxidized mitochondrial NADH/NAD redox state and a more reduced cytoplasmic redox state but inhibit gluconeogenesis from oxidized substrates. This is best explained by a redox-independent mechanism involving allosteric regulation at the level of PFK1 and/or FBP1 that is in part explained by a decrease in cell glycerol 3-phosphate, an inhibitor of PFK1.
Results
Biphasic effect of metformin on the mitochondrial redox state: more oxidized at low metformin
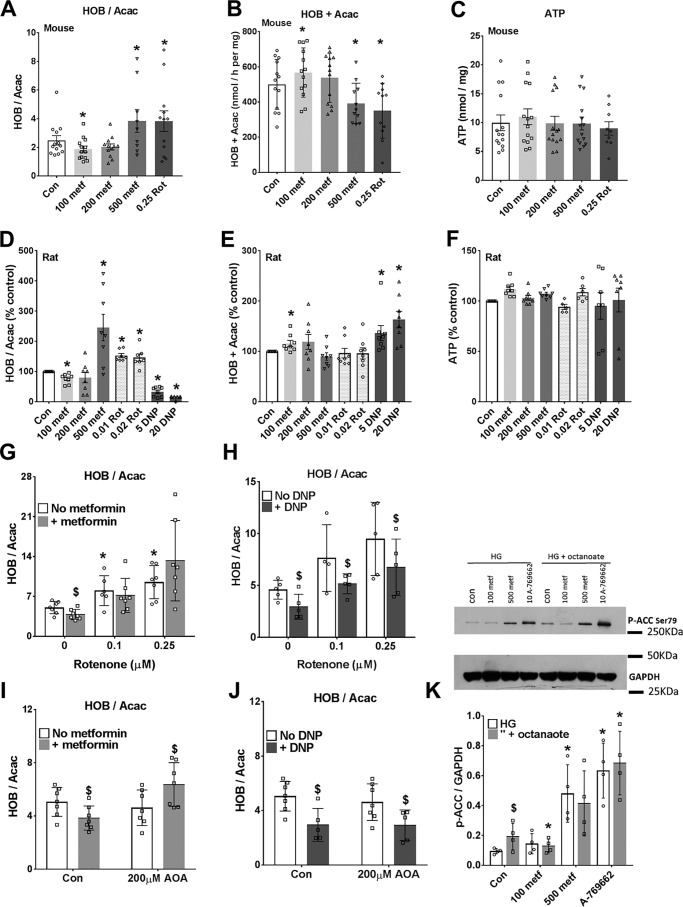
Studies in vivo showed that metformin causes either a more reduced (10) or a more oxidized (19, 20) mitochondrial NADH/NAD redox state in liver based on the ratio of 3-hydroxybutyrate/acetoacetate that correlates with the mitochondrial NADH/NAD ratio through the hydroxybutyrate dehydrogenase equilibrium (22). Our first aim was to determine whether metformin (100–500 μm) has a dose-dependent effect on the mitochondrial NADH/NAD redox state in hepatocytes incubated with octanoate. This medium-chain fatty acid enters the mitochondria as the free acid by a mechanism independent of regulation by malonyl-CoA and thereby AMPK activity and is metabolized predominantly to acetoacetate and 3-hydroxybutyrate. We used 100 μm as the lowest metformin concentration because in hepatocytes incubated with 100 μm metformin for 2–4 h, metformin accumulates in the cells to 1–2 nmol/mg protein (23). This is within the range observed in mouse liver after an oral dose of 50 mg metformin/kg body weight (24). At the highest concentration (500 μm), metformin accumulates to 5–10 nmol/mg (23) in rat and mouse hepatocytes. In both mouse and rat hepatocytes, high metformin (500 μm) increased the ratio of 3-hydroxybutyrate/acetoacetate as did rotenone, the Complex I inhibitor (Fig. 1, A and D), and as shown previously with millimolar metformin in hepatocytes (9–12). However, 100 μm metformin decreased the 3-hydroxybutyrate/acetoacetate ratio (Fig. 1, A and D), indicating a more oxidized mitochondrial NADH/NAD state (22). This effect could be due to a decrease in production of NADH (if octanoate β-oxidation were inhibited) or to other mechanisms. The rate of production of acetoacetate plus 3-hydroxybutyrate was increased by 100 μm metformin in both mouse and rat hepatocytes, and it was also increased by the uncoupler dinitrophenol (DNP) (Fig. 1, B and E), which, similar to low metformin, decreased the 3-hydroxybutyrate/acetoacetate ratio (Fig. 1D). This implicates a more oxidized NADH/NAD state as the primary effect of 100 μm metformin with the increase in ketone body production as secondary to the oxidized NADH/NAD ratio. When the effects of low metformin and DNP were tested in the presence of rotenone (Fig. 1, G and H), only DNP lowered the 3-hydroxybutyrate/acetoacetate ratio, suggesting that the metformin effect is either upstream of the rotenone site or alternatively abolished by rotenone through other mechanisms. Although cell ATP was maintained in cells treated with metformin (Fig. 1, C and F), this does not exclude small localized changes in free ATP/ADP ratio in the cytoplasm (10). We next tested for activation of AMPK by the low and high metformin concentrations from phosphorylation of the AMPK substrate, acetyl-CoA carboxylase (ACC)-Ser-79 and used the small molecule AMPK activator A-769662 (10 μm) as a reference control (25) in incubations without and with octanoate in mouse hepatocytes (Fig. 1K). The high metformin concentration (500 μm) caused increased ACC phosphorylation, as occurred with A-769662. Octanoate alone also increased ACC phosphorylation, indicating AMPK activation. This suggests raised AMP with octanoate most likely via the acyl-CoA synthase, as reported previously (26). There was lower phosphorylation of ACC by 100 μm metformin in combination with octanoate. This may be due to accelerated clearance of octanoate by 100 μm metformin.
Figure 1.
Biphasic effect of metformin on the mitochondrial redox state: more oxidized at low metformin. Mouse hepatocytes (A–C) and rat hepatocytes (D–F) were precultured for 24 h and then incubated for 2 h in MEM with the metformin concentrations (100–500 μm) indicated. The medium was then replaced with fresh MEM containing 25 mm glucose, 0.25 mm octanoate, and the additions shown, and incubations were for 1 h. The medium was collected for analysis of acetoacetate (Acac) and d-3-hydroxybutyrate (HOB), and the cells were snap-frozen for ATP analysis. A and D, ratio of 3-hydroxybutyrate/acetoacetate; B and E, total production of acetoacetate + 3-hydroxybutyrate; C and F, cell ATP. Mouse data are expressed per mg of protein, and rat data are expressed as a percentage of control. Shown are means ± S.D. (error bars) for n = 8–14 hepatocyte preparations; *, p < 0.05 relative to control. G–J, mouse hepatocytes cultured for 3 h after cell plating and then incubated for 2 h without (open) or with (shaded) 100 μm metformin (G and I) and then for 1 h in fresh MEM containing 25 mm glucose + 0.125 mm octanoate and the additions indicated. G and H, effects of metformin (100 μm) or DNP (20 μm) with/without rotenone (0.1 or 0.25 μm); I and J, with/without AOA (200 μm). Results are means ± S.D.; n = 5–7. *, p < 0.05 relative to respective control; $, metformin or DNP effect. K, immunoblot for phospho-ACC for mouse hepatocytes incubated with/without metformin (100 or 500 μm) and A-769662 (10 μm) for 3 h in MEM with 25 mm glucose (HG) with/without 0.125 mm octanoate for the last hour. Shown are representative immunoblotting and densitometry for n = 4 mouse hepatocyte preparations. *, p < 0.05 relative to respective control; $, p < 0.05 octanoate effect.
Metformin causes greater inhibition of glucose production from dihydroxyacetone than from glycerol
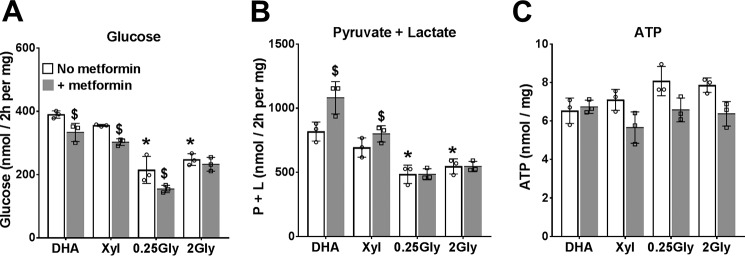
Having confirmed that low metformin (100 μm) causes a more oxidized mitochondrial NADH/NAD redox state without inhibiting ketone body production, we next determined the effects of 100 μm metformin on glucose production from oxidized (dihydroxyacetone (DHA)) and reduced (glycerol and xylitol) substrates. Glucose production was significantly higher from DHA than from glycerol (Fig. 2). Metformin inhibited glucose production from both oxidized (DHA) and reduced (xylitol and 0.25 mm glycerol) substrates, and it increased the production of lactate and pyruvate with both DHA and xylitol (Fig. 2, A and B). Cell ATP was unchanged by metformin with DHA but was lowered with the reduced substrates (Fig. 2C). This indicates inhibition of gluconeogenesis from both oxidized and reduced substrates by low metformin.
Figure 2.
Effects of metformin on glucose production from oxidized and reduced substrates. After overnight culture, mouse hepatocytes were preincubated for 2 h in glucose-free DMEM without or with 100 μm metformin. The medium was then replaced by fresh glucose-free DMEM containing either 5 mm DHA, 2 mm xylitol (Xyl), or glycerol at 0.25 mm or 2 mm. After 2 h, the medium was collected for determination of glucose (A), pyruvate and lactate (B), and cell ATP (C). Results are means ± S.D. (error bars) for triplicate plates from one hepatocyte isolation. *, p < 0.05 relative to DHA; $, metformin effect.
Low metformin, but not inhibitors of the NADH shuttles, favors metabolism of DHA and xylitol to glycolysis relative to glucose
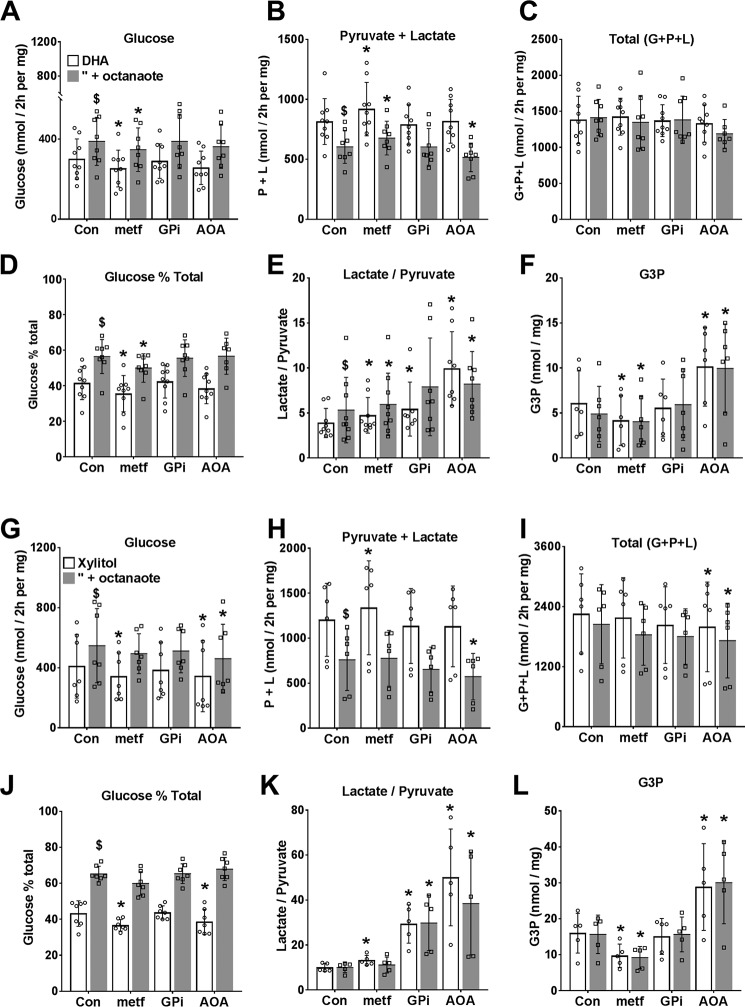
To test whether inhibition of glucose production by low metformin can be explained by inhibition of NADH shuttles, we compared 100 μm metformin with aminooxyacetate (AOA), an inhibitor of the MA-shuttle (27), or GPi (STK017597, GPI), a recently identified inhibitor (28) of the GP-shuttle, on metabolism of DHA (Fig. 3, A–F) or xylitol (Fig. 3, G–L) in either the absence (open bars) or presence (shaded bars) of octanoate as a source of mitochondrial NADH. Metformin inhibited glucose production and increased lactate plus pyruvate production without affecting total metabolism to glucose plus pyruvate and lactate from DHA (Fig. 3, A–C) or xylitol (Fig. 3, G–I). Accordingly, metformin decreased the fractional partitioning of DHA and xylitol to glucose relative to glycolysis (Fig. 3, D and J). Octanoate (shaded bars) had opposite effects from metformin and increased partitioning of DHA and xylitol to glucose relative to glycolysis with no significant effect on total metabolism (Fig. 3, A–D and G–J). Both the lactate/pyruvate ratio and cell G3P were higher with the reduced substrate xylitol (Fig. 3, K and L) than with DHA (Fig. 3, E and F), as expected (29), and octanoate increased the lactate/pyruvate ratio with DHA (Fig. 3E) but not with xylitol (Fig. 3K). Metformin increased the lactate/pyruvate ratio with both DHA and xylitol but decreased G3P (Fig. 3, panels E and K and panels F and L). The MA-shuttle inhibitor, AOA, caused a large increase in the lactate/pyruvate ratio, as expected (27), but the GPi had a smaller effect than AOA. Unlike metformin, AOA increased G3P (Fig. 3, F and L) and did not decrease partitioning of DHA to glucose. AOA decreased total metabolism of the reduced substrate xylitol to glucose, pyruvate, and lactate (Fig. 3I). Cumulatively, these results support the following conclusions. First, low metformin inhibited glucose production from both oxidized (DHA) and reduced (xylitol) substrates by increasing partitioning to glycolysis, with a concomitant increase in lactate/pyruvate ratio and a decrease in cell G3P. Second, AOA, which caused a more reduced cytoplasmic redox state (lactate/pyruvate ratio) than metformin, did not mimic the metformin inhibition of gluconeogenesis from DHA, but it decreased total xylitol metabolism and increased cell G3P. Third, the inhibitor of mGPDH (GPi, 20 μm) was less effective than the MA-shuttle inhibitor (AOA) in raising the lactate/pyruvate ratio and did not raise cell G3P, the substrate of mGPDH. Fourth, octanoate, which promotes an increase in lactate/pyruvate ratio with DHA but not with xylitol, had opposite effects from metformin on the directionality of flux between glycolysis and gluconeogenesis with both DHA and xylitol as substrates.
Figure 3.
Dihydroxyacetone and xylitol metabolism to glucose, pyruvate, and lactate: effects of metformin and NADH shuttle inhibitors. Mouse hepatocytes were preincubated for 2 h in glucose-free DMEM. The medium was then replaced by fresh medium containing either 5 mm DHA (A–F) or 2 mm xylitol (G–L) either without (open bars) or with (shaded bars) 0.125 mm octanoate and other additions as shown, and incubation was for 2 h. Metformin (100 μm) and GPi (20 μm) were present during both preincubation and final incubation, and AOA (200 μm) was present only in the final incubation. A and G, glucose production; B and H, pyruvate + lactate production; C and I, total production of glucose + pyruvate + lactate, expressed as C3 units; D and J, glucose percentage of total metabolism; E and K, lactate/pyruvate ratio; F and L, cell G3P. Results are means ± S.D. (error bars) for n = 6–9 (A–F) or 5–7 (G–L) hepatocyte preparations. *, p < 0.05 relative to respective control; $, p < 0.05 octanoate effect.
GPi (STK017597) but not metformin inhibits endogenous mGPDH activity in hepatocytes
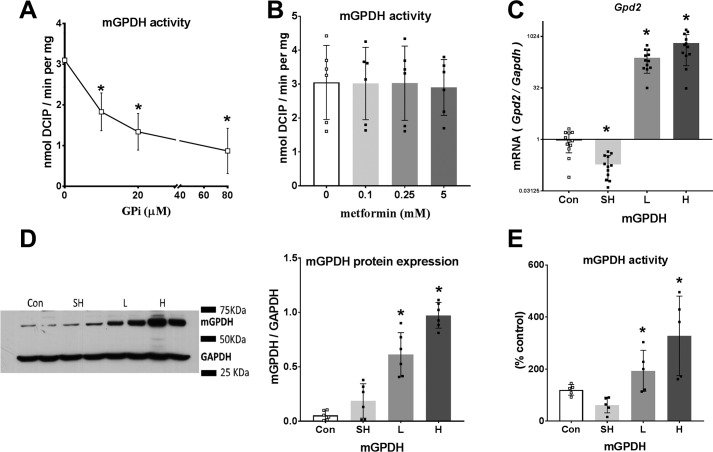
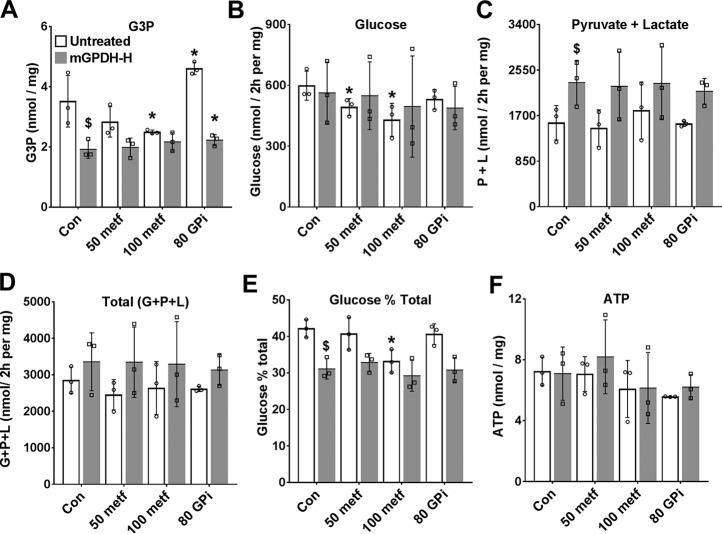
The greater effect of the MA-shuttle inhibitor (AOA) compared with the mGPDH inhibitor (GPi, STK017597) on the lactate/pyruvate ratio could be due to either a greater contribution of the MA-shuttle compared with the GP-shuttle to transfer of reducing equivalents from the cytoplasm to mitochondria or to poor efficacy or cellular uptake of GPi by hepatocytes. We next tested the effects of the GPi and metformin on mGPDH activity in permeabilized hepatocytes using the electron acceptor dichlorophenol indophenol (31) and confirmed inhibition of mGPDH activity by 10–80 μm GPi (Fig. 4A) as reported previously (28), but not with metformin at 0.1–5 mm (Fig. 4B). Although STK017597 is a potent mGPDH inhibitor in permeabilized hepatocytes, it may be ineffective in the intact hepatocytes because of slow transport or low functional GP-shuttle activity. In additional experiments with 80 μm GPi in hepatocytes that were either untreated or treated with an adenoviral vector to overexpress mGPDH (Fig. 5), there was an increase in G3P with 80 μm GPi in the untreated hepatocytes consistent with endogenous functional mGPDH activity (Fig. 5A). However, partitioning of DHA to glucose was not inhibited by 80 μm GP (Fig. 5, B–E).
Figure 4.
Endogenous mGPDH activity and effects of GPi and metformin. A and B, activity of endogenous mGPDH assayed in permeabilized hepatocytes with the concentrations of GPi (A) or metformin (B) indicated. C–E, hepatocytes were either untreated (Con) or treated with 8 × 10⁸ pfu/ml Adv-SH-mGpd2 (SH) for Gpd2 knockdown or with Adv-mGpd2 at 1.6 (L) or 4.8 (H) × 107 pfu/ml for mGPDH overexpression. C, Gpd2/Gapdh mRNA expressed relative to untreated control. D, immunoactivity of mGPDH/GAPDH. E, mGPDH enzyme activity. Results are means ± S.D. (error bars) for n = 6–12 (A and B) or 5–6 (C–E) experiments. *, p < 0.05 relative to control.
Figure 5.
The mGPDH inhibitor raises cell G3P but does not mimic metformin. Mouse hepatocytes were either untreated or treated with Adv-mGpd2 at 4.8 × 10⁷ pfu/ml (mGPDH-H) for overexpression of mGPDH as in Fig. 4. After overnight culture, they were incubated for 2 h in glucose-free DMEM with 50 or 100 μm metformin or with 80 μm GPi (STK017597), as indicated. They were then incubated in fresh medium containing 5 mm DHA and the same metformin and GPi concentrations for determination of glucose, pyruvate, and lactate production. A, cell G3P; B, glucose production; C, pyruvate + lactate production; D, total production of glucose, pyruvate, and lactate (C3 units); E, glucose percentage of total metabolism; F, cell ATP. Results are means ± S.D. (error bars) for three hepatocyte preparations. *, p < 0.05 relative to respective control; $, < 0.05 effect of mGPDH overexpression.
Overexpression of mGPDH lowers cell G3P and promotes a more reduced mitochondrial NADH/NAD ratio and increased glycolysis
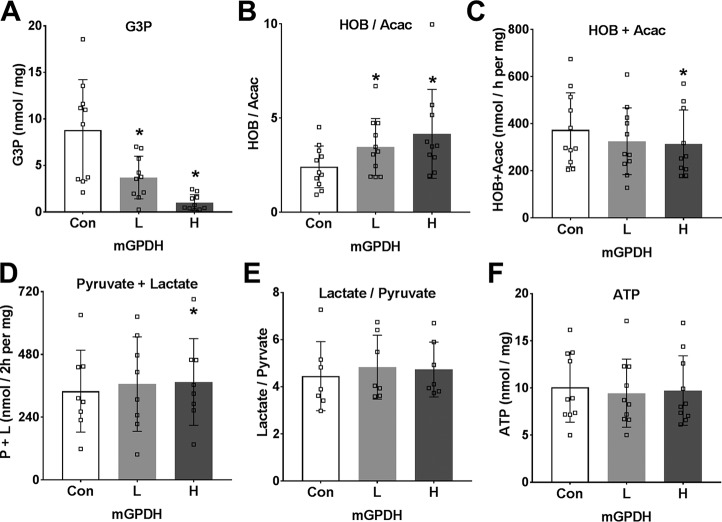
To further test the role of the GP-shuttle in glycolysis and gluconeogenesis, we used adenoviral vectors for overexpression of mGPDH or shRNA knockdown in mouse hepatocytes and confirmed an increase or decrease, respectively, in Gpd2 mRNA after 24 h (Fig. 4C). We also confirmed overexpression of mGPDH protein by immunoblotting and the activity assay with two adenoviral titers (Fig. 4, D and E), but there was little suppression of mGPDH activity by shRNA knockdown, presumably because of the long half-life of mGPDH protein (21). We therefore used two levels of mGPDH overexpression (as in Fig. 4, D and E) for metabolic studies (Fig. 6–8). With 25 mm glucose and octanoate as substrates, mGPDH overexpression was associated with lower levels of cell G3P (Fig. 6A) and with a more reduced mitochondrial NADH/NAD redox state (Fig. 6B), but decreased production of ketone bodies (Fig. 6C) and thereby β-oxidation of octanoate. The production of lactate and pyruvate was slightly raised (Fig. 6D) with negligible change in the lactate/pyruvate ratio (Fig. 6E). The more reduced mitochondrial NADH/NAD redox state in conjunction with lower cell G3P confirms that overexpressed mGPDH is appropriately targeted to the mitochondrial membrane and is functional such that G3P oxidation is associated with transfer of reducing equivalents to mitochondria and presumably reversed electron transport, resulting in both a raised NADH/NAD and suppression of β-oxidation. Inhibition of the MA-shuttle with AOA, unlike overexpression of mGPDH, had a negligible effect on the mitochondrial redox state, but it counteracted and reversed the effect of low metformin on the mitochondrial redox state (Fig. 1, I and J).
Figure 6.
Overexpression of mGPDH in hepatocytes promotes lower G3P, a reduced mitochondrial NADH/NAD redox state, and increased glycolysis. Mouse hepatocytes were either untreated (Con) or treated with low (L) and high (H) titers of Adv-Gpd2 for overexpression of mGPDH as in Fig. 4. After a 20-h culture to allow protein overexpression, they were incubated for 1 h in MEM containing 25 mm glucose and 0.125 mm octanoate. A, G3P; B and C, 3-hydroxybutyrate/acetoacetate ratio and total 3-hydroxybutyrate + acetoacetate production; D and E, pyruvate and lactate production and lactate/pyruvate ratio; F, cell ATP. Results are means ± S.D. (error bars) for n = 7–11. *, p < 0.05 relative to untreated control.
Figure 7.
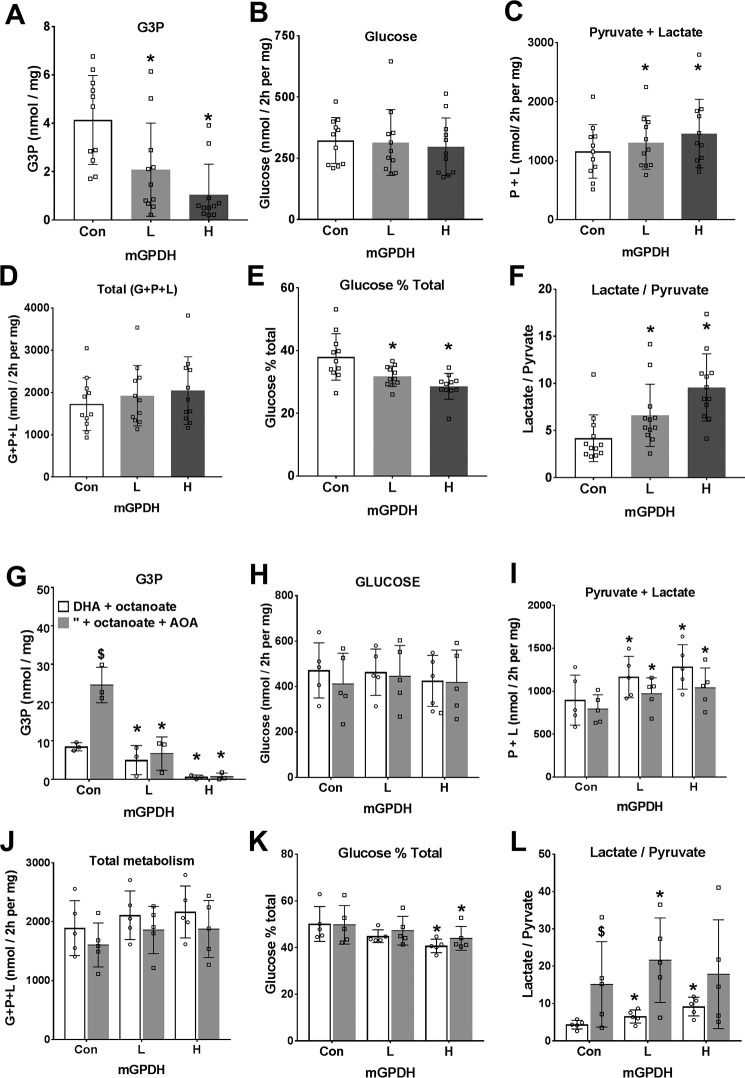
Overexpression of mGPDH favors metabolism of dihydroxyacetone to pyruvate and lactate rather than glucose. Mouse hepatocytes were either untreated or treated for overexpression of mGPDH (L and H) as in Figs. 4 and 5. After a 20-h culture, they were incubated for 2 h in glucose-free DMEM containing either 5 mm DHA (A–F) or 5 mm DHA and 0.125 mm octanoate (G–L) without (open bar) or with (shaded bar) 200 μm AOA. A and G, cell G3P; B and H, glucose production; C and I, pyruvate + lactate; D and J, total production of glucose + pyruvate + lactate expressed as C3 units; E and K, glucose percentage of total metabolism; F and L, lactate/pyruvate ratio. Results are means ± S.D. (error bars) for n = 11–12 (A–F) or n = 3–5 (G–L). *, p < 0.05, effect of mGPDH overexpression; $, p < 0.05, effect of AOA.
Figure 8.
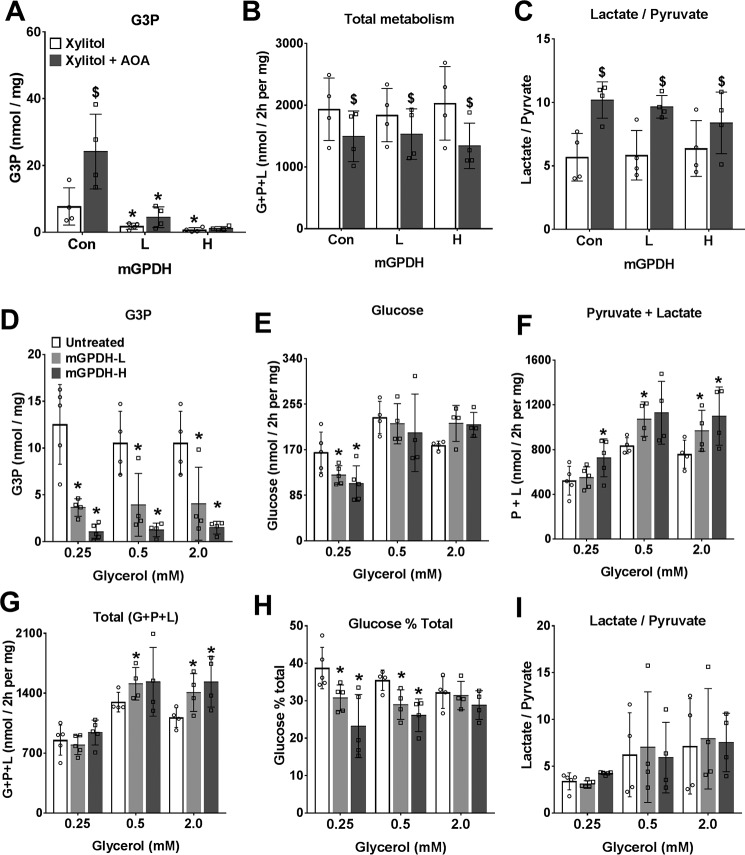
Overexpression of mGPDH favors increased glycerol but not xylitol metabolism. Mouse hepatocytes were either untreated or treated for overexpression of mGPDH (L and H) as in Fig. 4 and cultured for 20 h, followed by a 2-h incubation in glucose-free DMEM. A–C, medium contained 2 mm xylitol without (open bars) or with (shaded bars) 200 μm AOA. A, cell G3P; B, total production of glucose + pyruvate + lactate expressed as C3 units; C, lactate/pyruvate ratio. D–I, medium contained glycerol at either 0.25, 0.5, or 2 mm. D, cell G3P; E, glucose production; F, pyruvate + lactate; G, total production of glucose + pyruvate + lactate (C3 units); H, glucose percentage of total metabolism; I, lactate/pyruvate ratio. Results are means ± S.D. (error bars) for n = 4–5; *, p < 0.05, effect of mGPDH overexpression (A–I); $, p < 0.05, effect of AOA (A–C).
Overexpression of mGPDH promotes DHA metabolism to glycolysis rather than glucose and does not increase xylitol metabolism
A role for mGPDH in the control of gluconeogenesis has previously been inferred from lower blood glucose in some mouse models of Gpd2 deficiency (19, 20, 32–34) and from association studies in hepatocytes from rodents with altered thyroid hormone signaling and raised mGPDH activity (35). In the latter study (35), mGPDH was one of a number of genes showing altered expression with thyroid status. To test the specific role of mGPDH in control of gluconeogenesis, we determined the effects of mGPDH overexpression on rates of glucose production from oxidized and reduced substrates. With DHA as substrate (Fig. 7, A–F), overexpression of mGPDH was associated with lower cell G3P and increased production of pyruvate plus lactate but not glucose or total DHA metabolism and accordingly with decreased partitioning of DHA to glucose (Fig. 7, A–E). This was associated with a raised lactate/pyruvate ratio (Fig. 7F). Likewise, with DHA plus octanoate in incubations without or with AOA, to inhibit the MA-shuttle (Fig. 7, G–L), there was also lowering of G3P and increased production of pyruvate plus lactate and decreased partitioning of DHA to glucose with mGPDH overexpression. With xylitol as substrate and without or with AOA to inhibit the MA-shuttle (Fig. 8, A–C), both cell G3P and the lactate/pyruvate ratio were markedly elevated by MA-shuttle inhibitor, and total xylitol metabolism was inhibited, indicating an essential role for the MA-shuttle in regenerating NAD consumed by xylitol oxidation to xylulose. Overexpression of mGPDH markedly lowered cell G3P but did not reverse the AOA effect on total xylitol metabolism and had a negligible effect on the lactate/pyruvate ratio (Fig. 8, A–C).
Overexpression of mGPDH increases total metabolism of glycerol
We next determined the effects of mGPDH overexpression on glycerol metabolism (Fig. 8, D–I). Cell G3P was markedly lowered, and total glycerol metabolism to glucose, pyruvate, and lactate was increased mainly as a result of an increase in pyruvate and lactate production (Fig. 8, D–G). Increased mGPDH activity favored increased glycerol metabolism by preferential partitioning to glycolysis relative to glucose (Fig. 8H). Cumulatively, overexpression of mGPDH caused a marked decrease in cell G3P with all substrates tested (glucose, DHA, xylitol, and glycerol) (Figs. 6–8) and a more reduced mitochondrial NADH/NAD state (Fig. 6). With DHA as substrate, the effects of mGPDH overexpression (Fig. 7) mimicked the effect of metformin (Fig. 3) in favoring partitioning to glycolysis relative to glucose.
Metformin inhibition of gluconeogenesis from DHA is abolished by allosteric targeting at PFK1 and FBP1
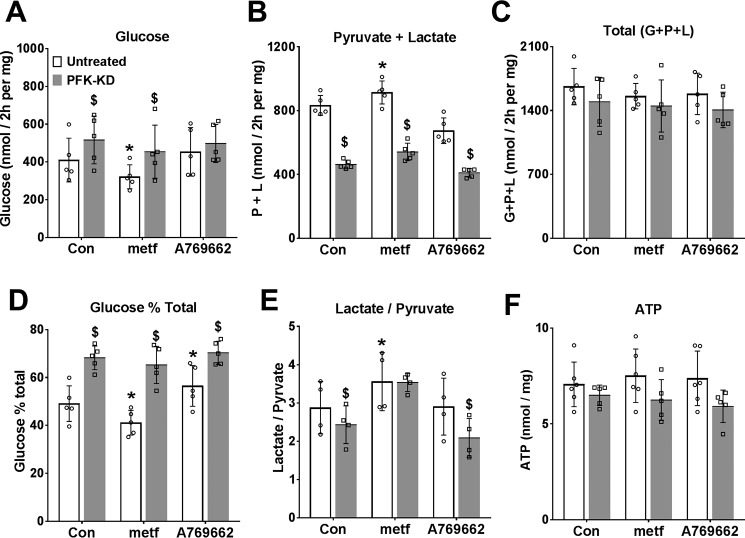
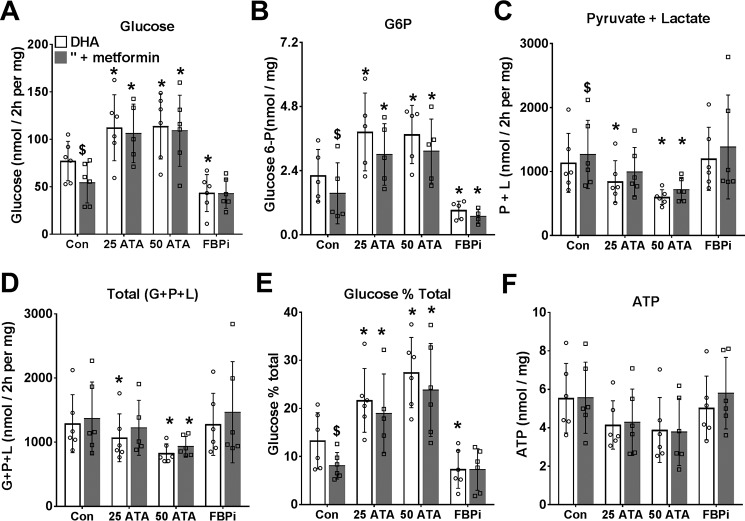
The above studies suggest that the metformin inhibition of glucose production from DHA and xylitol (Fig. 3), which occurs in conjunction with lowering of cell G3P is not mimicked by inhibition of either the MA-shuttle (Fig. 3) or the GP-shuttle (Fig. 5). We next considered allosteric regulation at PFK1 and/or FBP1 as a candidate mechanism for the effect of low metformin on glycolysis and gluconeogenesis because previous work showed that the inhibition of glycolysis by octanoate is in part explained by raised citrate, a potent inhibitor of PFK1 (36, 37). To test for regulation at PFK1 or FBP1, we expressed a kinase-deficient variant (PFK-KD) of the bifunctional enzyme PFK2/FBP2, which depletes cell fructose 2,6-P2 (38), a potent activator of PFK1 and inhibitor of FBP1 (39), and we compared metformin (100 μm) with the activator of AMPK (A-769662, 10 μm) in cells that were either untreated or depleted of fructose 2,6-P2 (Fig. 9, open versus shaded bars). Depletion of fructose 2,6-P2 (with Adv-PFK-KD) increased glucose production and decreased glycolysis consistent with decreased PFK1 and increased FBP1 activity (39). In untreated cells, metformin (100 μm) and A-769662 had opposite effects (inhibition and stimulation, respectively) on relative partitioning of DHA to glucose (Fig. 9, A–D). These effects of metformin and A-769662 were attenuated by fructose 2,6-P2 depletion (Fig. 9, shaded bars). Cumulatively, this shows that the metformin effect is not mimicked by activation of AMPK and is attenuated by depletion of fructose 2,6-P2, an allosteric regulator of both PFK1 and FBP1. We next used an inhibitor of FBP1 that binds to the AMP site (40) and a citrate analogue inhibitor of PFK1 (aurintricarboxylic acid (ATA)), which antagonizes activation of PFK1 by AMP and fructose 2,6-P2 (41), to selectively target FBP1 or PFK1 (Fig. 10). For these studies, we used the chlorogenic acid derivative, S4048 (200 nm), which is a selective inhibitor of the G6P transporter Slc37a4 (42), to raise cell G6P, which is otherwise below detection limits in hepatocytes incubated in glucose-free medium. The FBP1 inhibitor lowered glucose production from DHA and cell G6P, whereas the PFK1 inhibitor raised glucose production and G6P (Fig. 10, A and B). The PFK1 inhibitor caused partitioning of substrate toward glucose despite attenuation of total DHA metabolism (Fig. 10, C–E). The inhibition of gluconeogenesis and the lowering of cell G6P by metformin were abolished by the PFK1 and FBP1 inhibitors (Fig. 10, A and B). Cumulatively, this points to a significant contribution of allosteric control of PFK1 and FBP1 in the partitioning of DHA metabolism between glycolysis and gluconeogenesis and in the metformin inhibition of glucose production.
Figure 9.
Comparison of metformin and an AMPK activator on DHA metabolism in cells depleted of fructose 2,6-P2. Mouse hepatocytes were either untreated (open bars) or treated (filled bars) with an adenoviral vector for expression of PFK-KD to deplete cell fructose 2,6-P2 (38). After a 20-h culture, they were preincubated for 2 h in glucose-free medium with 100 μm metformin or 10 μm A-769662. They were then incubated for 2 h in fresh medium containing 5 mm DHA. A, glucose production; B, pyruvate + lactate production; C, total production of glucose + pyruvate + lactate (C3 units); D, glucose percentage of total metabolism; E, lactate/pyruvate ratio; F, cell ATP. Results are means ± S.D. (error bars) for n = 4–6; *, p < 0.05, relative to respective control; $, effect of PFK-KD.
Figure 10.
Metformin inhibition of gluconeogenesis from DHA is abolished by inhibitors of PFK1 or FBP1. Mouse hepatocytes were incubated for 2 h in glucose-free DMEM without (open bars) or with (shaded bars) 100 μm metformin and then for 2 h in fresh medium containing 5 mm DHA + 200 nm S4048 and other additions as indicated: ATA at 25 or 50 μm and FBPi at 5 μm. A, glucose production; B, cell glucose 6-P; C, pyruvate + lactate production; D, total production of glucose + pyruvate + lactate, as C3 units; E, glucose percentage of total metabolism; F, cell ATP. Results are means ± S.D. (error bars) for n = 5–6. *, p < 0.05 relative to respective control; $, p < 0.05 metformin effect.
Discussion
Although metformin has been used for type 2 diabetes therapy for several decades (1, 2), the mechanisms by which it inhibits hepatic gluconeogenesis remain debated (4–20). Two contentious issues are 1) what metformin exposure in cellular models is the equivalent of therapeutic exposure in human diabetes (1, 5, 18) and 2) whether the acute inhibition of gluconeogenesis is explained by compromised energy status via inhibition of Complex 1 (9–18) or by a redox-dependent mechanism through inhibition of mGPDH and thereby the GP-shuttle (19, 20).
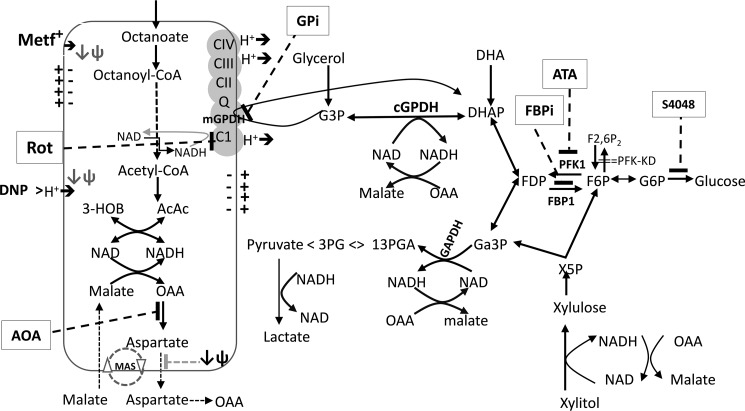
The MA-shuttle and the GP-shuttle together with production of lactate by lactate dehydrogenase are the three major mechanisms in liver that lead to the regeneration of NAD that is consumed in glycolysis (Fig. 11). Flux through the GP-shuttle is determined by the activity of mGPDH, which is expressed at relatively low levels in liver compared with brain, muscle, and thermogenic brown adipose tissue (21). Nonetheless, it is adaptively regulated in liver by thyroid and steroid hormone status, and it is also allosterically regulated by Ca2+ (21). Altered activity of mGPDH could therefore result in variable contribution of this shuttle to the cytoplasmic and mitochondrial redox state. Mice with selective disruption of either the GP-shuttle by knockdown of mGPDH or the MA-shuttle by knockdown of citrin, the electrogenic aspartate transporter, have a modest phenotype with respect to fasting blood glucose (32–34), although with a greater role of the MA-shuttle compared with the GP-shuttle in lowering blood glucose (34). However, combined knockdown of both mGPDH and citrin resulted in significant disruption of blood glucose and glycerol levels, indicating that both shuttles can mutually compensate when either shuttle is genetically deleted (34). In the present study, we used inhibitors of the MA-shuttle and GP-shuttle, and we overexpressed mGPDH to explore the role of these shuttles in the maintenance of cytoplasmic and mitochondrial NADH/NAD redox state and metabolism of oxidized and reduced substrates. We show that inhibition of the MA-shuttle causes a more reduced cytoplasmic redox state but with negligible effect on the mitochondrial redox state, whereas overexpression of mGPDH causes a more reduced mitochondrial redox state, but with variable effects on the lactate/pyruvate ratio, depending on the substrate conditions. We used a metformin concentration and exposure time in hepatocytes that result in cellular metformin levels (1–2 nmol/mg) (23) that are attained in the mouse liver after an oral metformin dose equivalent to the therapeutic dose (50 mg/kg or 3 g/60 kg) (24). Two key findings from the present study are, first, that low metformin promotes a decrease in the 3-hydroxybutyrate/acetoacetate ratio (more oxidized mitochondrial NADH/NAD) but an increase in lactate/pyruvate ratio (more reduced cytoplasmic NADH/NAD) as with a low dose of metformin in vivo in the liver (19, 20) and kidney (43, 44) and, second, that low metformin inhibits gluconeogenesis from oxidized and reduced substrates by preferential partitioning to glycolysis and with concomitant lowering of cell G3P. This inhibition of gluconeogenesis cannot be explained by inhibition of either the MA-shuttle or the GP-shuttle and is best explained by allosteric regulation at the level of PFK1 and FBP1. These two effects of metformin are discussed separately.
Figure 11.
Substrate and inhibitor effects on the NADH/NAD redox state. Octanoate is metabolized in mitochondria by β-oxidation, generating NADH and FADH, which are oxidized in the electron transport chain, and the final end products: Acac and HOB. The ratio of HOB/Acac reflects the mitochondrial NADH/NAD redox state. It is increased by high metformin and rotenone (Complex I inhibitor) and decreased by low metformin and uncoupler, DNP (Fig. 1). It is increased by overexpression of mGPDH, which catalyzes oxidation of G3P with transfer of electrons to the respiratory chain (Fig. 6). DHA is metabolized to either glucose or pyruvate. The latter results in production of NADH (at GAPDH), which is coupled to either formation of lactate by lactate dehydrogenase or malate, which is oxidized in mitochondria by the malate–aspartate shuttle (MAS) (Figs. 3 and 7). Xylitol metabolism generates NADH during oxidation to xylulose and at GAPDH during formation of pyruvate (Figs. 3 and 8). Glycerol metabolism generates G3P, which is converted to DHAP (dihydroxyacetone phosphate) by either mGPDH, with transfer of electrons to the respiratory chain, or by cGPDH (cytoplasmic glycerol-3-phosphate dehydrogenase), generating NADH in the cytoplasm, which reoxidized via the MA-shuttle (Fig. 8). AOA inhibits the MA-shuttle at the transaminase reaction, increases the lactate/pyruvate ratio and G3P, and inhibits total xylitol metabolism (Figs. 3, 7, and 8). The MA-shuttle is also inhibited at the aspartate transport step by mitochondrial depolarization (↓ψ). GPi (80 μm, mGPDH inhibitor) increases G3P (Fig. 5). mGPDH overexpression lowers G3P, increases total glycerol metabolism, and favors DHA metabolism to pyruvate and lactate relative to glucose (Figs. 6–8). Octanoate, ATA (PFK1 inhibitor), and fructose 2,6-P2 depletion promote DHA metabolism to glucose relative to pyruvate and lactate (Figs. 9 and 10). Metformin (100 μm or <2 nmol/mg of cell protein) promotes decreased DHA metabolism to glucose relative to pyruvate plus lactate and moderately increases the lactate/pyruvate ratio and decreases cell G3P (Figs. 3, 5, 9, and 10). It lowers G6P in conditions of restrained G6P entry into the endoplasmic reticulum with a transport inhibitor, S4048 (Fig. 10).
The increase in lactate/pyruvate ratio is probably the most widely documented effect of metformin in vivo (19, 20, 43) and in vitro (9–12, 14). Although an increase in lactate/pyruvate ratio by a high metformin dose is frequently attributed to inhibition of Complex I and thereby the respiratory chain, the increase by low metformin in conjunction with a more oxidized mitochondrial NADH/NAD state requires other explanations. One possible explanation for this is inhibition of mGPDH (19, 20). However, in this study, cell G3P, the substrate of mGPDH, was lowered by metformin and by mGPDH overexpression and was increased with the mGPDH inhibitor. This does not support a role for inhibition of GP-shuttle activity by metformin, and accordingly, other explanations need to be considered for the increase in lactate/pyruvate ratio by low metformin. Flux through the MA-shuttle involves an electrogenic transporter for aspartate and is highly dependent on mitochondrial membrane potential (45–48). The most plausible explanation for the increase in lactate/pyruvate ratio by low metformin is that it results from accumulation of metformin in mitochondria with consequent mitochondrial depolarization (9, 49) and inhibition of the MA-shuttle (45–48) through attenuation of electrogenic transport (Fig. 11). The biphasic effect of metformin on the ratio of 3-hydroxybutyrate/acetoacetate in hepatocytes suggests that metformin inhibits Complex I at the higher concentration, which corresponds to a cell load of ≥5 nmol of metformin/mg of cell protein but not at 100 μm, which corresponds to ≤2 nmol of metformin/mg of protein. A key question is the mechanism for the oxidized mitochondrial NADH/NAD state by low metformin. Detailed studies by Bridges et al. (13) on the effects of metformin on the sequential reactions of complex 1 (NADH oxidation, electron transfer, and ubiquinone reduction) showed that metformin interacts with at least two sites, the flavin site and the ubiquinone site. Metformin activates the first reaction, NADH oxidation, when this is coupled to the artificial electron acceptor FeCN, but it inhibits reversibly at the ubiquinone site by a distinct mechanism from canonical Complex I inhibitors (e.g. rotenone), which bind irreversibly. Whether low metformin concentrations (below the threshold for inhibition of the ubiquinone site) could lower the NADH/NAD ratio through metformin's effect at the flavin site is speculative because the rate constant for NADH oxidation is far higher than for ubiquinone reduction (50). A simpler explanation is that depolarization of the mitochondria by metformin accumulation in mitochondria accounts for the lower NADH/NAD ratio by increased flux through Complex I, as occurs during depolarization with the uncoupler dinitrophenol, because flux through Complex 1 is impeded by the proton motive force. Accordingly, mitochondrial depolarization by metformin accumulation could in principle account for both the oxidized mitochondrial redox state and the reduced cytoplasmic redox state.
We show in this study that the inhibition of gluconeogenesis by the low dose of metformin cannot be explained by either inhibition of Complex 1 (because of the more oxidized mitochondrial redox state) or activation of AMPK (because AMPK activation has the converse effect on DHA metabolism from metformin) or by inhibition of transfer of reducing equivalents from the cytoplasm to the mitochondria because inhibition of these shuttles does not mimic metformin on DHA metabolism. Based on the large effects of the inhibitors of PFK1 and FBP1 or of depletion of fructose 2,6-P2, the allosteric regulator of both PFK1 and FBP1 that acts synergistically with other effectors (39), on the directionality of flux between glycolysis versus gluconeogenesis and also the attenuation of the metformin effect by these inhibitors, we propose that allosteric regulation at the level of PFK1 and FBP1 is the most plausible explanation for the metformin effect on gluconeogenesis and glycolysis. FBP1 is regulated synergistically by AMP and fructose 2,6-P2, and PFK1 is regulated by multiple positive effectors (e.g. AMP, fructose 2,6-P2, fructose 1,6-P2, glucose 1,6-P2, and Pi) and negative effectors (ATP, citrate, G3P) (39). If the increase in the lactate/pyruvate ratio by low metformin is consequent to mitochondrial depolarization and inhibition of the electrogenic transporter of the MA-shuttle (45–48), then other electrogenic transport mechanisms would likewise be expected to be attenuated. One such mechanism is the adenine nucleotide transporter, which exchanges ADP3− on the cytoplasmic side for ATP4− on the mitochondrial side (51, 52). An increase in the cytoplasmic ADP/ATP ratio would be expected to result from mitochondrial depolarization. Other allosteric effectors of PFK1 that may contribute to stimulation of glycolysis include citrate, which is a potent PFK1 inhibitor and has been shown to be lowered by metformin treatment in some models of diabetes (53), and G3P, which is a potent inhibitor of PFK1 (54). In this study, cell G3P was decreased by low metformin in conditions of raised glycolysis and decreased gluconeogenesis, and likewise G3P was decreased in cells overexpressing mGPDH, which showed similar partitioning of DHA toward glycolysis as with metformin. The lowering of cell G3P by metformin in conditions of raised lactate/pyruvate ratio may result from increased flux through the GP-shuttle in conditions of impaired MA-shuttle flux because of mitochondrial depolarization. The more reduced mitochondrial redox state by metformin in the presence of the MA-shuttle inhibitor supports this explanation. Cumulatively, this supports the conclusion that low metformin concentrations that do not inhibit Complex I can inhibit gluconeogenesis by a redox-independent mechanism through allosteric regulation of PFK1 and FBP1 in conjunction with lowering of cell G3P and an increase in lactate/pyruvate ratio. The latter effects may be due to altered flux through the MA-shuttle and GP-shuttle (inhibition and stimulation, respectively).
Experimental procedures
Reagents
STK017597 (GPI), an inhibitor of mGPDH (28) was from the Vitas-M Laboratory; A-769662 was from Tocris Biosciences; and the FBP1 inhibitor, 5-chloro-2-[N-(2,5dichlorobenzene sulfonamide)]-benzoxazole (40), was from Calbiochem/Santa Cruz Biotechnology, Inc. S4048, the chlorogenic acid derivative (1-[2-(4-chloro-phenyl)-cyclopropylmethoxy]-3,4-dihydroxy-5-(3-imidazo[4,5-b]pyridin-1-yl-3-phenyl-acryloyloxy)-cyclohexanecarboxylic acid) (42) was a kind gift from Sanofi-Aventis. All other reagents were from Sigma.
Adenoviral vectors
Adenoviral vectors for overexpression of mouse mGPDH (Ad-m-Gpd2, ADV-279685; RefSeq BC021359) and for sh-RNA knockdown (ADV-m-Gpd2-shRNA, shADV-279685; RefSeq NM-010274) were generated by Vector Biolabs (Malvern, PA). The adenoviral vector for expression of a kinase-deficient variant of PFKFB1 (S32D/T55V) denoted by PFK-KD (for a bisphosphatase-active kinase-deficient variant of 6-phosphofructo-2-kinase-fructose-2,6-bisphosphatase) was described previously (38).
Hepatocyte isolation and culture
The animal studies were approved by the Newcastle University Ethics Committee (Review Board) and by the United Kingdom Home Office Animal Scientific Procedures Act (1986) (Project License PPL60/4321; PC1B783F4). Hepatocytes were isolated by collagenase perfusion of the liver either from adult male Wistar rats (200–280 g body weight) or from adult male C57BL/6JOlaHsd mice (20–30 g body weight) obtained from Harlan/Envigo (Bicester, UK). Unless otherwise indicated, mouse hepatocytes were used. Rats and mice were housed in environmental conditions as outlined in the Home Office Code of Practice. Procedures conformed to Home Office regulations and were approved by the Newcastle University Ethics Committee. Rat hepatocytes were isolated as described previously (38). For mouse hepatocyte isolation, euthanasia was by isoflurane overdose followed by heparin injection and laparotomy. The liver was perfused at 5 ml/min for 5 min with calcium-free Hanks' buffer followed by 20 min with Hanks' buffer containing 0.1 mg/ml collagenase (Sigma, C5138). After sedimentation at 50 × g, the hepatocytes were suspended in minimum essential medium (MEM, Life Technologies, Inc., 21430) supplemented with 5% (v/v) newborn calf serum and 10 nm dexamethasone and 10 nm insulin and seeded on gelatin-coated (0.1%, w/v) multiwell plates. After cell attachment, the medium was replaced by serum-free MEM containing 5 mm glucose, 10 nm dexamethasone, 1 nm insulin, and the hepatocytes were cultured overnight (∼16–20 h).
Treatment with adenoviral vectors
For protein overexpression 2 h after cell attachment, the serum-containing medium was replaced by serum-free MEM containing Ad-m-Gpd2 (ADV-279685; Ref Seq BC021359, Vector Biolabs) at titers of 1.6 and 4.8 × 10⁷ pfu/ml for overexpression of mouse mGPDH or with PFK-KD for expression of a kinase-deficient variant of PFK2/FBP2 (Pfkfb1: S32D/T55V) for depletion of fructose 2,6-P2 (38). After 4 h, the medium was replaced by serum-free MEM containing 10 nm dexamethasone and 1 nm insulin, and the hepatocytes were cultured for 18–20 h.
Hepatocyte incubations with metformin
All experiments with metformin were performed after 16–20-h culture with the exception of Fig. 1 (G–J), which was started 3 h after cell plating. The hepatocyte monolayers were preincubated with metformin for 2 h with either MEM containing 5 mm glucose or glucose-free DMEM (Life Technologies, A14430). After 2 h, the medium was replaced by fresh MEM or glucose-free DMEM with the same metformin concentrations and other substrates (e.g. octanoate and gluconeogenic precursors) as indicated for either 1 h (acetoacetate + 3-hydroxybutyrate) or 2 h (glucose production studies). Upon termination of the incubations, the medium was collected for determination of acetoacetate, 3-hydroxybutyrate, lactate, pyruvate, and glucose, and the hepatocyte monolayers were snap-frozen in liquid nitrogen and stored at −80 °C until analysis.
Metabolite assays
For determination of ketone bodies and pyruvate, the medium was acidified with 0.2 volume of 0.6 m HClO4. Acetoacetate and 3-hydroxybutyrate were assayed using 3-hydroxybutyrate dehydrogenase, and pyruvate and lactate were assayed using lactate dehydrogenase from the change in NADH fluorescence (excitation, 340 nm; emission, 460 nm) as described previously (55). Ketone body production is expressed as nmol/h/mg of protein (mouse hepatocytes) or as percentage of control (rat hepatocytes; Fig. 1, D–F). Glucose was determined by the hexokinase, glucose 6-phosphate dehydrogenase–coupled assay (56). Production of pyruvate plus lactate or glucose is expressed as nmol/2 h/mg of protein, and glucose production is also expressed as a percentage of total production of pyruvate + lactate + glucose (expressed as C3 units). For determination of cell ATP, G3P, and G6P, the hepatocyte monolayers were extracted 2.5% (w/v) 5-sulfosalicylic acid and deproteinized by sedimentation at 10,000 × g, 10 min. The supernatant was neutralized with 1 m KOH, 0.66 m K2HPO4, and cell ATP was determined by a luciferase-coupled luminometric method (Sigma FLAA). G6P and G3P were assayed using glucose-6-phosphate dehydrogenase and glycerol-3-phosphate dehydrogenase, respectively, by coupling to resazurin conversion to resorufin with diaphorase (excitation, 530 nm; emission, 590 nm) (30). Standards for the assays were prepared fresh in culture medium or 2.5% 5-sulfosalicylic acid, and concentrations were determined from standard curves and expressed as nmol/mg protein determined by the Lowry assay.
Activity of mGPDH
Activity of mGPDH was determined on hepatocyte monolayers that were snap-frozen in liquid nitrogen and stored at −80 °C until analysis. The assay medium contained 200 mm sucrose, 50 mm KPi, pH 7.6, 200 μm 2,6-dichlorophenolindophenol, and 25 mm dl-G3P, and activity was determined from the decrease in absorbance at 600 nm using an extinction coefficient (E600) of 21,000 cm2/mmol (31).
Western blotting
Immunoactivity to mouse mGPDH (Proteintech, 17219-1Ap), GAPDH (Hytest, ABIN153387), and ACC-Ser(P)-79 (Cell Signaling, 11818) was determined by SDS-PAGE using 8% (ACC) or 12% (Gpd2) SDS and immunoblotting. Protein bands on PVDF were visualized by enhanced chemiluminescence (Pierce) and exposure to medical film (Agfa Healthcare), and protein bands were imaged by BioRad GS-800 Software.
RNA analysis
RNA was extracted with TRIzol, and cDNA was synthesized by Moloney murine leukemia virus. The primers used for real-time RT-PCR were as follows: Gpd2, ACTACCTGAGTTCTGACGTTGAAG (forward) and TAACAAGGGGACGGATACCA (reverse); Gapdh, GACAATGAATACGGCTACAGCA (forward) and GGC CTC TCT TGCTCAGTGTC (reverse).
Statistical analysis
Results for all data sets other than in Fig. 2 are expressed as means ± S.D. for the number of hepatocyte preparations indicated, and statistical analysis was either by Student's paired t test or by one-way analysis of variance. For Fig. 2, the data represent replicate incubations in a single hepatocyte preparation.
Author contributions
A. A. and L. A. designed the experiments. A. A. performed the experiments and the analysis. L. A. with A. A. wrote the paper.
Acknowledgment
We are very grateful to Dr. Judy Hirst for advice on the manuscript.
The authors declare that they have no conflicts of interest with the contents of this article.
- AMPK
- AMP-activated protein kinase
- AOA
- aminooxyacetate
- DHA
- dihydroxyacetone
- FBP1
- fructose 1,6-bisphosphatase
- FBPi
- inhibitor of FBP1, 5-chloro-2-[N-(2,5-dichlorobenzenesulfonamide)]-benzoxazole
- G3P
- glycerol 3-phosphate
- G6P
- glucose 6-phosphate
- GPi
- inhibitor of mGPDH (ID STK017597)
- GP-shuttle
- glycerophosphate shuttle
- MA-shuttle
- malate–aspartate shuttle
- mGPDH
- mitochondrial FAD-dependent glycerol-3-phosphate dehydrogenase
- PFK1
- 6-phosphofructo-1-kinase
- PFK2/FBP2
- 6-phosphofructose-2-kinase/fructose 2,6-bisphosphatase
- PFK-KD
- PFK2/FBP2 kinase-deficient variant
- DNP
- dinitrophenol
- ACC
- acetyl-CoA carboxylase
- P2
- bisphosphate
- MEM
- minimum Eagle's medium
- ATA
- aurintricarboxylic acid
- Acac
- acetoacetate
- HOB
- d-3-hydroxybutyrate.
References
- 1. Bailey C. J. (2017) Metformin: historical overview. Diabetologia 60, 1566–1576 10.1007/s00125-017-4318-z [DOI] [PubMed] [Google Scholar]
- 2. Natali A., and Ferrannini E. (2006) Effects of metformin and thiazolidinediones on suppression of hepatic glucose production and stimulation of glucose uptake in type 2 diabetes: a systematic review. Diabetologia 49, 434–441 10.1007/s00125-006-0141-7 [DOI] [PubMed] [Google Scholar]
- 3. Heishi M., Ichihara J., Teramoto R., Itakura Y., Hayashi K., Ishikawa H., Gomi H., Sakai J., Kanaoka M., Taiji M., and Kimura T. (2006) Global gene expression analysis in liver of obese diabetic db/db mice treated with metformin. Diabetologia. 49, 1647–1655 10.1007/s00125-006-0271-y [DOI] [PubMed] [Google Scholar]
- 4. Cao J., Meng S., Chang E., Beckwith-Fickas K., Xiong L., Cole R. N., Radovick S., Wondisford F. E., and He L. (2014) Low concentrations of metformin suppress glucose production in hepatocytes through AMP-activated protein kinase (AMPK). J. Biol. Chem. 289, 20435–20446 10.1074/jbc.M114.567271 [DOI] [PMC free article] [PubMed] [Google Scholar]
- 5. He L., and Wondisford F. E. (2015) Metformin action: concentrations matter. Cell Metab. 21, 159–162 10.1016/j.cmet.2015.01.003 [DOI] [PubMed] [Google Scholar]
- 6. Foretz M., Guigas B., Bertrand L., Pollak M., and Viollet B. (2014) Metformin: from mechanisms of action to therapies. Cell Metab. 20, 953–966 10.1016/j.cmet.2014.09.018 [DOI] [PubMed] [Google Scholar]
- 7. Baur J. A., and Birnbaum M. J. (2014) Control of gluconeogenesis by metformin: does redox trump energy charge? Cell Metab. 20, 197–199 10.1016/j.cmet.2014.07.013 [DOI] [PMC free article] [PubMed] [Google Scholar]
- 8. Rena G., Hardie D. G., and Pearson E. R. (2017) The mechanisms of action of metformin. Diabetologia 60, 1577–1585 10.1007/s00125-017-4342-z [DOI] [PMC free article] [PubMed] [Google Scholar]
- 9. El-Mir M. Y., Nogueira V., Fontaine E., Avéret N., Rigoulet M., and Leverve X. (2000) Dimethylbiguanide inhibits cell respiration via an indirect effect targeted on the respiratory chain complex I. J. Biol. Chem. 275, 223–228 10.1074/jbc.275.1.223 [DOI] [PubMed] [Google Scholar]
- 10. Owen M. R., Doran E., and Halestrap A. P. (2000) Evidence that metformin exerts its anti-diabetic effects through inhibition of complex 1 of the mitochondrial respiratory chain. Biochem. J. 348, 607–614 10.1042/0264-6021:3480607 [DOI] [PMC free article] [PubMed] [Google Scholar]
- 11. Fulgencio J. P., Kohl C., Girard J., and Pégorier J. P. (2001) Effect of metformin on fatty acid and glucose metabolism in freshly isolated hepatocytes and on specific gene expression in cultured hepatocytes. Biochem. Pharmacol. 62, 439–446 10.1016/S0006-2952(01)00679-7 [DOI] [PubMed] [Google Scholar]
- 12. Gouaref I., Detaille D., Wiernsperger N., Khan N. A., Leverve X., and Koceir E. A. (2017) The desert gerbil Psammomys obesus as a model for metformin-sensitive nutritional type 2 diabetes to protect hepatocellular metabolic damage: impact of mitochondrial redox state. PLoS One 12, e0172053 10.1371/journal.pone.0172053 [DOI] [PMC free article] [PubMed] [Google Scholar]
- 13. Bridges H. R., Jones A. J., Pollak M. N., and Hirst J. (2014) Effects of metformin and other biguanides on oxidative phosphorylation in mitochondria. Biochem. J. 462, 475–487 10.1042/BJ20140620 [DOI] [PMC free article] [PubMed] [Google Scholar]
- 14. Argaud D., Roth H., Wiernsperger N., and Leverve X. M. (1993) Metformin decreases gluconeogenesis by enhancing the pyruvate kinase flux in isolated rat hepatocytes. Eur. J. Biochem. 213, 1341–1348 10.1111/j.1432-1033.1993.tb17886.x [DOI] [PubMed] [Google Scholar]
- 15. Zhou G., Myers R., Li Y., Chen Y., Shen X., Fenyk-Melody J., Wu M., Ventre J., Doebber T., Fujii N., Musi N., Hirshman M. F., Goodyear L. J., and Moller D. E. (2001) Role of AMP-activated protein kinase in mechanism of metformin action. J. Clin. Invest. 108, 1167–1174 10.1172/JCI13505 [DOI] [PMC free article] [PubMed] [Google Scholar]
- 16. Foretz M., Hébrard S., Leclerc J., Zarrinpashneh E., Soty M., Mithieux G., Sakamoto K., Andreelli F., and Viollet B. (2010) Metformin inhibits hepatic gluconeogenesis in mice independently of the LKB1/AMPK pathway via a decrease in hepatic energy state. J. Clin. Invest. 120, 2355–2369 10.1172/JCI40671 [DOI] [PMC free article] [PubMed] [Google Scholar]
- 17. Miller R. A., Chu Q., Xie J., Foretz M., Viollet B., and Birnbaum M. J. (2013) Biguanides suppress hepatic glucagon signalling by decreasing production of cyclic AMP. Nature 494, 256–260 10.1038/nature11808 [DOI] [PMC free article] [PubMed] [Google Scholar]
- 18. Hunter R. W., Hughey C. C., Lantier L., Sundelin E. I., Peggie M., Zeqiraj E., Sicheri F., Jessen N., Wasserman D. H., and Sakamoto K. (2018) Metformin reduces liver glucose production by inhibition of fructose-1–6-bisphosphatase. Nat. Med. 24, 1395–1406 10.1038/s41591-018-0159-7 [DOI] [PMC free article] [PubMed] [Google Scholar]
- 19. Madiraju A. K., Erion D. M., Rahimi Y., Zhang X. M., Braddock D. T., Albright R. A., Prigaro B. J., Wood J. L., Bhanot S., MacDonald M. J., Jurczak M. J., Camporez J. P., Lee H. Y., Cline G. W., Samuel V. T., et al. (2014) Metformin suppresses gluconeogenesis by inhibiting mitochondrial glycerophosphate dehydrogenase. Nature 510, 542–546 10.1038/nature13270 [DOI] [PMC free article] [PubMed] [Google Scholar]
- 20. Madiraju A. K., Qiu Y., Perry R. J., Rahimi Y., Zhang X. M., Zhang D., Camporez J. G., Cline G. W., Butrico G. M., Kemp B. E., Casals G., Steinberg G. R., Vatner D. F., Petersen K. F., and Shulman G. I. (2018) Metformin inhibits gluconeogenesis via a redox-dependent mechanism in vivo. Nat. Med. 24, 1384–1394 10.1038/s41591-018-0125-4 [DOI] [PMC free article] [PubMed] [Google Scholar]
- 21. Mráček T., Drahota Z., and Houštěk J. (2013) The function and the role of the mitochondrial glycerol-3-phosphate dehydrogenase in mammalian tissues. Biochim. Biophys. Acta 1827, 401–410 10.1016/j.bbabio.2012.11.014 [DOI] [PubMed] [Google Scholar]
- 22. Williamson D. H., Lund P., and Krebs H. A. (1967) The redox state of free nicotinamide-adenine dinucleotide in the cytoplasm and mitochondria of rat liver. Biochem. J. 103, 514–527 10.1042/bj1030514 [DOI] [PMC free article] [PubMed] [Google Scholar]
- 23. Al-Oanzi Z. H., Fountana S., Moonira T., Tudhope S. J., Petrie J. L., Alshawi A., Patman G., Arden C., Reeves H. L., and Agius L. (2017) Opposite effects of a glucokinase activator and metformin on glucose-regulated gene expression in hepatocytes. Diabetes Obes. Metab. 19, 1078–1087 10.1111/dom.12910 [DOI] [PubMed] [Google Scholar]
- 24. Wilcock C., and Bailey C. J. (1994) Accumulation of metformin by tissues of the normal and diabetic mouse. Xenobiotica 24, 49–57 10.3109/00498259409043220 [DOI] [PubMed] [Google Scholar]
- 25. Cool B., Zinker B., Chiou W., Kifle L., Cao N., Perham M., Dickinson R., Adler A., Gagne G., Iyengar R., Zhao G., Marsh K., Kym P., Jung P., Camp H. S., and Frevert E. (2006) Identification and characterization of a small molecule AMPK activator that treats key components of type 2 diabetes and the metabolic syndrome. Cell Metab. 3, 403–416 10.1016/j.cmet.2006.05.005 [DOI] [PubMed] [Google Scholar]
- 26. Kawaguchi T., Osatomi K., Yamashita H., Kabashima T., and Uyeda K. (2002) Mechanism for fatty acid “sparing” effect on glucose-induced transcription: regulation of carbohydrate-responsive element-binding protein by AMP-activated protein kinase. J. Biol. Chem. 277, 3829–3835 10.1074/jbc.M107895200 [DOI] [PubMed] [Google Scholar]
- 27. Berry M. N., Gregory R. B., Grivell A. R., Phillips J. W., and Schön A. (1994) The capacity of reducing-equivalent shuttles limits glycolysis during ethanol oxidation. Eur. J. Biochem. 225, 557–564 10.1111/j.1432-1033.1994.00557.x [DOI] [PubMed] [Google Scholar]
- 28. Orr A. L., Ashok D., Sarantos M. R., Ng R., Shi T., Gerencser A. A., Hughes R. E., and Brand M. D. (2014) Novel inhibitors of mitochondrial sn-glycerol 3-phosphate dehydrogenase. PLoS One 9, e89938 10.1371/journal.pone.0089938 [DOI] [PMC free article] [PubMed] [Google Scholar]
- 29. Vincent M. F., Van den Berghe G., and Hers H. G. (1989) d-Xylulose-induced depletion of ATP and Pi in isolated rat hepatocytes. FASEB J. 3, 1855–1861 10.1096/fasebj.3.7.2523832 [DOI] [PubMed] [Google Scholar]
- 30. Arden C., Petrie J. L., Tudhope S. J., Al-Oanzi Z., Claydon A. J., Beynon R. J., Towle H. C., and Agius L. (2011) Elevated glucose represses liver glucokinase and induces its regulatory protein to safeguard hepatic phosphate homeostasis. Diabetes 60, 3110–3120 10.2337/db11-0061 [DOI] [PMC free article] [PubMed] [Google Scholar]
- 31. Dawson A. P., and Thorne C. J. (1969) Preparation and some properties of l-3-glycerophosphate dehydrogenase from pig brain mitochondria. Biochem. J. 111, 27–34 10.1042/bj1110027 [DOI] [PMC free article] [PubMed] [Google Scholar]
- 32. Brown L. J., Koza R. A., Everett C., Reitman M. L., Marshall L., Fahien L. A., Kozak L. P., and MacDonald M. J. (2002) Normal thyroid thermogenesis but reduced viability and adiposity in mice lacking the mitochondrial glycerol phosphate dehydrogenase. J. Biol. Chem. 277, 32892–32898 10.1074/jbc.M202408200 [DOI] [PubMed] [Google Scholar]
- 33. Barberà A., Gudayol M., Eto K., Corominola H., Maechler P., Miró O., Cardellach F., and Gomis R. (2003) A high carbohydrate diet does not induce hyperglycaemia in a mitochondrial glycerol-3-phosphate dehydrogenase-deficient mouse. Diabetologia 46, 1394–1401 10.1007/s00125-003-1206-5 [DOI] [PubMed] [Google Scholar]
- 34. Saheki T., Iijima M., Li M. X., Kobayashi K., Horiuchi M., Ushikai M., Okumura F., Meng X. J., Inoue I., Tajima A., Moriyama M., Eto K., Kadowaki T., Sinasac D. S., Tsui L. C., et al. (2007) Citrin/mitochondrial glycerol-3-phosphate dehydrogenase double knock-out mice recapitulate features of human citrin deficiency. J. Biol. Chem. 282, 25041–25052 10.1074/jbc.M702031200 [DOI] [PubMed] [Google Scholar]
- 35. Taleux N., Guigas B., Dubouchaud H., Moreno M., Weitzel J. M., Goglia F., Favier R., and Leverve X. M. (2009) High expression of thyroid hormone receptors and mitochondrial glycerol-3-phosphate dehydrogenase in the liver is linked to enhanced fatty acid oxidation in Lou/C, a rat strain resistant to obesity. J. Biol. Chem. 284, 4308–4316 10.1074/jbc.M806187200 [DOI] [PubMed] [Google Scholar]
- 36. Nomura T., Iguchi A., Sakamoto N., and Harris R. A. (1983) Effects of octanoate and acetate upon hepatic glycolysis and lipogenesis. Biochim. Biophys. Acta 754, 315–320 10.1016/0005-2760(83)90148-0 [DOI] [PubMed] [Google Scholar]
- 37. Williamson J. R., Browning E. T., and Scholz R. (1969) Control mechanisms of gluconeogenesis and ketogenesis. I. Effects of oleate on gluconeogenesis in perfused rat liver. J. Biol. Chem. 244, 4607–4616 [PubMed] [Google Scholar]
- 38. Arden C., Tudhope S. J., Petrie J. L., Al-Oanzi Z. H., Cullen K. S., Lange A. J., Towle H. C., and Agius L. (2012) Fructose 2,6-bisphosphate is essential for glucose-regulated gene transcription of glucose-6-phosphatase and other ChREBP target genes in hepatocytes. Biochem. J. 443, 111–123 10.1042/BJ20111280 [DOI] [PubMed] [Google Scholar]
- 39. Hers H. G., and Hue L. (1983) Gluconeogenesis and related aspects of glycolysis. Annu. Rev. Biochem. 52, 617–653 10.1146/annurev.bi.52.070183.003153 [DOI] [PubMed] [Google Scholar]
- 40. Dang Q., Brown B. S., Liu Y., Rydzewski R. M., Robinson E. D., van Poelje P. D., Reddy M. R., and Erion M. D. (2009) Fructose-1,6-bisphosphatase inhibitors. 1. Purine phosphonic acids as novel AMP mimics. J. Med. Chem. 52, 2880–2898 10.1021/jm900078f [DOI] [PubMed] [Google Scholar]
- 41. McCune S. A., Foe L. G., Kemp R. G., and Jurin R. R. (1989) Aurintricarboxylic acid is a potent inhibitor of phosphofructokinase. Biochem. J. 259, 925–927 10.1042/bj2590925 [DOI] [PMC free article] [PubMed] [Google Scholar]
- 42. Härndahl L., Schmoll D., Herling A. W., and Agius L. (2006) The role of glucose 6-phosphate in mediating the effects of glucokinase overexpression on hepatic glucose metabolism. FEBS J. 273, 336–346 10.1111/j.1742-4658.2005.05067.x [DOI] [PubMed] [Google Scholar]
- 43. Qi H., Nielsen P. M., Schroeder M., Bertelsen L. B., Palm F., and Laustsen C. (2018) Acute renal metabolic effect of metformin assessed with hyperpolarised MRI in rats. Diabetologia 61, 445–454 10.1007/s00125-017-4445-6 [DOI] [PubMed] [Google Scholar]
- 44. von Morze C., Ohliger M. A., Marco-Rius I., Wilson D. M., Flavell R. R., Pearce D., Vigneron D. B., Kurhanewicz J., and Wang Z. J. (2108) Direct assessment of renal mitochondrial redox state using hyperpolarized 13C-acetoacetate. Magn. Reson. Med. 79, 1862–1869 10.1002/mrm.27054 [DOI] [PMC free article] [PubMed] [Google Scholar]
- 45. Sibille B., Keriel C., Fontaine E., Catelloni F., Rigoulet M., and Leverve X. M. (1995) Octanoate affects 2,4-dinitrophenol uncoupling in intact isolated rat hepatocytes. Eur. J. Biochem. 231, 498–502 10.1111/j.1432-1033.1995.tb20724.x [DOI] [PubMed] [Google Scholar]
- 46. Berry M. N., Phillips J. W., Gregory R. B., Grivell A. R., and Wallace P. G. (1992) Operation and energy dependence of the reducing-equivalent shuttles during lactate metabolism by isolated hepatocytes. Biochim. Biophys. Acta 1136, 223–230 10.1016/0167-4889(92)90110-W [DOI] [PubMed] [Google Scholar]
- 47. Davis E. J., Bremer J., and Akerman K. E. (1980) Thermodynamic aspects of translocation of reducing equivalents by mitochondria. J. Biol. Chem. 255, 2277–2283 [PubMed] [Google Scholar]
- 48. LaNoue K. F., Bryla J., and Bassett D. J. (1974) Energy-driven aspartate efflux from heart and liver mitochondria. J. Biol. Chem. 249, 7514–7521 [PubMed] [Google Scholar]
- 49. Qiu B. Y., Turner N., Li Y. Y., Gu M., Huang M. W., Wu F., Pang T., Nan F. J., Ye J. M., Li J. Y., and Li J. (2010) High-throughput assay for modulators of mitochondrial membrane potential identifies a novel compound with beneficial effects on db/db mice. Diabetes 59, 256–265 10.2337/db09-0223 [DOI] [PMC free article] [PubMed] [Google Scholar]
- 50. Hirst J. (2013) Mitochondrial complex I. Annu. Rev. Biochem. 82, 551–575 10.1146/annurev-biochem-070511-103700 [DOI] [PubMed] [Google Scholar]
- 51. Maldonado E. N., DeHart D. N., Patnaik J., Klatt S. C., Gooz M. B., and Lemasters J. J. (2016) ATP/ADP turnover and import of glycolytic ATP into mitochondria in cancer cells is independent of the adenine nucleotide translocator. J. Biol. Chem. 291, 19642–19650 10.1074/jbc.M116.734814 [DOI] [PMC free article] [PubMed] [Google Scholar]
- 52. Zorova L. D., Popkov V. A., Plotnikov E. Y., Silachev D. N., Pevzner I. B., Jankauskas S. S., Babenko V. A., Zorov S. D., Balakireva A. V., Juhaszova M., Sollott S. J., and Zorov D. B. (2018) Mitochondrial membrane potential. Anal. Biochem. 552, 50–59 10.1016/j.ab.2017.07.009 [DOI] [PMC free article] [PubMed] [Google Scholar]
- 53. Pelantová H., Bugáňová M., Holubová M., Šedivá B., Zemenová J., Sýkora D., Kaválková P., Haluzík M., Železná B., Maletínská L., Kuneš J., and Kuzma M. (2016) Urinary metabolomics profiling in mice with diet-induced obesity and type 2 diabetes mellitus after treatment with metformin, vildagliptin and their combination. Mol. Cell. Endocrinol. 431, 88–100 10.1016/j.mce.2016.05.003 [DOI] [PubMed] [Google Scholar]
- 54. Claus T. H., Schlumpf J. R., El-Maghrabi M. R., and Pilkis S. J. (1982) Regulation of the phosphorylation and activity of 6-phosphofructo 1-kinase in isolated hepatocytes by α-glycerolphosphate and fructose 2,6-bisphosphate. J. Biol. Chem. 257, 7541–7548 [PubMed] [Google Scholar]
- 55. Agius L., Chowdhury M. H., Davis S. N., and Alberti K. G. (1986) Regulation of ketogenesis, gluconeogenesis, and glycogen synthesis by insulin and proinsulin in rat hepatocyte monolayer cultures. Diabetes 35, 1286–1293 10.2337/diab.35.11.1286 [DOI] [PubMed] [Google Scholar]
- 56. Stappenbeck R., Hodson A. W., Skillen A. W., Agius L., and Alberti K. G. (1990) Optimized methods to measure acetoacetate, 3-hydroxybutyrate, glycerol, alanine, pyruvate, lactate and glucose in human blood using a centrifugal analyser with a fluorimetric attachment. J. Automat. Chem. 12, 213–220 10.1155/S1463924690000281 [DOI] [PMC free article] [PubMed] [Google Scholar]


