Abstract
Electron microscopy (EM) studies of the postmortem human brain provide a level of resolution essential for understanding brain function in both normal and disease states. However, processes associated with death can impair the cellular and organelle ultrastructural preservation required for quantitative EM studies. Although postmortem interval (PMI), the time between death and preservation of tissue, is thought to be the most influential factor of ultrastructural quality, numerous other factors may also influence tissue preservation. The goal of the present study was to assess the effects of pre- and postmortem factors on multiple components of ultrastructure in the postmortem human prefrontal cortex. Tissue samples from 30 subjects were processed using standard EM histochemistry. The primary dependent measure was number of identifiable neuronal profiles, and secondary measures included presence and/or integrity of synapses, mitochondria, and myelinated axonal fibers. Number of identifiable neuronal profiles was most strongly affected by the interaction of PMI and pH, such that short PMIs and neutral pH values predicted the best preservation. Secondary measures were largely unaffected by pre- and postmortem factors. Together, these data indicate that distinct components of the neuropil are differentially affected by PMI and pH in postmortem human brain.
Keywords: acidosis, cause of death, degeneration, G-ratio, gray matter, mitochondria, neuropil, oligodendrocyte, postsynaptic density, psychiatric disorder
Introduction
Direct analysis of the human brain is essential for identifying its normal features, and for characterizing neural alterations associated with psychiatric and neurological disorders. Studies of postmortem human brain tissue provide molecular, structural, and circuitry levels of resolution not currently possible in studies of living subjects,1–3 and results of these types of studies are integral for advancing our understanding of, and developing new treatments for, human brain disease.4
Electron microscopy (EM) methods provide a powerful tool for assessing the detailed organization of brain tissue.5 Indeed, EM provides the finest microscopic resolution available, and can be used to directly examine individual neuronal profiles, such as dendritic spines and axon terminals, as well as the organelles and synaptic structures within discrete neuronal profiles.5 As synaptic and/or organelle alterations are thought to contribute to many brain disorders,6 application of EM techniques to postmortem human brain tissue is essential for providing robust characterizations of both the healthy and diseased states.
Despite these advantages, EM studies of postmortem human brain are rare, in part due to practical limitations associated with preserving human brain tissue in a manner ideal for ultrastructural studies. For example, brain tissue for EM studies in experimental animal models is perfusion-fixed with no postmortem interval (PMI, time between death and tissue preservation) to help ensure that proteins and lipids are stabilized before any degradation can occur.7,8 However, human postmortem brain samples can be associated with PMIs of hours to days, and perfusion-fixation of human brain is exceptionally rare. Despite these challenges, qualitative and quantitative EM studies of postmortem human brain tissue have been performed in immersion-fixed samples with PMIs ranging from 4 to 100 hr,9,10–16 though the presence of postsynaptic densities (PSD), myelin sheaths, and mitochondria appear to be the measures most resilient to extended PMIs.9,12–15,17
Moreover, other pre- and postmortem factors can affect tissue and ultrastructure quality other than PMI.3,18–20 For example, experimental models show that acidic pH values are associated with swelling of neuronal processes and mitochondria,18 and acidic brain pH may reflect hypoxia or lactic acidosis processes occurring pre- and perimortem20–22 which can negatively impact general tissue preservation. Unlike experimental animal models, human brain tissue collected postmortem may be associated with one or more of these factors which likely interact to affect ultrastructural preservation of neurons and their organelles.
To determine how pre- and postmortem subject and tissue factors affect ultrastructural preservation in human brain tissue, we performed quantitative EM analyses of dorsolateral prefrontal cortex (DLPFC) tissue from 30 subjects. Presence and integrity of (1) neuronal profiles, (2) synaptic structures, (3) mitochondria, and (4) myelinated axons were quantified. The relationships between each of these measures and (1) premortem factors of age, sex, brain tissue pH, lifetime history of a psychiatric disorder, and cause of death; and (2) postmortem factors of PMI and tissue storage time were investigated.
Materials and Methods
Subjects
Brain specimens (N = 30) were obtained during autopsies conducted at the Allegheny County Medical Examiner’s Office (Pittsburgh, PA) after obtaining consent for donation from the next-of-kin.23 The procedures were approved by the University of Pittsburgh’s Committee for the Oversight of Research and Clinical Training Involving Decedents, and the Institutional Review Board for Biomedical Research. Only subjects who died by accident, natural causes, or suicide, suddenly and out-of-hospital, with no evidence of an agonal state, are included. Each cadaver was placed in cold storage before brain removal, and extracted brains remained chilled throughout transport and processing. Subjects were selected for EM analysis based on PMI such that at least one sample was analyzed for every hour of PMI within the total PMI range (5.9–24.3 hr). Summary subject characteristics are presented in Table 1.
Table 1.
Subject Summary Demographic Characteristics.
| Characteristic | All Subjects | Unaffected Subjects | Affected Subjects |
|---|---|---|---|
| Number | 30 | 12 | 18 |
| Age, years | 48.8 ± 10.7 (22–64) | 52.2 ± 7.7 (39–62) | 46.6 ± 11.9 (22–64) |
| Sex | 23M, 7F | 10M, 2F | 13M, 5F |
| Race | 22W, 7B | 6W, 5B | 16W, 2B |
| PMI, hours | 13.0 ± 5.3 (5.9–24.3) | 10.7 ± 4.9 (5.9–19.8) | 14.5 ± 5.1 (8.3–24.3) |
| PFC pH | 6.7 ± 0.3 (6.0–7.1) | 6.7 ± 0.4 (6.0–7.1) | 6.6 ± 0.3 (6.2–7.1) |
| Storage time, days | 246.0 ± 296.1 (3–773) | 317.8 ± 320.2 (4–729) | 198.11 ± 277.7 (3–773) |
Values are mean ± standard deviation (range). Unaffected subjects had no lifetime history of a psychiatric or neurodegenerative disorder. The race of one subject was unknown. Abbreviations: M, male; F, female; W, white; B, black; PMI, postmortem interval; PFC, prefrontal cortex.
Premortem subject factors assessed were age, sex, brain tissue pH, cause of death, and lifetime history of a psychiatric disorder. Brain tissue pH was measured in a tissue sample from right frontal pole that was fresh-frozen within 1 hr of brain extraction. For each subject, 1 g of tissue was excised and homogenized (Tissue Tearor 985-370, Biospec Products, Bartlesville, OK) at 4C in 10 mL of ddH2O at 7.0 pH. A pH electrode (Orion ROSS Ultra combination electrode, 8156BNUWP, ThermoFisher Scientific, Waltham, MA) was used to take two readings per sample (intraclass correlation coefficient [ICC] = 0.998, 95% confidence interval [CI]), and the average of the two readings was used as the final pH value. Although brain pH is measured postmortem, it indexes pre- and perimortem factors that can cause acidosis within the brain.3 Because all included subjects died without evidence of an agonal state, previously reported scoring systems of agonal state20,24 are not applicable to the current study. However, to assess how different causes of death may affect tissue preservation, subjects were classified into three groups based on the cause of death determined by the Medical Examiner. Subjects with self-inflicted gunshot wound or violent blunt force trauma cause of death were classified as “trauma.” Subjects with a cardiac-related cause of death were classified as “cardiac.” Subjects with drug- or alcohol-related causes of death were classified as “substance use.” Subjects that had other causes of death (electrocution [n = 1], gastrointestinal hemorrhage [n = 1], asphyxia [n = 2], or undetermined [n = 2]) were excluded from the cause of death analysis. Neuropathological exam did not reveal evidence of neurodegenerative disease in any subject. An independent committee of experienced research clinicians rendered Diagnostic and Statistical Manual of Mental Disorders (4th ed.; DSM-IV)25 diagnoses for each subject using the results of structured interviews with next-of-kin and/or available medical records.23
Postmortem subject factors assessed were PMI and tissue storage time. PMI was calculated as the time in hours between death and tissue fixation, and tissue storage time was calculated as the number of days between sectioning via vibratome and histology.
Tissue Preparation for Electron Microscopy
A coronal block of DLPFC area 4626 was cut at approximately 1 cm thickness, and immersed in a solution of 4% paraformaldehyde and 0.2% glutaraldehyde (pH 7.2–7.4) for 24 hr at room temperature, followed by 24 hr at 4C. The tissue block was then rinsed in 0.1 M phosphate buffer (PB) and sectioned at 50 µm thickness using a vibratome (VT 1000P, Leica, Wetzlar, Germany). Tissue sections were stored in a cryoprotectant solution containing 30% ethylene glycol and 30% glycerol at −30C until histology processing.
Histochemistry
One section was processed from each subject. In 29 of 30 subjects, the selected section was within 300 µm of a rostral or caudal face of the tissue block, and in one subject, the tissue section was within 1.2 mm. Sections were rinsed in 0.1 M PB to remove cryoprotectant solution, and then postfixed in 1% osmium tetroxide for 60 min. After rinsing, tissue sections were dehydrated in ascending ethanol concentrations, including en bloc staining with 1% uranyl acetate in 70% ethanol. Tissue sections were further dehydrated with propylene oxide, and then incubated overnight in a 1:1 mixture of propylene oxide and EMbed resin (Electron Microscopy Sciences, Hatfield, PA, Catalog Numbers: 10900, 13710, 14900, 11400). Tissue sections were then embedded in 100% EMbed resin for 3 hr, mounted onto glass slides coated with liquid release (Electron Microscopy Sciences, Catalog Number: 70880), and incubated for 2 days at 60C to permit polymerization of resin.
Ultrastructural Analysis of Material
A sample from DLPFC gray matter was excised and glued to a resin block. Samples were chosen between layers superficial 3 and superficial 6, but most samples were taken from layers 3 to 4 (n = 25). Samples were cut at 80 nm thickness, collected on formvar-/carbon-coated copper slot grids (Electron Microscopy Sciences, Catalog Number: FCF2010-CU), and examined on a JOEL JEM 1011 transmission electron microscope (JEOL, Peabody, MA) with a side-mounted Hamamatsu ORCA-HR digital camera system (Hamamatsu USA, Bridgewater, NJ) using AMT 2k software (Advanced Microscopy Techniques, Danvers, MA). The tissue-resin interface at one edge of an ultrathin section was identified, the field of view was moved into the tissue away from the interface by approximately 5 µm, and then five electron micrographs at the same approximate tissue depth were digitally imaged and captured at X25,000. Each electron micrograph was taken immediately adjacent to the previous, and only areas with cell bodies were avoided so that neuropil was captured. Each electron micrograph was divided into four equal quadrants, and two quadrants per micrograph were randomly selected for analysis using a random number generator. Each quadrant represented 16 µm2 for a total of 160 µm2 analyzed per subject.
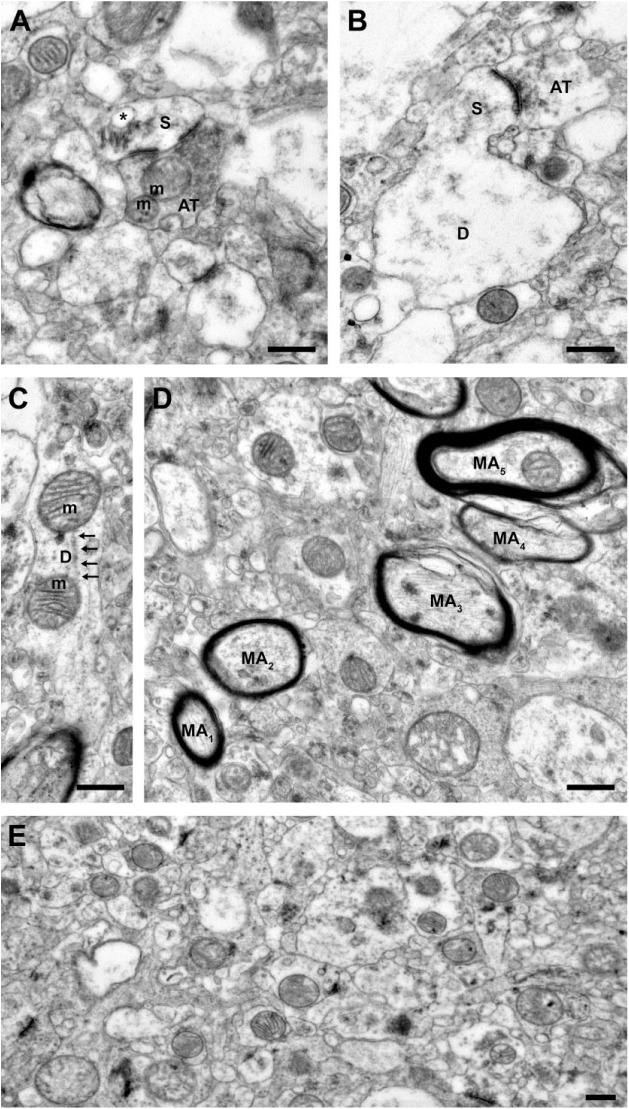
Within each quadrant, neuronal profiles were identified based on established criteria.5 Profiles were classified as axon terminals, myelinated axons, dendritic shafts, or dendritic spines (Fig. 1). Axon terminals contain synaptic vesicles, may form synaptic contacts, and may contain mitochondria. Myelinated axons have a central axonal structure surrounded by oligodendrocyte processes which form the characteristic myelin sheath. Dendritic shafts may contain microtubules and mitochondria, do not contain synaptic vesicles, and may receive synaptic contacts. Dendritic spines contain actin and may contain a spine apparatus, may receive synaptic contacts, and do not contain mitochondria, microtubules, or synaptic vesicles.
Figure 1.
Representative images from tissue with good ultrastructural preservation. (A) A dendritic spine receiving a Type 1, presumably glutamatergic, synapse from an axon terminal containing numerous vesicles and two mitochondria exhibiting normal morphology. Note the perforated postsynaptic density and the extensive spine apparatus (asterisk) within the spine. (B) A dendritic spine protruding from the parent dendrite and receiving a Type 1 synapse from an axon terminal. The parent dendrite shows some signs of swelling. (C) Dendrite containing two mitochondria with normal morphology and organized microtubules (arrows). (D) Myelinated axons. Note that the ultrastructure of the central axons is preserved, but the integrity of the myelin sheaths varies. Myelin sheaths surrounding axons 1 and 2 are intact, while myelin sheaths surrounding axons 3 to 5 show some evidence of lamellae splitting. (E) A representative field of neuropil. Scale bars are 500 nm. Abbreviations: S, spine; m, mitochondrion; AT, axon terminal; D, dendrite; MA, myelinated axon.
Because insufficient ultrastructural preservation impairs the ability of trained raters to identify individual components of the neuropil, the number of profiles identifiable is a broad measure of ultrastructural preservation and integrity.7 As such, our primary dependent measure was number of identifiable neuronal profiles per 160 µm2 analyzed per subject, excluding all axons. The number of neuronal profiles identifiable in the total area analyzed was quantified by one investigator (J.R.G.). The number of profiles identifiable in half of the total area analyzed were quantified again to obtain intra-rater reliability (ICC = 0.995, 95% CI) and quantified again by another investigator (A.K.) to calculate inter-rater reliability (ICC = 0.97, 95% CI).
Secondary measures of ultrastructural preservation included counts of PSD which reflect Type 1 asymmetric synapses27 and mitochondria, as well as PSD length and the g-ratio of myelinated axons.28,29 All structures were identified based on established criteria5 within the same quadrants analyzed for the primary output measure. PSD are electron-dense bands present at the synaptic contact within the postsynaptic structure, and only PSD reflecting Type 1 asymmetric synaptic contacts were counted. Mitochondria are discrete organelles defined by the presence of a double membrane and the presence of an internal cristae and matrix. PSD and mitochondria located in any profile, irrespective of whether that profile could be identified, were included in these analyses. The counting analysis of PSD and mitochondria was performed as described for neuronal profiles, and both intra- and inter-rater ICC ≥ 0.97, 95% CI. To measure PSD length, electron micrographs were imported into Photoshop software (Adobe Systems Incorporated, San Jose, CA), and the line tool was used to measure the linear distance between the two edges of the PSD. For perforated synapses, each PSD was measured separately and summed. Length measurements were made twice by one investigator (J.R.G.; ICC = 0.997, 95% CI) and averaged to calculate mean length for each PSD. All mean PSD lengths per subject were then averaged. The g-ratio of myelinated axons cut perpendicular to the sectioning plane for which the axolemma was identifiable was calculated as the ratio of the axonal diameter to the total diameter of the myelinated axon. Myelinated axons meeting these criteria (N = 85) were present in 90% of subjects (27 of 30). The diameter of the inner axon was measured using the line tool in the Photoshop software, and the diameter of the myelinated axon was measured from the same position. These measurements were made twice by one investigator (J.R.G.; ICC axonal diameter = 0.99, ICC myelinated axon diameter = 0.99; 95% CI) and averaged. The g-ratio was calculated using these values, and all g-ratios per subject were averaged.
Measures reflecting the integrity of mitochondria, myelin sheaths, and axon terminals forming asymmetric synapses were also analyzed. Ultrastructural integrity of mitochondria was assessed by classifying the morphological state of each mitochondrion as normal or abnormal. Normal morphology included both the Orthodox and Condensed conformations,30,31 and is characterized by the presence of an uninterrupted double membrane, organized cristae, and a homogeneous matrix. Abnormal morphology is characterized by a broken double membrane, disorganized and fragmented cristae, and a swollen matrix. Mitochondria exhibiting at least two of these characteristics were classified as abnormal. The number of mitochondria with an abnormal morphology was calculated for each subject as the output measure. Myelin sheath integrity was assessed by the presence or absence of one or more of the following defects: lamellae splitting, expanded periaxonal space, or myelin ballooning.32 Intact myelin sheaths were defined as having none of these defects. Finally, the integrity of axon terminals forming asymmetric synapses was investigated by evaluating presence of ultrastructural characteristics associated with degeneration. Degenerating axon terminals can present as electron-lucent, electron-dense, or neurofilamentous hyperplagia.32–36 Electron-lucent degeneration is characterized by a clear cytoplasm and depleted synaptic vesicles that cluster together. Electron-dense degeneration is characterized by darkened cytoplasm, and either a depletion of synaptic vesicles or tightly packed, enlarged synaptic vesicles. Neurofilamentous hyperplagia degeneration is characterized by a preponderance of neurofilaments filling the cytoplasm and swelling of the terminal. Each terminal forming an asymmetric synapse was classified as nondegenerating or as one of the above subtypes.
Statistics
Primary statistical analyses were performed between each pre- and postmortem factor and number of profiles/160 µm2. Continuous independent variables (pH, PMI, storage time, age) were evaluated using a two-tailed Pearson correlation analysis. The resulting R2-value was assessed at significance <0.05. Categorical independent variables (sex, history of a psychiatric disorder, and cause of death) were analyzed using one-way ANOVA analyses. The resulting F value was assessed at significance <0.05. Post hoc analyses were performed using a Tukey’s test. Multiple regression analysis was performed to assess any interactive effects between PMI and pH on the primary dependent measure. The resulting F value was assessed at significance <0.05. The statistical analyses of all secondary dependent measures were performed as described for neuronal profiles.
Results
Qualitative Assessment of Ultrastructure Quality
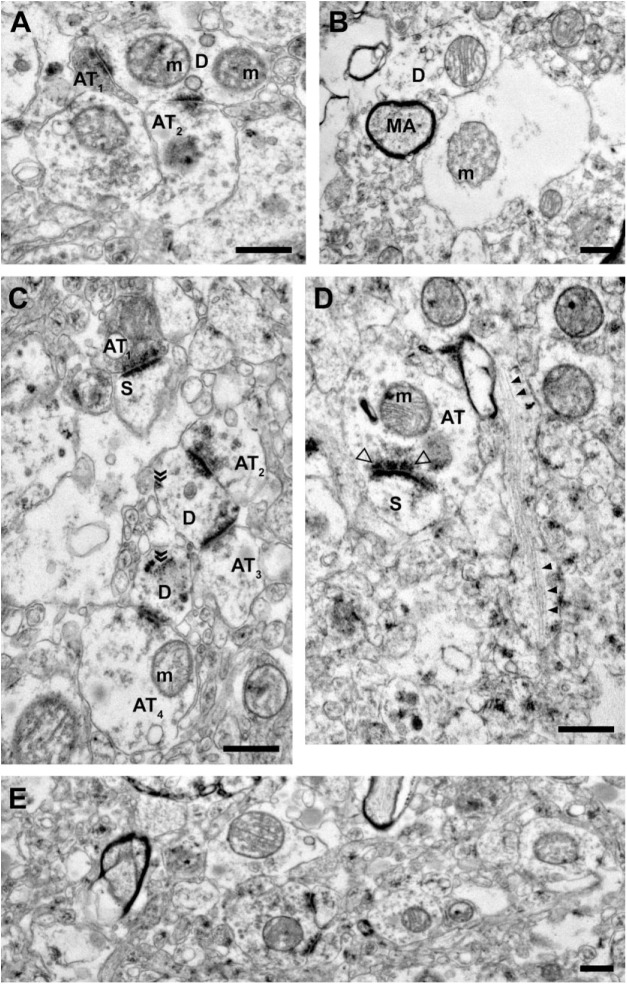
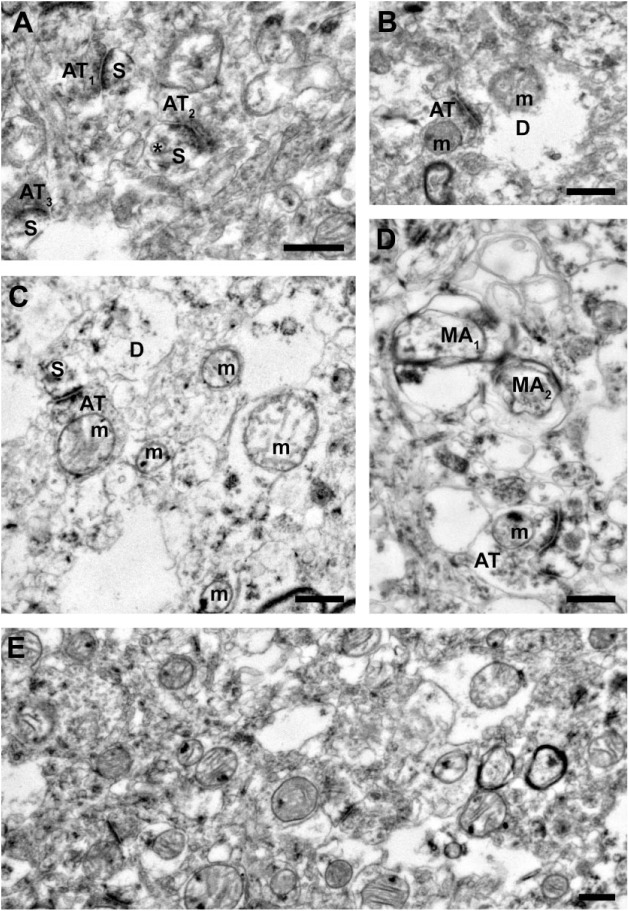
Ultrastructural preservation of neuronal profiles and organelles varied across postmortem human brain tissue samples (Figs. 1–3). Samples with good preservation (Fig. 1) exhibited (1) intact cellular and organelle plasma membranes; (2) a paucity of swelling and vacuoles within neuronal and glial processes and organelles; (3) mitochondria with organized cristae, homogeneous matrix, and nondistorted shapes; (4) clearly identifiable cytoskeletal elements like microtubules and actin; and (5) clearly identifiable neuronal profiles such as axon terminals, dendritic shafts and spines, and myelinated and unmyelinated axons. Samples with intermediate (Fig. 2) and poor (Fig. 3) ultrastructural preservation lacked some of or all these qualities. To assess which factors likely influence the observed variability in ultrastructural preservation, quantitative analyses were performed.
Figure 2.
Representative images from tissue with intermediate ultrastructural preservation. (A) Two axon terminals forming Type 1 synapses onto a dendritic shaft containing two mitochondria with abnormal morphology. (B) The central profile is unidentifiable as a glial process or swollen dendrite and contains a mitochondrion with abnormal morphology. The myelinated axon has an intact central axon and myelin sheath. (C) Axon terminals forming Type 1 synapses onto dendritic spines and shafts. The presence of free ribosomes (indicated by chevrons) and vesicles suggest these dendritic shaft profiles are proximal to the cell body. (D) An unmyelinated axon, cut longitudinally, containing organized neurofilaments (filled arrowheads). An axon terminal forming a Type 1 synapse onto a spine has a visible presynaptic specialization (open arrowheads). (E) A representative field of neuropil. Scale bars are 500 nm. Abbreviations: AT, axon terminal; m, mitochondrion; D, dendrite; MA, myelinated axon; S, spine.
Figure 3.
Representative images from tissue with poor ultrastructural preservation. (A) Three axon terminals forming Type 1 synapses onto dendritic spines. Although sections of the plasma membranes for each spine are not preserved, each profile is still identifiable, as is a spine apparatus (asterisk). Many of the surrounding profiles cannot be identified due to poor preservation of membranes and cytoplasm swelling. (B) An axon terminal forming a Type 1 synapse onto a swollen dendrite containing a mitochondrion with abnormal morphology. (C) An axon terminal forming a Type 1 synapse onto a dendritic spine. Due to the poor membrane preservation, it is unclear whether this spine is connected to the adjacent dendrite. Although the mitochondrion in the axon terminal exhibits a normal morphology, all surrounding mitochondria are abnormal. Many of the surrounding profiles show pronounced swelling and are largely unidentifiable. (D) An axon terminal forming a Type 1 synapse onto an unknown postsynaptic profile. The two identifiable myelinated axons show profound defects in the central axons and myelinated sheaths. The remaining components of the neuropil are largely unidentifiable due to cytoplasm component depletion and swelling. (E) A representative field of neuropil. Scale bars are 500 nm. Abbreviations: AT, axon terminal; S, spine; m, mitochondrion; D, dendrite; MA, myelinated axon.
Effects of Subject and Tissue Factors on Neuronal Profile Preservation
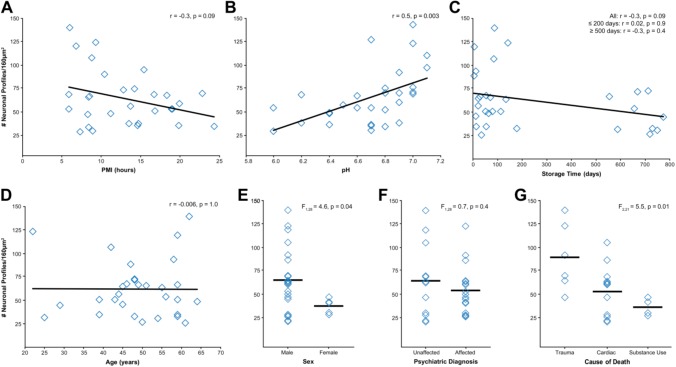
Neuronal profiles were identifiable in all subjects analyzed (Table 2). However, consistent with qualitative observations, neuropil preservation varied substantially across all subjects. Quantitative analyses revealed that PMI was negatively correlated with number of neuronal profiles (Fig. 4A; r = −0.3, p = 0.09), though this relationship did not achieve statistical significance. Prefrontal cortex pH was significantly positively correlated with number of neuronal profiles (Fig. 4B; r = 0.5, p = 0.003). Tissue storage time was negatively correlated with number of neuronal profiles (Fig. 4C; r = −0.3, p = 0.09), though this did not achieve statistical significance. This relationship appears to be driven by the large range and bimodal distribution of tissue storage times, as there was no significant relationship between tissue storage time ≤200 days and number of neuronal profiles (n = 21; r = 0.02, p = 0.9) nor in tissue storage time ≥500 days and number of neuronal profiles (n = 9; r = −0.3, p = 0.4). Age (Fig. 4D; r = −0.006, p = 1.0) had no relationship with number of neuronal profiles. Sex (Fig. 4E), F(1, 28) = 4.6, p = 0.04, had a significant effect on number of profiles, with the female subjects (n = 7) having on average 38% fewer identifiable neuronal profiles than male subjects (n = 23). However, this finding appears to be driven by sex differences in pH. Mean pH was significantly 0.4 pH units lower in female relative to male subjects, F(1, 28) = 10.9, p = 0.003. History of a psychiatric diagnosis (Fig. 4F), F(1, 28) = 0.7, p = 0.4, had no effect on number of neuronal profiles. Finally, cause of death (Fig. 4G), F(2, 21) = 5.5, p = 0.01, had a significant main effect on number of neuronal profiles. Post hoc analyses identified that trauma subjects had on average 38% more identifiable neuronal profiles than cardiac (p = 0.03) and 55% more identifiable neuronal profiles than substance use (p = 0.02) subjects.
Table 2.
Number of Structures Per Area of Neuropil.
| Measure | Number Per 160 µm2 |
|---|---|
| Neuronal profiles | 62.4 ± 5.5 (26–140) |
| Postsynaptic densities | 11.9 ± 0.9 (4–24) |
| Mitochondria | 49.6 ± 1.9 (29–67) |
Values are mean ± SEM and (range)/160 µm2 of neuropil. Abbreviation: SEM, standard error of the mean.
Figure 4.
Assessment of pre- and postmortem factors on neuronal profile preservation in total examined neuropil area. (A) PMI and number of neuronal profiles showed a negative correlation that did not reach statistical significance. (B) pH and number of neuronal profiles showed a significant positive correlation. (C) Storage time and number of neuronal profiles showed a negative correlation that did not reach statistical significance. These two measures were not correlated in subjects with storage times ≤200 days or ≥500 days. (D) Age at time of death and number of neuronal profiles were not correlated. (E) Sex had a statistically significant effect on number of neuronal profiles; however, this finding likely reflects sex differences in tissue pH. (F) History of a psychiatric diagnosis did not affect number of neuronal profiles. (G) Cause of death had a significant effect on number of neuronal profiles. Subsequent Tukey’s test revealed significant differences between the trauma group and the cardiac and substance use groups (all p≤0.03). Abbreviation: PMI, postmortem interval.
The effects of PMI and pH do not appear to be driven by any of the other assessed factors. PMI and pH were not significantly associated with age (all r ≤ −0.1, all p≥0.1). Neither PMI, F(2, 21) = 1.6, p = 0.2, nor pH, F(2, 21) = 1.4, p = 0.3, was affected by cause of death. Subjects with a history of a psychiatric diagnosis had a statistically nonsignificant longer PMI than unaffected subjects (Table 1), F(1, 28) = 4.1, p = 0.05, and the two groups did not differ in mean pH values, F(1, 28) = 0.7, p = 0.4.
Because PMI and pH may interact to affect tissue quality, we tested for interactive effects of these two factors. PMI and pH significantly interacted to affect the number of neuronal profiles (Fig. 5), R2 = 0.5; F(2, 27) = 13.1, p = 0.001; PMI β = −0.49; pH β = 0.65. Despite the strong interactive effect of short PMI and neutral pH on preserving ultrastructure, not every subject with these characteristics had large neuronal profile counts. In a group of subjects (n = 9) with PMI < 11 hr and pH ≥ 6.6, five subjects had large neuronal profile counts and four subjects had small neuronal profile counts. We explored whether any pre- or postmortem factor differed between these two subgroups of subjects. Neither PMI, F(1, 7) = 0.1, p = 0.8, nor age, F(1, 7) = 1.0, p = 0.4, significantly differed between these two groups. All subjects were male, and Fisher’s exact test showed no difference in cause of death or history of a psychiatric diagnosis (p = 1.0). However, mean pH was significantly, F(1, 7) = 6.5, p = 0.04, 0.2 pH units higher in the large neuronal profile count group, and mean tissue storage time was significantly, F(1, 7) = 13.7, p = 0.008, 88% longer, on average, in the small neuronal profile count group. Of the four subjects in the small neuronal profile count group, the two subjects with the highest counts (64 and 67 profiles) had the shortest storage times (133 and 553 days, respectively). The remaining two subjects had storage times over 700 days and 27 and 31 identifiable neuronal profiles.
Figure 5.
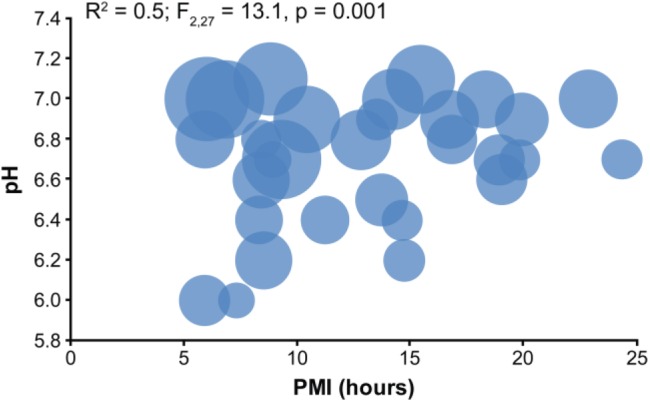
PMI and pH significantly interact to affect neuronal profile preservation. Each marker represents the values of an individual subject, and the size of the circle represents the relative number of neuronal profiles identified in 160 µm2. The largest number of neuronal profiles identified was in subjects with higher pH values and shorter PMIs. Abbreviation: PMI, postmortem interval.
Effects of Subject and Tissue Factors on Synaptic Preservation and Integrity
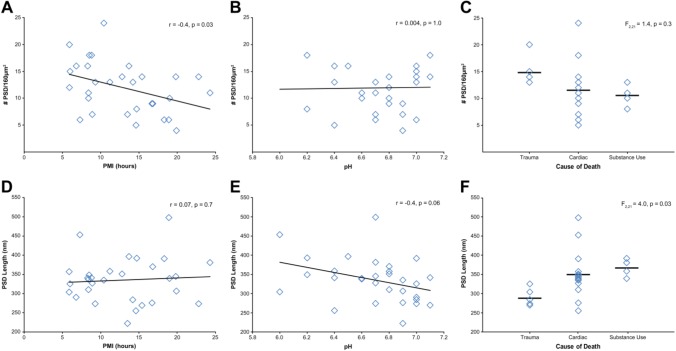
Type 1 asymmetric PSD were identifiable in all subjects analyzed (Table 2). The effect of PMI, pH, and cause of death on the number and length of PSD and the integrity of the axon terminals forming these Type 1 synapses within the neuropil was assessed. PMI was significantly negatively correlated with number of PSD (Fig. 6A; r = −0.4, p = 0.03). PFC pH (Fig. 6B; r = 0.004, p = 1.0) showed no relationship with number of PSD. Cause of death had no effect on the number of PSD (Fig. 6C), F(2, 21) = 1.4, p = 0.3. The average PSD length was 335.1 nm ± 58. PMI had no relationship with PSD length (Fig. 6D, r = 0.07, p = 0.7). PFC pH showed a negative correlation with PSD length (Fig. 6E; r = −0.4, p = 0.06), but this did not reach statistical significance. There was a main effect of cause of death on PSD length (Fig. 6F), F(2, 21) = 4.0, p = 0.03, and post hoc analyses identified statistically nonsignificant differences between trauma and cardiac (p = 0.05) and substance use (p = 0.07) groups.
Figure 6.
Assessment of PMI, pH, and cause of death on PSD number and length. (A) PMI and number of PSD showed a significant negative correlation. (B) Tissue pH and number of PSD were not correlated. (C) Cause of death had no effect on number of PSD identified. PSD length was not significantly correlated with PMI (D) or tissue pH (E). (F) Cause of death had a significant main effect on PSD length. Subsequent Tukey’s test revealed statistically nonsignificant differences between the trauma group and the cardiac and substance use groups (all p≥0.05). Abbreviations: PMI, postmortem interval; PSD, postsynaptic density.
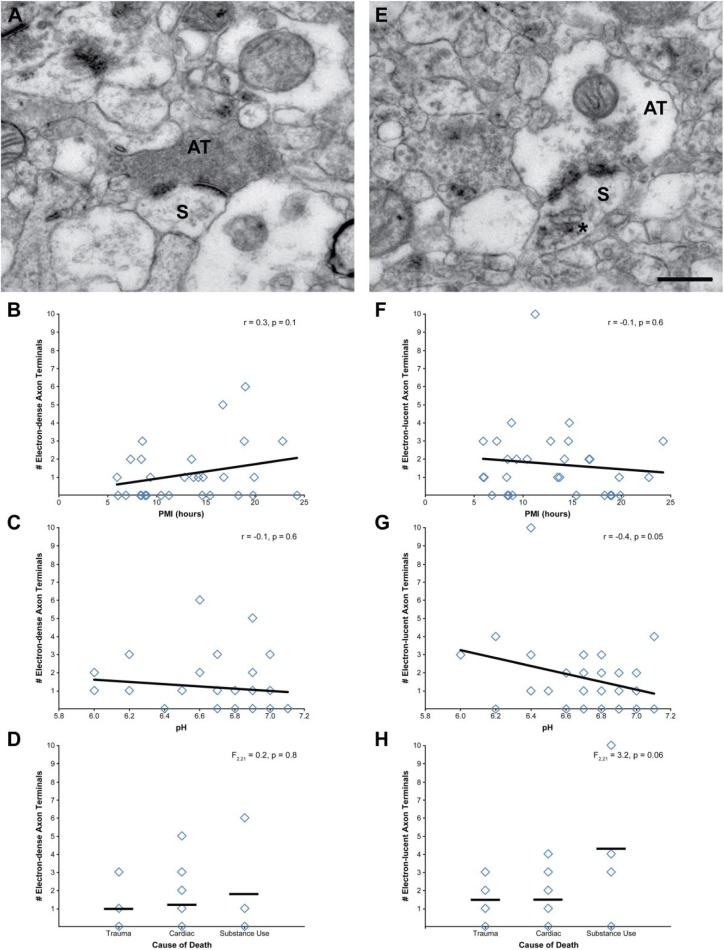
Finally, axon terminals forming Type 1 asymmetric synapses were assessed for signs of degeneration. Of the 345 axon terminals assessed, 10% were electron-dense (Fig. 7A), 15% were electron-lucent (Fig. 7E), and only one terminal showed characteristics of neurofilamentous hyperplagia. Neither PMI (Fig. 7B; r = 0.3, p = 0.1) nor pH (Fig. 7C; r = −0.1, p = 0.6) showed statistically significant correlations with the number of electron-dense terminals. Cause of death had no effect on the number of electron-dense axon terminals (Fig. 7D), F(2, 21) = 0.2, p = 0.8. PMI was not correlated with the number of electron-lucent axon terminals (Fig. 7F), r = −0.1, p = 0.6. PFC pH showed a negative correlation (Fig. 7G), r = −0.4, p = 0.05, but this did not reach statistical significance. Cause of death had a statistically nonsignificant effect on the number of electron-lucent terminals (Fig. 7H), F(2, 21) = 3.2, p = 0.06, and this finding appears to be driven by a single subject with substantially more electron-lucent terminals than all other subjects. Finally, an analysis of whether abundance of degenerating terminals was a characteristic of overall poorly preserved ultrastructure showed no relationship between these two measures (all |r| ≤ 0.1, p≥0.5).
Figure 7.
Assessment of PMI, pH, and cause of death on degenerating axon terminals forming Type 1 asymmetric synapses. (A) Representative example of an electron-dense axon terminal. The number of electron-dense axon terminals was not significantly correlated with PMI (B) or tissue pH (C). (D) Cause of death had no effect on the number of electron-dense axon terminals. (E) Representative example of an electron-lucent axon terminal. The number of electron-lucent axon terminals was not significantly correlated with PMI (F) or tissue pH (G). (H) Cause of death had a statistically nonsignificant effect on number of electron-lucent axon terminals. Scale bar is 500 nm for panels A and E. Abbreviations: PMI, postmortem interval; AT, axon terminal; S, spine.
Effects of Subject and Tissue Factors on Mitochondria Preservation and Integrity
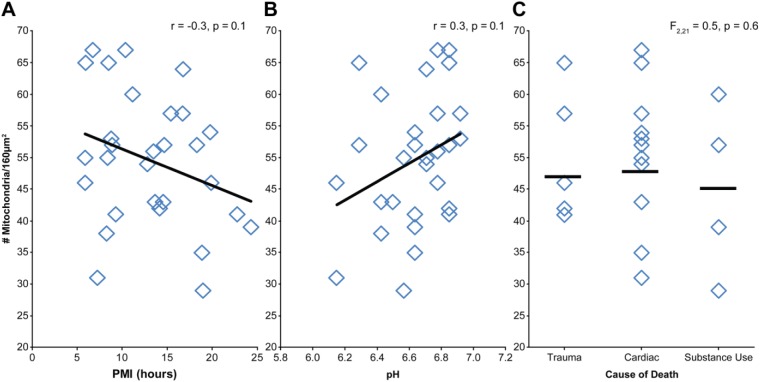
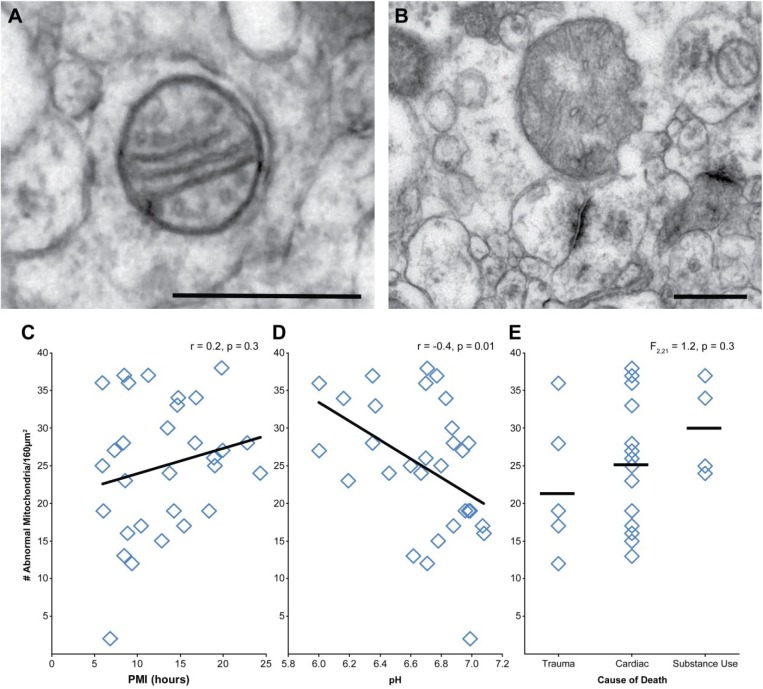
Mitochondria were identifiable in all subjects analyzed (Table 2). Neither PMI (Fig. 8A; r = −0.3, p = 0.1) nor pH (Fig. 8B; r = 0.3, p = 0.1) had a statistically significant relationship with number of mitochondria. Cause of death had no significant effect on number of mitochondria (Fig. 8C), F(2, 21) = 0.5, p = 0.6. Each identified mitochondrion (N = 1,489) was classified as having a normal or abnormal morphology (Fig. 9A–B). Across all subjects, 50% of identified mitochondria had an abnormal conformation. The number of mitochondria with an abnormal conformation was not significantly affected by PMI (Fig. 9C; r = 0.2, p = 0.3). However, there was a significant effect of pH, such that fewer mitochondria exhibited abnormal conformations as pH approached neutral (Fig. 9D; r = −0.4, p = 0.01). Cause of death had no effect on mitochondrial conformation (Fig. 9E), F(2, 21) = 1.2, p = 0.3.
Figure 8.
Assessment of PMI, pH, and cause of death on mitochondrial number. Neither PMI (A) nor tissue pH (B) were significantly correlated with number of mitochondria. (C) Cause of death had no significant effect on number of mitochondria. Abbreviation: PMI, postmortem interval.
Figure 9.
Assessment of PMI, pH, and cause of death on mitochondrial integrity. (A) Representative example of mitochondria with normal morphology. (B) Representative example of mitochondria with abnormal morphology. (C) PMI and the number of abnormal mitochondria were not correlated. (D) Tissue pH and number of abnormal mitochondria showed a significant negative correlation. (E) Cause of death had no significant effect on number of abnormal mitochondria. Scale bars are 500 nm. Abbreviation: PMI, postmortem interval.
Effects of Subject and Tissue Factors on Myelinated Axonal Fiber Integrity
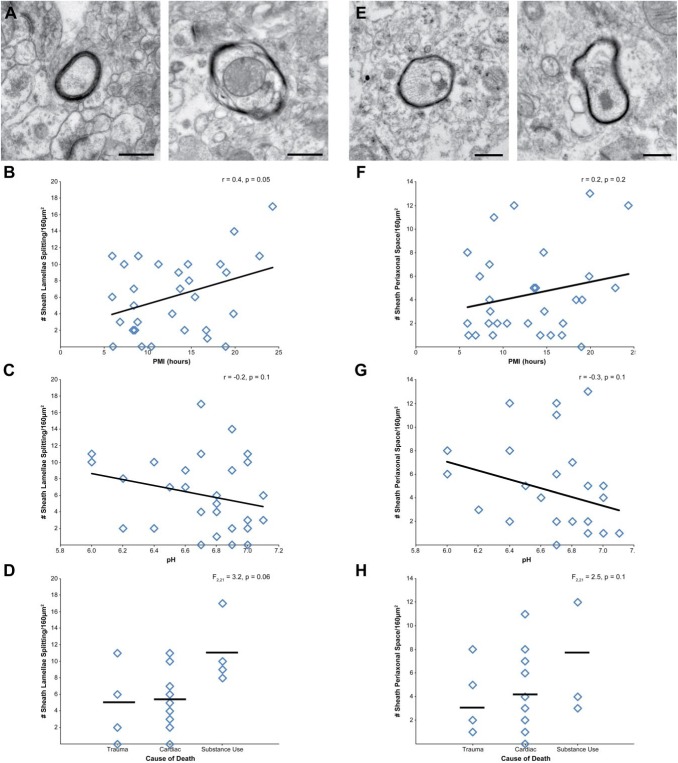
Myelinated axons within the cortical gray matter were assessed for g-ratio and myelin sheath integrity. The average g-ratio was 0.76 ± 0.07, and neither PMI (r = 0.2, p = 0.3) nor pH (r = 0.3, p = 0.2) were significantly correlated with g-ratio. Cause of death had no effect on g-ratio, F(2, 20) = 1.4, p = 0.3. Next, each identified myelin sheath (N = 275) was classified as being intact or exhibiting one or more defects. The number of intact myelin sheaths was not affected by PMI, pH (all r ≤ 0.2, all p≥0.3), nor cause of death, F(2, 21) = 0.4, p = 0.7. Of the myelin sheaths exhibiting a defect, 67% had lamellae splitting, 49% had expanded periaxonal space, and 39% showed both defects. The number of myelin sheaths exhibiting lamellae splitting (Fig. 10A) had a statistically nonsignificant positive correlation with PMI (Fig. 10B; r = 0.4, p = 0.05), but was not affected by pH (Fig. 10C; r = −0.2, p = 0.2). Cause of death had a statistically nonsignificant effect (Fig. 10D), F(2, 21) = 3.2, p = 0.06, on number of myelin sheaths exhibiting lamellae splitting. The number of myelin sheaths exhibiting expanded periaxonal space (Fig. 10E) was not significantly affected by PMI (Fig. 10F; r = 0.2, p = 0.2), pH (Fig. 10G; r = −0.3, p = 0.1), or cause of death (Fig. 10H), F(2, 21) = 2.5, p = 0.1. No myelin sheaths exhibited ballooning, consistent with the absence of subjects with neurodegenerative disorders or of advanced age in this cohort.32,37,38
Figure 10.
Assessment of PMI, pH, and cause of death on myelin sheath integrity. (A) Representative examples of intact myelin sheath (left) and myelin sheath with lamellae splitting (right). (B) PMI and number of myelin sheaths with lamellae splitting showed a statistically nonsignificant correlation. (C) Tissue pH and number of myelin sheaths with lamellae splitting were not correlated. (D) Cause of death had a statistically nonsignificant effect on number of myelin sheaths with lamellae splitting. (E) Representative examples of intact myelin sheath (left) and myelin sheath with expanded periaxonal space (right). Neither PMI (F) nor tissue pH (G) were correlated with the number of myelin sheaths with expanded periaxonal space (H) Cause of death had no significant effect on number of myelin sheaths with expanded periaxonal space. Scale bars are 500 nm. Abbreviation: PMI, postmortem interval.
Discussion
We performed quantitative EM to assess the effects of age, sex, lifetime history of a psychiatric diagnosis, cause of death, tissue pH, PMI, and tissue storage time on the preservation and integrity of neuronal profiles, synapses, mitochondria, and myelinated axonal fibers in the DLPFC gray matter of 30 postmortem human subjects. Neuronal profiles, synaptic structures, mitochondria, and myelinated axonal fibers were identifiable in all subjects examined. The preservation of neuronal profiles, reflecting overall ultrastructural quality, was most strongly affected by the interaction of PMI and pH, such that short PMIs and neutral pH values predicted the best preservation. Measures of pre- and postsynaptic structures, mitochondria, and myelin sheaths were largely unaffected by pre- and postmortem tissue and subject factors.
PMI is considered a primary factor determining the ultrastructural preservation of neuronal profiles.7,39,40 As such, the application of quantitative EM techniques to postmortem human brain tissue, which can be associated with extended PMIs, has not been widely implemented. However, in the range of PMIs studied here (5.9–24.3 hr), longer PMIs were only weakly associated with reduced preservation of neuronal profiles. Acidic pH values are also associated with poorer tissue quality19,20 and ultrastructural preservation,18 and in the range of pH values studied here (6.0–7.1), pH was significantly associated with the ability to identify neuronal profiles. Further analysis showed that PMI and pH significantly interact such that 50% of the variance of the number of identifiable neuronal profiles was explained by this interaction. Thus, within the pH and PMI ranges tested in the current study, pH has a stronger effect than PMI on overall ultrastructural preservation, but the two interact such that longer PMI and lower pH subjects have the poorest ultrastructural preservation.
Although subjects with shorter PMIs and more neutral pH values had higher quality ultrastructure, not every subject with these characteristics exhibited good ultrastructural preservation. In the nine subjects with short PMIs and pH ≥ 6.6, four had intermediate to poor ultrastructural preservation. An exploratory analysis indicated that these four subjects had, on average, significantly smaller pH values and longer tissue storage times. Although the samples size is small, these results suggest that, for EM analyses, even small reductions in pH and tissue storage times over 700 days can impair overall preservation of neuronal profiles in subjects with short PMIs.
Analysis of the effects of PMI and pH on synaptic structures, including PSD abundance and length, and presence of degenerating axon terminals forming Type 1 synapses showed only a statistically significant correlation between PMI and PSD number. Consistent with this finding, the number of PSD detectable per area of neuropil identified in the current study is nearly identical to that found in two previous studies of postmortem human PFC which included subjects with PMIs of 12 to 25 hr,15,41 and less than studies that utilized samples with PMIs <13 hr42,43 and ≤2 hr.44 The mean PSD length identified in the current study is also similar to previous EM studies performed in postmortem human PFC9,43–45 that utilized samples with PMIs of 30 min to 99 hr, consistent with the current finding that PMI does not affect PSD length. Although the relationship did not meet statistical significance, there was a modest negative correlation between pH and PSD length, such that more acidic pH values are associated with longer PSD. Interestingly, studies in experimental systems indicate that acidic pH enhances actin nucleation and elongation,46,47 which may contribute to the current findings. Finally, the abundance of electron-lucent axon terminals also showed a negative correlation with tissue pH, although this did not meet statistical significance. This observation is consistent with existing studies demonstrating that acidic tissue pH values are associated with initiation of cellular processes deleterious to cell health48–50 and increased profile lucency.18
PMI and pH largely had no effect on measures of mitochondria and myelinated axonal fibers. For example, EM studies of white matter in human brain samples with PMIs of 14 to 36 hr and unknown pH values have previously calculated mean g-ratios of 0.6 to 0.7.51,52 The mean g-ratio calculated here, 0.76, is consistent with these values and the qualitative observation that myelin sheaths are typically smaller in gray relative to white matter. Indeed, the only statistically significant relationship of these measures was a negative correlation between pH and the number of abnormal mitochondria, such that fewer abnormal mitochondria were identified at pH values approaching neutral. Together with the significant effects of pH on neuronal profile preservation, these data indicate that pH values, more so than PMI, have effects on multiple aspects of brain tissue ultrastructural preservation.
Other than PMI and pH, only two other factors affected any of the measures of ultrastructural quality. Sex had a significant effect on the number of neuronal profiles identified, but this appears to reflect the significantly more acidic tissue pH in the female subjects. Cause of death had a significant main effect on neuronal profile preservation and PSD length. Post hoc analyses only identified significant differences between groups in neuronal profile preservation such that subjects who died from trauma had better preservation than the 14 subjects who died from cardiac causes and the four subjects who died from substance abuse. This difference does not appear to reflect any mean difference in pH or PMI across these three groups, and likely reflects, at least in part, a consequence of the rapidity of traumatic death circumstances. Finally, age, tissue storage time, and lifetime history of a psychiatric diagnosis had no significant relationship with neuronal profile preservation. These results extend previous findings showing no change in the presence of PSD within the age range tested here,17 and indicate that history of a psychiatric disorder does not itself predict impaired brain ultrastructural preservation.
Findings of single and interactive effects of PMI and pH have key implications for future EM studies in human brain tissue. First, the general stability of synaptic, mitochondrial, and myelin structures, especially to PMI, expands the population of subjects that may be appropriate for EM analyses. Second, given the importance of tissue pH, a pH analysis of brain tissue can efficiently inform whether a subject will likely have sufficient ultrastructural preservation before committing the substantial time and resources required for EM studies. Third, these findings highlight the importance of matching subjects for these tissue and subject variables across diagnostic groups when designing studies of the effects of brain disease. Ensuring that both affected and unaffected subjects have similar PMIs and tissue pH values can mitigate any potential confounding effect of these variables that may obscure a true disease effect. Fourth, assessing any effect of key pre- and postmortem factors on dependent measures is a critical component of postmortem human brain tissue study design, and the current findings reinforce this concept. Indeed, the tissue preservation of any given subject may be appropriate for quantifying some measures, like abundance of mitochondria or g-ratio, and inappropriate for other measures, like abundance of neuronal profiles or PSD.
The current findings also have important implications for comparative neuroanatomical studies across species. PMI and pH showed significant interactive and individual effects on measures of ultrastructural preservation. However, PMIs are not present in animal studies, and the brain tissue is likely to have nonacidic pH values. These differences may be critical to consider when interpreting species-specific differences for some measures. For example, the number of Type 1 asymmetric PSD per area or volume of PFC neuropil is generally similar in human15,41–44 and nonhuman53–55 primate, but this density is higher in mouse PFC.54 Although the difference between mouse and monkey likely reflects a true species effect, similarities or differences for this measure with human may be influenced by human sample-specific factors of PMI and acidic pH values. However, many of the ultrastructural measures assessed in the current study were not affected by pre- or postmortem factors, which is ideal for interpreting ultrastructural findings across species. For example, g-ratio was not affected by PMI or pH, and the g-ratio calculated here is nearly identical to that calculated in mouse PFC gray matter.56
Methodological and subject characteristics of the samples analyzed in the current study represent potential limitations in the generalizability of these findings to other postmortem human brain ultrastructural analyses. First, the tissue samples were fixed in a solution containing paraformaldehyde and glutaraldehyde, which is ideal for EM studies.7 However, most human tissues are fixed in either formalin or paraformaldehyde after autopsy, and our findings may not be applicable to EM studies utilizing these fixation protocols. Second, the subjects analyzed had no evidence of an agonal state and no neurodegenerative diseases, both of which can have deleterious effects on tissue preservation. As such, the postmortem human brain tissue samples included in the current study are optimized for ultrastructural preservation.
In sum, the current study demonstrates that discrete components of the neuropil are differentially affected by only a few pre- and postmortem factors. Given the importance of ultrastructural analyses to understanding how normal brain structure is altered in various clinical brain-related disorders, these results support less restrictive PMI requirements, the importance of assessing brain pH, and expanding the application of quantitative EM analyses in postmortem human brain research.
Acknowledgments
The authors gratefully acknowledge the excellent digital graphics expertise of Mary Brady. Tissue from some subjects was obtained from the NIH NeuroBioBank at the University of Pittsburgh Brain Tissue Donation Program.
Footnotes
Competing Interests: The author(s) declared the following potential conflicts of interest with respect to the research, authorship, and/or publication of this article: J.R.G. and A.K. declare they have no competing interests. D.A.L. currently receives investigator-initiated research support from Pfizer. In 2016–2018, he served as a consultant in the areas of target identification and validation and new compound development to Merck.
Author Contributions: JRG and AK designed the studies and performed the histochemistry and analyses. AK and JRG drafted the manuscript. DAL provided manuscript revisions critically important for intellectual content. All authors have read and approved the final manuscript.
Funding: The author(s) disclosed receipt of the following financial support for the research, authorship, and/or publication of this article: Grant support was provided by NIH grant MH107735 and the Brain and Behavior Research Foundation NARSAD Young Investigator Award 23866 (J.R.G.), NIH grant P50 MH103204 (D.A.L.), and by 1S10RR019003-01 Shared Instrument Grant.
Contributor Information
Jill R. Glausier, Department of Psychiatry, University of Pittsburgh.
Anisha Konanur, The Dietrich School of Arts & Sciences, University of Pittsburgh.
David A. Lewis, Department of Psychiatry, University of Pittsburgh Department of Neuroscience, University of Pittsburgh.
Literature Cited
- 1. Gonzalez-Riano C, Tapia-Gonzalez S, Garcia A, Munoz A, DeFelipe J, Barbas C. Metabolomics and neuroanatomical evaluation of post-mortem changes in the hippocampus. Brain Struct Funct. 2017;222(6):2831–53. [DOI] [PMC free article] [PubMed] [Google Scholar]
- 2. Lewis DA, Glausier JR. Alterations in prefrontal cortical circuitry and cognitive dysfunction in schizophrenia. In: Li M, Spaulding WD. editors. The neuropsychopathology of schizophrenia. Vol. 63 Switzerland: Springer; 2016. p. 31–75. [DOI] [PubMed] [Google Scholar]
- 3. Beneyto M, Sibille E, Lewis DA. Human postmortem brain research in mental illness syndromes. In: Charney DS, Nestler EJ. editors. Neurobiology of mental illness. Vol. 3e New York: Oxford University Press; c2009. p. 202–14. [Google Scholar]
- 4. Bianchi D, Gordon J, Koroshetz W. The NIH NeuroBioBank: addressing the urgent need for brain donation. 2017. https://www.nimh.nih.gov/news/science-news/2017/the-nih-neurobiobank-addressing-the-urgent-need-for-brain-donation.shtml.
- 5. Peters A, Palay SL, Webster DF. The fine structure of the nervous system. New York: Oxford University Press; 1991. [Google Scholar]
- 6. Zigmond MJ, Coyle J, Rowland L, editors. Neurobiology of brain disorders: biological basis of neurological and psychiatric disorders. 1st ed. San Diego: Academic Press; 2015. [Google Scholar]
- 7. Hayat MA. Principles and techniques of electron microscopy: biological applications. 4th ed. Cambridge: Cambridge University Press; 2000. [Google Scholar]
- 8. Hunter E. Practical electron microscopy: a beginner’s illustrated guide. 2nd ed. Cambridge: Cambridge University Press; 1993. [Google Scholar]
- 9. Henstridge CM, Jackson RJ, Kim JM, Herrmann AG, Wright AK, Harris SE, Bastin ME, Starr JM, Wardlaw J, Gillingwater TH, Smith C, McKenzie CA, Cox SR, Deary IJ, Spires-Jones TL. Post-mortem brain analyses of the Lothian Birth Cohort 1936: extending lifetime cognitive and brain phenotyping to the level of the synapse. Acta Neuropathol Commun. 2015;3:53. [DOI] [PMC free article] [PubMed] [Google Scholar]
- 10. Roberts RC, Barksdale KA, Roche JK, Lahti AC. Decreased synaptic and mitochondrial density in the postmortem anterior cingulate cortex in schizophrenia. Schizophr Res. 2015;168(1–2):543–53. [DOI] [PMC free article] [PubMed] [Google Scholar]
- 11. Kay KR, Smith C, Wright AK, Serrano-Pozo A, Pooler AM, Koffie R, Bastin ME, Bak TH, Abrahams S, Kopeikina KJ, McGuone D, Frosch MP, Gillingwater TH, Hyman BT, Spires-Jones TL. Studying synapses in human brain with array tomography and electron microscopy. Nat Protoc. 2013;8(7):1366–80. [DOI] [PMC free article] [PubMed] [Google Scholar]
- 12. Krause M, Brune M, Theiss C. Preparation of human formalin-fixed brain slices for electron microscopic investigations. Ann Anat. 2016;206:27–33. [DOI] [PubMed] [Google Scholar]
- 13. Wannamaker BB, Kornguth SE, Scott G, Dudley AW, Kelly A. Isolation and ultrastructure of human synaptic complexes. J Neurobiol. 1973;4(6):543–55. [DOI] [PubMed] [Google Scholar]
- 14. Zemmoura I, Blanchard E, Raynal PI, Rousselot-Denis C, Destrieux C, Velut S. How Klingler’s dissection permits exploration of brain structural connectivity? an electron microscopy study of human white matter. Brain Struct Funct. 2016;221(5):2477–86. [DOI] [PubMed] [Google Scholar]
- 15. Huttenlocher PR, Dabholkar AS. Regional differences in synaptogenesis in human cerebral cortex. J Comp Neurol. 1997;387:167–78. [DOI] [PubMed] [Google Scholar]
- 16. Glausier JR, Roberts RC, Lewis DA. Ultrastructural analysis of parvalbumin synapses in human dorsolateral prefrontal cortex. J Comp Neurol. 2017;525(9):2075–89. [DOI] [PMC free article] [PubMed] [Google Scholar]
- 17. Huttenlocher PR. Synaptic density in human frontal cortex—developmental changes and effects of aging. Brain Res. 1979;163:195–205. [DOI] [PubMed] [Google Scholar]
- 18. Patel KK, Hartmann JF, Cohen MM. Effect of pH on metabolism and ultrastructure of guinea pig cerebral cortex slices. Stroke. 1973;4(2):221–31. [DOI] [PubMed] [Google Scholar]
- 19. Lopes dos Santos B, Aparecida Del-Bel E, Pittella JEH, Tumas V. Influence of external factors on the preservation of human nervous tissue for histological studies: review article. J Bras Patol Med Lab. 2014;50(6):438–44. [Google Scholar]
- 20. Monoranu CM, Apfelbacher M, Grunblatt E, Puppe B, Alafuzoff I, Ferrer I, Al-Saraj S, Keyvani K, Schmitt A, Falkai P, Schittenhelm J, Halliday G, Kril J, Harper C, McLean C, Riederer P, Roggendorf W. pH measurement as quality control on human post mortem brain tissue: a study of the BrainNet Europe consortium. Neuropathol Appl Neurobiol. 2009;35(3):329–37. [DOI] [PMC free article] [PubMed] [Google Scholar]
- 21. Kingsbury AE, Foster OJF, Nisbet A, Cairns N, Bray L, Eve DJ, Lees AJ, Marsden CD. Tissue pH is an indicator of mRNA preservation in human post-mortem brain. Molecular Brain Research. 1995;28:311–8. [DOI] [PubMed] [Google Scholar]
- 22. Harrison PJ, Heath PR, Eastwood SL, Burnet PWJ, McDonald B, Pearson RCA. The relative importance of premortem acidosis and postmortem interval for human brain gene expression studies: selective mRNA vulnerability and comparison with their encoded proteins. Neurosci Lett. 1995;200:151–4. [DOI] [PubMed] [Google Scholar]
- 23. Volk DW, Eggan SM, Lewis DA. Alterations in metabotropic glutamate receptor 1alpha and regulator of G protein signaling 4 in the prefrontal cortex in schizophrenia. Am J Psychiatry. 2010;167(12):1489–98. [DOI] [PMC free article] [PubMed] [Google Scholar]
- 24. Sherwood K, Head M, Walker R, Smith C, Ironside JW, Fazakerley JK. A new index of agonal state for neurological disease. Neuropathol Appl Neurobiol. 2011;37(6):672–5. [DOI] [PubMed] [Google Scholar]
- 25. American Psychiatric Association. Diagnostic and statistical manual of mental disorders. 4th ed. (DSM-IV). Washington, DC: American Psychiatric Association; 1994. [Google Scholar]
- 26. Rajkowska G, Goldman-Rakic PS. Cytoarchitectonic definition of prefrontal areas in the normal human cortex: i. Remapping of areas 9 and 46 using quantitative criteria. Cereb Cortex. 1995;5:307–22. [DOI] [PubMed] [Google Scholar]
- 27. Gray EG. Axo-somatic and axo-dendritic synapses of the cerebral cortex: an electron microscopic study. J Anat. 1959;93:420–33. [PMC free article] [PubMed] [Google Scholar]
- 28. Chomiak T, Hu B. What is the optimal value of the g-ratio for myelinated fibers in the rat CNS? a theoretical approach. PLoS One. 2009;4(11):e7754. [DOI] [PMC free article] [PubMed] [Google Scholar]
- 29. Rushton WA. A theory of the effects of fibre size in medullated nerve. J Physiol. 1951;115(1):101–22. [DOI] [PMC free article] [PubMed] [Google Scholar]
- 30. Mannella CA. Structural diversity of mitochondria: functional implications. Ann N Y Acad Sci. 2008;1147:171–9. [DOI] [PMC free article] [PubMed] [Google Scholar]
- 31. Hackenbrock CR. Ultrastructural bases for metabolically linked mechanical activity in mitochondria. I. Reversible ultrastructural changes with change in metabolic steady state in isolated liver mitochondria. J Cell Biol. 1966;30(2):269–97. [DOI] [PMC free article] [PubMed] [Google Scholar]
- 32. Peters A, Folger C. A website entitled “the fine structure of the aging brain.” J Comp Neurol. 2013;521(6):1203–6. [DOI] [PMC free article] [PubMed] [Google Scholar]
- 33. Westrum LE. Electron microscopy of degeneration in the lateral olfactory tract and plexiform layer of the prepyriform cortex of the rat. Z Zellforsch Mikrosk Anat. 1969;98(2):157–87. [DOI] [PubMed] [Google Scholar]
- 34. Tigges M, Tigges J. Types of degenerating geniculocortical axon terminals and their contribution to layer IV of area 17 in the squirrel monkey. Cell Tissue Res. 1979;196:471–86. [DOI] [PubMed] [Google Scholar]
- 35. Jones EG, Powell TP. An electron microscopic study of terminal degeneration in the neocortex of the cat. Philos Trans R Soc Lond B Biol Sci. 1970;257(812):29–43. [DOI] [PubMed] [Google Scholar]
- 36. G Grant, F Walberg, editors. The light and electron microscopical appearance of anterograde and retrograde neuronal degeneration. International Symposium on Dynamics of Degeneration and Growth in Neurons; 1973; Stockholm, Sweden Oxford, England: Pergamon Press Ltd.; May 1973;5–18. [Google Scholar]
- 37. Feldman ML, Peters A. Ballooning of myelin sheaths in normally aged macaques. J Neurocytol. 1998;27(8):605–14. [DOI] [PubMed] [Google Scholar]
- 38. Peters A. The effects of normal aging on myelinated nerve fibers in monkey central nervous system. Front Neuroanat. 2009;3:11. [DOI] [PMC free article] [PubMed] [Google Scholar]
- 39. Perez-Costas E, Melendez-Ferro M, Roberts RC. Microscopy techniques and the study of synapses. In: Méndez-Vilas A, Díaz J. editors. Modern research and educational topics in microscopy. Badajoz, Spain: Formatex; c2007. p. 164–70. [Google Scholar]
- 40. Roberts RC, Kung L. Using CNS tissue in psychiatric research. In: Dean B, Hyde TM, Kleinman JE. editors. The processing and use of postmortem human brain tissue for electron microscopy. Amsterdam: Harwood Academic Publishers; c1999. p. 127–40. [Google Scholar]
- 41. Henstridge CM, Sideris DI, Carroll E, Rotariu S, Salomonsson S, Tzioras M, McKenzie CA, Smith C, von Arnim CAF, Ludolph AC, Lule D, Leighton D, Warner J, Cleary E, Newton J, Swingler R, Chandran S, Gillingwater TH, Abrahams S, Spires-Jones TL. Synapse loss in the prefrontal cortex is associated with cognitive decline in amyotrophic lateral sclerosis. Acta Neuropathol. 2018;135:213–226. [DOI] [PMC free article] [PubMed] [Google Scholar]
- 42. Scheff SW, Price DA, Sparks DL. Quantitative assessment of possible age-related change in synaptic numbers in the human frontal cortex. Neurobiol Aging. 2001;22(3):355–65. [DOI] [PubMed] [Google Scholar]
- 43. Scheff SW, DeKosky ST, Price DA. Quantitative assessment of cortical synaptic density in Alzheimer’s disease. Neurobiol Aging. 1990;11(1):29–37. [DOI] [PubMed] [Google Scholar]
- 44. Cragg BG. The density of synapses and neurons in normal, mentally defective and ageing human brains. Brain. 1975;98:81–90. [DOI] [PubMed] [Google Scholar]
- 45. Henstridge CM, Pickett E, Spires-Jones TL. Synaptic pathology: a shared mechanism in neurological disease. Ageing Res Rev. 2016;28:72–84. [DOI] [PubMed] [Google Scholar]
- 46. Pavlov D, Muhlrad A, Cooper J, Wear M, Reisler E. Severing of F-actin by yeast cofilin is pH-independent. Cell Motil Cytoskeleton. 2006;63(9):533–42. [DOI] [PMC free article] [PubMed] [Google Scholar]
- 47. Crevenna AH, Naredi-Rainer N, Schonichen A, Dzubiella J, Barber DL, Lamb DC, Wedlich-Soldner R. Electrostatics control actin filament nucleation and elongation kinetics. J Biol Chem. 2013;288(17):12102–13. [DOI] [PMC free article] [PubMed] [Google Scholar]
- 48. Goldman SA, Pulsinelli WA, Clarke WY, Kraig RP, Plum F. The effects of extracellular acidosis on neurons and glia in vitro. J Cereb Blood Flow Metab. 1989;9(4):471–7. [DOI] [PMC free article] [PubMed] [Google Scholar]
- 49. Kraig RP, Petito CK, Plum F, Pulsinelli WA. Hydrogen ions kill brain at concentrations reached in ischemia. J Cereb Blood Flow Metab. 1987;7(4):379–86. [DOI] [PMC free article] [PubMed] [Google Scholar]
- 50. Petito CK, Kraig RP, Pulsinelli WA. Light and electron microscopic evaluation of hydrogen ion-induced brain necrosis. J Cereb Blood Flow Metab. 1987;7(5):625–32. [DOI] [PMC free article] [PubMed] [Google Scholar]
- 51. Liu XB, Schumann CM. Optimization of electron microscopy for human brains with long-term fixation and fixed-frozen sections. Acta Neuropathol Commun. 2014;2:42. [DOI] [PMC free article] [PubMed] [Google Scholar]
- 52. Zikopoulos B, Garcia-Cabezas MA, Barbas H. Parallel trends in cortical gray and white matter architecture and connections in primates allow fine study of pathways in humans and reveal network disruptions in autism. PLoS Biol. 2018;16(2):e2004559. [DOI] [PMC free article] [PubMed] [Google Scholar]
- 53. Peters A, Sethares C, Luebke JI. Synapses are lost during aging in the primate prefrontal cortex. Neuroscience. 2008;152(4):970–81. [DOI] [PMC free article] [PubMed] [Google Scholar]
- 54. Hsu A, Luebke JI, Medalla M. Comparative ultrastructural features of excitatory synapses in the visual and frontal cortices of the adult mouse and monkey. J Comp Neurol. 2017;525(9):2175–91. [DOI] [PMC free article] [PubMed] [Google Scholar]
- 55. Medalla M, Gilman JP, Wang JY, Luebke JI. Strength and diversity of inhibitory signaling differentiates primate anterior cingulate from lateral prefrontal cortex. J Neurosci. 2017;37(18):4717–34. [DOI] [PMC free article] [PubMed] [Google Scholar]
- 56. Liu J, Dietz K, DeLoyht JM, Pedre X, Kelkar D, Kaur J, Vialou V, Lobo MK, Dietz DM, Nestler EJ, Dupree J, Casaccia P. Impaired adult myelination in the prefrontal cortex of socially isolated mice. Nat Neurosci. 2012;15(12):1621–3. [DOI] [PMC free article] [PubMed] [Google Scholar]


