

Abstract
Introduction:
Medication nonadherence is the most common issue observed in the management of diabetes because of complex and lifelong therapy. The study aimed to assess the effect of pharmacist-directed counseling and daily text message reminder on medication adherence and clinical profile of patients with type II diabetes.
Materials and Methods:
This prospective, open-labeled, randomized control trial was carried out in outpatient medical department of a secondary care referral hospital. A total of 330 patients who met study criteria were enrolled and randomized into an intervention group (n = 165), received counseling and daily messages about medication intake and control group (n = 165), and usual care by physician. Medication adherence and clinical outcomes such as glycosylated hemoglobin (HbA1C), systolic blood pressure (SBP), low-density lipoprotein (LDL) cholesterol, triglyceride (TG) levels, and body mass index (BMI) were recorded at baseline and follow-up visits. Two-sample Wilcoxon rank sum test was used to compare the mean difference of medication adherence and paired t-test was used to compare clinical outcomes.
Results and Discussion:
The mean age of intervention and control groups were 57.1 ± 8.55 and 58.5 ± 8.53 years, respectively. The mean difference of medication adherence from baseline to second follow-up visit was significantly more in intervention group (12.2 ± 7.1%) compared to that in control group (0.75 ± 10.2 %) with a P < 0.001. From baseline to second follow-up visit, HbA1C (7.79 ± 0.67 to 6.91 ± 0.83 %), SBP (136.75 ± 20.09 to 126.23 ± 18.22 mm Hg), and LDL cholesterol (104.14 ± 26.23 to 98.29 ± 20.87 mg/dL) levels were significantly reduced in intervention group compared to that in control group with a P < 0.01. No significant improvement was observed in TG (169± 33.71 to 168 65 ± 33.90 mg/dL) and BMI (27.9 ± 4.21 to 27.1 ± 3.12 Kg/m2) levels from baseline to second follow-up visit.
Conclusion:
Pharmacist-directed patient counseling combined with message reminder showed a greater effect on the improvement of medication adherence and control of glycemia, blood pressure, and lipid profile in diabetes.
KEYWORDS: Diabetes, medication adherence, patient counseling, pill count, text message, visual analog scale
INTRODUCTION
Diabetes mellitus (DM) is a group of metabolic disorders characterized by high blood glucose levels. People with persistent high blood glucose levels are at higher risk to develop micro- and macrovascular complications, resulting in increased health-care costs, higher mortality, and reduced quality of life (QoL).[1] According to the recent census of International Diabetes Federation (IDF), it was estimated that in 2017, there were 451 million people living with diabetes worldwide. In 2045, it is expected to increase to 693 million.[2] Over the past decade, the prevalence of diabetes was drastically raised in low- and middle-income countries compared to that in high-income countries. This rise in the global prevalence of diabetes posed a great challenge to health-care system. India is a lower-middle economy country, which ranks in the top second in global diabetic population. According to IDF, in 2015, 69.2 million cases were reported in India.[3] The prevalence of diabetes was increasing in India, initially diabetes was considered as a rich man’s disease but now the scenario has changed as everyone was getting diabetes because of changes in lifestyle, sedentary occupation, and irregular food habits.[4]
Type II DM is a chronic metabolic disorder, which requires a lifelong pharmacological and non-pharmacological management of glycemia, lipid profile, and blood pressure to control the disease severity and to prevent premature death because of diabetic complications.[5] However, nearly 50% of the type II DM population do not reach guideline-recommended treatment target values.[6] In 2015, over 0.9 million deaths are attributed in India due to diabetes and its complications.[7] The situation is turning from bad to worse, so immediate action with novel strategies of diabetic care is required to handle this situation.
Pharmacist-provided diabetic care services have been recognized as a cornerstone for improving the knowledge, medication adherence, clinical outcomes, and health-related quality of life (HRQoL) in various settings across the world.[8] Evidence on the effect of pharmacist-mediated counseling in the management of type II DM was lacking in rural settings of India. Most of the available evidence reinforced the involvement of pharmacist in achieving normal glycemia. There was a lack of evidence about the role of pharmacist in diabetes-associated long-term complication by controlling modifiable risk factors such as blood pressure, lipid profile, and body mass index (BMI).
Today mobile phone usage has drastically increased, irrespective of region or country, urban area or rural area, and literacy or illiteracy. An evidence suggesting that a mobile phone text message can serve as a simple and cost-effective option in improving medication adherence and clinical outcomes by providing information between clinic visits has been reported.[9] In India, studies related to text message coupled with pharmacist-mediated counseling services are less compared to that in western countries.[10] The study was conducted with an objective to evaluate the impact of pharmacist-directed patient counseling and mobile phone message reminder services on medication adherence and clinical outcome measures in type II DM compared to usual care.
MATERIALS AND METHODS
This prospective, open-labeled, randomized control trial was carried out in outpatient medical department of a secondary care referral hospital, which was located in resource limited settings in Anantapuramu District, Andhra Pradesh, India. The study was conducted after getting approval from the institutional review board (IRB) with a number of RIPER/IRB/2016/020 and in accordance with Good Clinical Practice and CONSORT guidelines. The study was carried out for 6 months from November 2016 to October 2017. Patients with type II diabetes, aged between 18 and 75 years, on glucose-lowering oral and/or injectable drugs, able to read text messages in English/Telugu language, and owning any model of mobile phone with access to text message service were included in the study. Patients having type 1 diabetes and other medical conditions such as dialysis, cancer, pregnancy, and those who were unwilling were excluded from the study. Patients who met study criteria were clearly explained about the nature and purpose of the study. A verbal and written informed consent was obtained before enrollment of subjects in the study.
Sample size determination
The sample size was calculated by Epi Info software, by considering 80% power, 5% margin of error, and 0.7% difference in mean glycosylated hemoglobin (HbA1C) change between the intervention and control groups. After accounting 50% dropout rate, 165 patients were needed in each group.
A total of 964 patients were approached to participate in the study, of which 330 patients who met study criteria were enrolled and randomized into intervention (n = 165) and control (n = 165) group by simple randomization technique. In intervention group, 14 and in control group, 10 participants failed to show up for follow-up visits. A total of 151 in intervention and 155 in the control group were subjected to data analysis. The flowchart of participants is shown in Figure 1.
Figure 1.
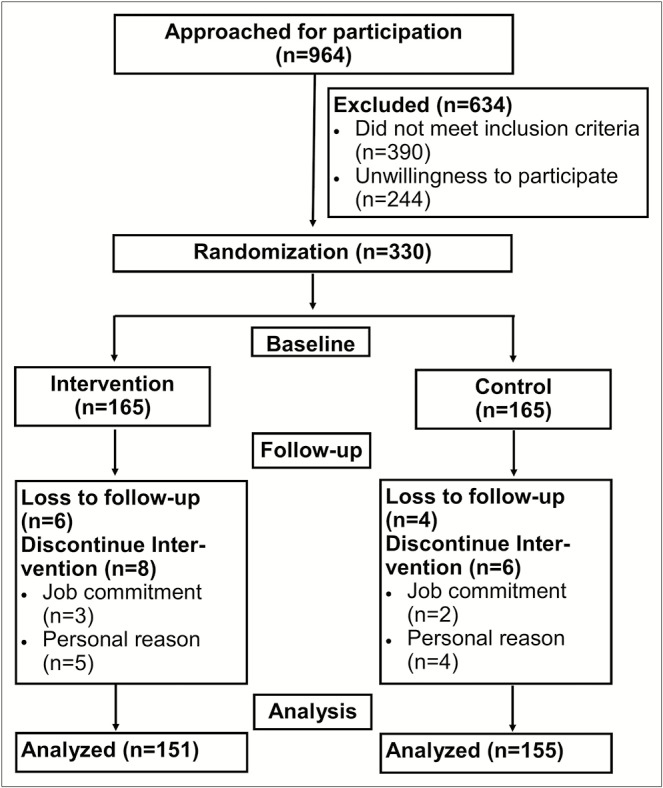
Flowchart of the participants
A suitable pre-validated data collection form was used to collect baseline sociodemographic characteristics such as age, gender, marital status, educational status, occupation, BMI, comorbidities, and duration of diabetes of the study participants. Patients in the intervention group were provided with a face-to-face counseling by the pharmacist and it was assisted by sending a text message daily in Telugu/English language. Patients in the control group followed usual care given by the concerned physician. The complete study was divided into three visits: baseline, first follow-up (after 3 months), and second follow-up (after 6 months). At each visit, medication adherence levels and clinical outcomes were measured in both intervention and control group. Finally, the effect of pharmacist-directed patient counseling and text message services on medication adherence and clinical outcomes was determined by comparing two groups at each follow-up visit.
Pharmacist-directed patient counseling
In intervention group, pharmacist provided a face-to-face counseling regarding knowledge on diabetes, self-monitoring of blood glucose, regular checkup of systolic blood pressure (SBP), body weight, and serum cholesterol levels. The pharmacist also gave counseling regarding non-pharmacological management strategies such as diet control, exercise therapy, and early identification of symptoms of hypoglycemia (blurred vision, rapid heartbeat, sweating, fatigue, headache, dizziness, trouble thinking, seizures, and coma) and its management. At the end of the counseling, all patients were educated regarding antidiabetic medications, their indications, adverse effects, contraindications, warnings/precautions, drug interactions, pregnancy risk factors, and storage. In the counseling session, the pharmacist also attempted to improve medication adherence in patients with diabetes by tailoring the medication administration time and dosage according to patient need. They were also educated regarding the importance of medication and dietary adherence and complications (microvascular, macrovascular, and diabetic foot) of nonadherence. Intervention group patients participated in all three counseling sessions: baseline, first, and second follow-up, whereas control group received usual care given by physician.
Mobile phone text message service
In the intervention group, mobile phone text message about medication intake was sent just before 30 min of due dosage time and reminder about aerobic exercises early morning and evening. The messages were sent every day for 6 months from the start date to the end date of the study period. All costs for sending mobile phone text messages were borne by the study team.
Medication adherence measurement
Baseline medication adherence levels of past 1 month were assessed in both intervention and control groups by using a pill count and visual analog scale (VAS) methods. In the pill count method, a number of pills consumed were calculated by the number of remaining pills with the patient and the percentage of medication adherence was calculated as the number of pills consumed in relation to the number of pills prescribed. In the VAS method, the patients were asked to mark their medication adherence rate for past 1 month on the scale. The scale comprises grading from zero to 10. In this, zero indicates no adherence and 10 indicates 100% adherence to the medications.[11] Medication adherence levels were measured in both intervention and control group at baseline, first follow-up (after 3 months), and second follow-up (after 6 months) of the study.
Clinical outcome measures
The clinical outcome measures including surrogate end points, such as HbA1C, SBP, low-density lipoprotein (LDL), triglyceride (TG), and BMI, were collected from medical records at baseline, first, and second follow-up visits in both intervention and control group.
STATISTICAL ANALYSIS
GraphPad Prism, version 6.04, software (La Jolla, California), was used to analyze collected data from all participants. Descriptive statistics such as mean, standard deviation, frequency, and proportion were used to represent baseline sociodemographic, clinical, medication adherence, and outcome profile of the study participants.
Z-test was used to match the sociodemographic and mobile phone use profile between test and control groups. Two-sample Wilcoxon rank sum (Mann–Whitney) test was used to compare the mean difference of medication adherence levels (measured by pill count and VAS method) between two groups at each follow-up visit.
An unpaired t-test was performed to compare the HbA1C, SBP, LDL, TG, and BMI levels between the intervention and control groups at each follow-up visit. P < 0.05 was considered as a statistically significant result.
RESULTS
The mean age of intervention and control groups was 57.4 ± 8.9 and 59.2 ± 8.7 years, respectively. A total of 112 (33.9%) study participants were having either one or more comorbidities. Hypertension and coronary artery disease (CAD) were the most common comorbid conditions observed in both intervention and control groups. Most of the patients in intervention (78; 47.3%) and control (75; 45.4%) group were having diabetes for more than 10 years. Sociodemographic characteristics, such as gender, marital status, education, occupation, comorbidities, and duration of diabetes, were closely matched in intervention and control groups as depicted in Table 1.
Table 1.
Baseline sociodemographics and clinical profile of study participants
| Variables | Intervention (n = 165) | Control (n = 165) | Total (n = 330) | Z-score | P value |
|---|---|---|---|---|---|
| Frequency (%) | Frequency (%) | Frequency (%) | |||
| Mean age (±SD) | 57.4 ± 8.9 | 59.2 ± 8.7 | 58.8 ± 8.5 | - | 0.23 |
| Gender | |||||
| Male | 85 (51.5) | 86 (52.1) | 171 (51.8) | 0.110 | 0.9124 |
| Female | 80 (48.5) | 79 (47.9) | 159 (48.2) | 0.110 | 0.9124 |
| Marital status | |||||
| Single | 28 (16.9) | 30 (18.2) | 58 (17.6) | 0.289 | 0.7718 |
| Married | 131 (79.4) | 128 (78.2) | 260 (78.8) | 0.269 | 0.7871 |
| Others | 06 (3.6) | 07 (3.6) | 12 (3.6) | 0.283 | 0.7794 |
| Education | |||||
| No education | 127 (76.9) | 125 (75.7) | 252 (76.4) | 0.259 | 0.7948 |
| Primary school | 22 (13.3) | 24 (14.5) | 46 (13.9) | 0.317 | 0.7489 |
| High school | 10 (6.0) | 13 (7.8) | 23 (6.9) | 0.648 | 0.5157 |
| College/university | 06 (3.6) | 03 (1.8) | 09 (2.7) | 1.013 | 0.3125 |
| Occupation | |||||
| Farmer | 91 (55.1) | 92 (55.7) | 183 (55.4) | 0.110 | 0.9124 |
| Housewife | 27 (16.3) | 29 (17.6) | 56 (16.9) | 0.293 | 0.7718 |
| Private job | 32 (19.4) | 31 (18.7) | 63 (19.1) | 0.140 | 0.8886 |
| Government job | 05 (3.0) | 04 (2.4) | 09 (2.7) | 0.338 | 0.7278 |
| Others | 10 (6.0) | 09 (5.4) | 19 (5.7) | 0.236 | 0.8103 |
| BMI (kg/m2) | 27.9 ± 4.2 | 28.0 ± 4.4 | 27.9 ± 4.4 | - | 0.9253 |
| One or more comorbidities | 54 (32.7) | 58 (35.1) | 112 (33.9) | 0.465 | 0.6383 |
| 31 (18.8) | 32 (19.4) | 63 (19.1) | 0.140 | 0.8886 | |
| Hypertension | 14 (8.5) | 13 (7.8) | 27 (8.2) | 0.200 | 0.8414 |
| Heart failure | 28 (16.9) | 26 (15.7) | 54 (16.4) | 0.297 | 0.7641 |
| CAD | 7 (4.2) | 6 (3.6) | 13 (3.9) | 0.283 | 0.7794 |
| Myocardial infraction | 8 (4.8) | 9 (5.4) | 17 (5.1) | 0.249 | 0.8025 |
| Stroke | 16 (9.7) | 14 (8.5) | 30 (9.1) | 0.383 | 0.7039 |
| COPD | 12 (7.3) | 10 (6.0) | 22 (6.6) | 0.441 | 0.6511 |
| Asthma | 8 (4.8) | 9 (5.4) | 17 (5.1) | 0.249 | 0.8025 |
| Duration of diabetes (years) | |||||
| ≤2 years | 38 (23.0) | 34 (20.6) | 72 (21.8) | 0.533 | 0.5961 |
| 3–9 years | 49 (29.7) | 41 (24.8) | 90 (27.3) | 0.988 | 0.3221 |
| ≥10 years | 78 (47.3) | 75 (45.4) | 153 (46.4) | 0.331 | 0.7414 |
SD = standard deviation, Intervention = pharmacist-directed counseling with mobile message reminder, Control = usual care by physician, COPD = chronic obstructive pulmonary disease
The mobile phone user outline of the study participants in the intervention and control was similar, except the control group stated a high number of messages received from relatives (P = 0.006) and bank notification (P = 0.009). The intervention group revealed a higher number of messages from cricket alerts (P = 0.02) as shown in Table 2.
Table 2.
Mobile phone use profile among study population
| Characteristic | Intervention (n = 165) | Control (n = 165) | Total (n = 330) | Z-test | P value | |
|---|---|---|---|---|---|---|
| Frequency (%) | Frequency (%) | Frequency (%) | ||||
| Use of two mobiles | ||||||
| Yes | 41 (24.8) | 35 (21.2) | 76 (23.0) | 0.746 | 0.453 | |
| No | 124 (75.1) | 130 (78.8) | 254 (76.9) | 0.746 | 0.453 | |
| Habit of sending SMS | ||||||
| Yes | 65 (39.4) | 59 (35.7) | 124 (37.6) | 0.757 | 0.447 | |
| No | 100 (60.6) | 106 (64.2) | 206 (62.4) | 0.757 | 0.447 | |
| Habit of sending SMS with images | ||||||
| Yes | 33 (20.0) | 21 (12.7) | 54 (16.4) | 1.848 | 0.646 | |
| No | 132 (80.0) | 144 (87.3) | 276 (83.6) | 1.848 | 0.646 | |
| Habit of reading SMS | ||||||
| Yes | 141 (85.4) | 132 (80.0) | 273 (82.7) | 1.524 | 0.128 | |
| No | 24 (14.5) | 33 (20.0) | 57 (17.3) | 1.524 | 0.128 | |
| Usually receive SMS from | ||||||
| Relatives | 111 (67.3) | 132 (80.0) | 243 (73.6) | 2.745 | 0.006 | |
| Friends | 77 (46.6) | 67 (40.6) | 144 (43.6) | 1.162 | 0.246 | |
| Advertisement | 11 (6.6) | 10 (6.1) | 21 (6.4) | 0.215 | 0.826 | |
| News | 7 (4.2) | 6 (3.6) | 13 (3.9) | 0.264 | 0.795 | |
| Cricket | 22 (13.3) | 10 (6.1) | 32 (9.7) | 2.311 | 0.020 | |
| Bank | 49 (29.7) | 30 (18.2) | 79 (23.9) | 2.581 | 0.009 | |
| Others | 20 (12.1) | 19 (11.5) | 39 (11.8) | 0.321 | 0.748 | |
| Payment type | ||||||
| Prepaid | 146 (88.5) | 140 (84.8) | 286 (86.6) | 1.094 | 0.276 | |
| Postpaid | 19 (11.5) | 25 (15.1) | 44 (13.3) | 1.094 | 0.276 | |
Intervention = pharmacist-directed counseling with mobile message reminder, Control = usual care by physician, SMS = short message service
At baseline, medication adherence levels measured by pill count method were closely similar in both intervention (83.4 ± 7.3) and control group (82.35 ± 6.4), whereas these levels were improved in the intervention group (94.2 ± 6.0, 96.6 ± 2.25) compared to control group (82.2 ± 8.5, 81.6 ± 8.1) in both first and second follow-up visits. Medication adherence measured by VAS method also revealed a raise in adherence level in the intervention group compared to control group in follow-up visits as depicted in Table 3.
Table 3.
Distribution of medication adherence levels in two groups at each follow-up visit
| Groups | Baseline (mean ± SD) | First follow-up (mean ± SD) | Second follow-up (mean ± SD) |
|---|---|---|---|
| Mean medication adherence levels at each visit by pill count method | |||
| Intervention | 83.4 ± 7.3 | 94.2 ± 6.0 | 96.6 ± 2.25 |
| Control | 82.35 ± 6.4 | 82.2 ± 8.5 | 81.6 ± 8.1 |
| Mean medication adherence levels at each visit by VAS method | |||
| Intervention | 79.8 ± 5.2 | 86.9 ± 3.3 | 91.7 ± 3.7 |
| Control | 80.1 ± 4.9 | 80.9 ± 3.8 | 80.5 ± 3.0 |
SD = standard deviation, Intervention = pharmacist-directed counseling with mobile message reminder, Control = usual care by physician
The mean medication adherence difference (measured by pill count method) was higher in the intervention group (10.7 ± 6.1, 12.2 ± 7.1) during baseline to first follow-up and baseline to second follow-up visits, compared to control group (0.08 ± 5.7, 0.75 ± 10.2) with a P < 0.001. The VAS method also showed a high mean medication adherence difference in the intervention group compared to control group with a P < 0.001 as shown in Table 4.
Table 4.
Comparison of difference in medication adherence levels between two groups at each follow-up visit
| Visits | Intervention (mean ± SD) | Control (mean ± SD) | P value | Z value |
|---|---|---|---|---|
| Pill count method | ||||
| Baseline to first follow-up | 10.7 ± 6.1 | 0.08 ± 5.7 | <0.001 | 10.464 |
| Baseline to second follow-up | 12.2 ± 7.1 | 0.75 ± 10.2 | <0.001 | 13.027 |
| VAS method | ||||
| Baseline to first follow-up | 7.2 ± 6.3 | 0.83 ± 5.77 | <0.001 | 8.65 |
| Baseline to second follow-up | 11.8 ± 6.6 | 0.5 ± 5.89 | <0.001 | 13.147 |
SD = standard deviation, Intervention = pharmacist-directed counseling with mobile message reminder, Control = usual care by physician
In the intervention group, the mean HbA1C, SBP, and LDL-cholesterol levels were significantly reduced compared to usual care in first and second follow-up visits with a P < 0.05. No significant difference was observed in the TG levels and BMI of intervention group compared to usual care in first and second follow-up visits as shown in Table 5.
Table 5.
Comparison of glycosylated hemoglobin, systolic blood pressure, low-density lipoprotein cholesterol, and triglyceride between intervention and control
| Variable | Intervention (n = 151) | Control (n = 155) | P value |
|---|---|---|---|
| HbA1C (%) | |||
| Baseline | 7.79 ± 0.67 | 7.78 ± 0.67 | 0.9691 |
| First follow-up | 7.32 ± 0.62 | 7.59 ± 0.73 | 0.0038 |
| Second follow-up | 6.91 ± 0.83 | 7.49 ± 1.02 | 0.0023 |
| SBP (mm Hg) | |||
| Baseline | 136.75 ± 20.09 | 136.82 ± 19.23 | 0.8423 |
| First follow-up | 130.18 ± 14.21 | 135.23 ± 16.21 | 0.0013 |
| Second follow-up | 126.23 ± 18.22 | 135.62 ± 17.24 | 0.0001 |
| LDL–cholesterol (mg/dL) | |||
| Baseline | 104.14 ± 26.23 | 103.29 ± 25.24 | 0.8165 |
| First follow-up | 100.36 ± 21.23 | 102.36 ± 24.81 | 0.0034 |
| Second follow-up | 98.29 ± 20.87 | 102.67 ± 23.34 | 0.0021 |
| TG (mg/dL) | |||
| Baseline | 169.24 ± 33.71 | 170.12 ± 38.21 | 0.9261 |
| First follow-up | 168.12 ± 32.45 | 169.68 ± 29.56 | 0.1241 |
| Second follow-up | 168 65 ± 33.90 | 169.23 ± 30.82 | 0.2184 |
| BMI (Kg/m2) | |||
| Baseline | 27.9 ± 4.21 | 28.0 ± 4.45 | 0.9253 |
| First follow-up | 27.3 ± 4.02 | 27.8 ± 3.89 | 0.3243 |
| Second follow-up | 27.1 ± 3.12 | 27.5 ± 3.44 | 0.1286 |
SD = standard deviation, Intervention = pharmacist-directed counseling with mobile message reminder, Control = usual care by physician
DISCUSSION
Globally, pharmacist-mediated patient counseling had proven to improve health outcomes in type II DM, this was reinforced by daily mobile phone text message reminder about medication intake.[12,13] The messages have distinct benefits in terms of reducing interferences into the patient’s life and their relative easiness and low cost compared to voice communication.[14] Post-counseling session combined with the daily message reminder will greatly improve medication adherence levels and clinical outcomes in type II diabetes. There is a lack of evidence about counseling combined with message reminder in patients with type II DM who are residing in rural settings of India. This study will generate an evidence on the effect of pharmacist-mediated counseling with daily mobile phone text message reminder on medication adherence and clinical outcomes in type II diabetes.
In this study, the mean age of study participants was 58.8 ± 8.5 years, and most of the patients had hypertension (63; 19.1%) and CAD (54; 16.4%) as comorbid condition. Similar type of findings was also observed in a study conducted by Huang et al.[15] There is no gold standard method to assess medication adherence levels, every method has its own acceptable error in the measurement of medication adherence. This study used both pill count and VAS method in the assessment of medication adherence, which will increase the reliability of the results. Medication adherence levels measured by pill count and VAS method were increased in the intervention group from baseline to first and second follow-up visits compared to usual care with a P < 0.001. These findings were parallel to the findings of a study conducted by Vervloet et al.[16]
The study findings show that the mean HbA1C was significantly reduced in the intervention group (7.32 ± 0.62%, 6.91 ± 0.83%) compared to control group (7.59 ± 0.73%, 7.49 ± 1.02%) in first and second follow-up visits with a P < 0.01. These findings are nearly similar to the results of a diabetic study conducted by Shareef et al.[17] Other outcomes such as SBP and LDL-cholesterol are also significantly reduced in the intervention group compared to usual care with a P < 0.01. These findings are consistent with the results of the study conducted by Shao et al.[18] Most of the findings of this study support that pharmacist-mediated patient counseling combined with daily message reminder will have a great impact on medication adherence and clinical outcomes. No significant reduction has been observed in TG levels in the intervention group compared to control group. Long-term follow-up is required to observe changes in the TG levels.
STRENGTHS AND WEAKNESSES
This study offers insights for improving medication adherence levels in diabetes by adopting patient counseling with message reminder system in diabetes management policies. Pill count and VAS methods will not give accurate values about medication adherence. Still, there is a need to develop novel techniques to measure and improve the medication adherence, which will further improve the outcomes of the diabetes. The study was conducted in outpatient department, so extrapolation of these findings in all settings of patients with diabetes is not possible.
CONCLUSION
Pharmacist-directed patient counseling combined with message reminder has shown a greater effect on improvement of medication adherence and control of glycemia, blood pressure, and lipid profile in patients with diabetes. Post-counseling aid with message reminder technique is very simple, effective, and has low interference with patients’ lives in improving adherence toward prescribed medications. This study emphasizes the role of pharmacist as a good counselor in diabetes, and technology usage in disease management plays a vital role in achieving definite outcomes.
Financial support and sponsorship
Nil.
Conflicts of interest
There are no conflicts of interest.
Acknowledgement
We would like to thank Dr. Sudheer Kumar, Director, Rural Development Trust Hospital, Bathalapalli, Andhra Pradesh, India. We are wholeheartedly thankful to study participants and people who were directly or indirectly responsible for the completion of the work.
REFERENCES
- 1.Baena-Díez JM, Peñafiel J, Subirana I, Ramos R, Elosua R, Marín-Ibañez A, et al. FRESCO Investigators. Risk of causespecific death in individuals with diabetes: a competing risks analysis. Diabetes Care. 2016;39:1987–95. doi: 10.2337/dc16-0614. [DOI] [PubMed] [Google Scholar]
- 2.Ogurtsova K, da Rocha Fernandes JD, Huang Y, Linnenkamp U, Guariguata L, Cho NH, et al. IDF diabetes atlas: global estimates for the prevalence of diabetes for 2015 and 2040. Diabetes Res Clin Pract. 2017;128:40–50. doi: 10.1016/j.diabres.2017.03.024. [DOI] [PubMed] [Google Scholar]
- 3.Whiting DR, Guariguata L, Weil C, Shaw J. IDF diabetes atlas: global estimates of the prevalence of diabetes for 2011 and 2030. Diabetes Res Clin Pract. 2011;94:311–21. doi: 10.1016/j.diabres.2011.10.029. [DOI] [PubMed] [Google Scholar]
- 4.Ramanath K, Santhosh YL. Impact of clinical pharmacist provided patient education on QOL outcome in type 2 diabetes mellitus in rural population. Asian J Pharm Clin Res. 2011;4:15–20. [Google Scholar]
- 5.Ofori SN, Unachukwu CN. Holistic approach to prevention and management of type 2 diabetes mellitus in a family setting. Diabetes Metab Syndr Obes. 2014;7:159–68. doi: 10.2147/DMSO.S62320. [DOI] [PMC free article] [PubMed] [Google Scholar]
- 6.Marín-Peñalver JJ, Martín-Timón I, Sevillano-Collantes C, Del Cañizo-Gómez FJ. Update on the treatment of type 2 diabetes mellitus. World J Diabetes. 2016;7:354–95. doi: 10.4239/wjd.v7.i17.354. [DOI] [PMC free article] [PubMed] [Google Scholar]
- 7.Majgi SM, Sreekumar ALA, Balagopal A, Nivedha S. Study on self care and adherence to therapy among diabetic patients at a tertiary care center in Mysore. Int J Community Med Public Health. 2017;4:3903–8. [Google Scholar]
- 8.Mamaghanian A, Shamshirgaran SM, Aiminisani N, Aliasgarzadeh A. Clinico-epidemiological factors of health related quality of life among people with type 2 diabetes. World J Diabetes. 2017;8:407–13. doi: 10.4239/wjd.v8.i8.407. [DOI] [PMC free article] [PubMed] [Google Scholar]
- 9.Peimani M, Rambod C, Omidvar M, Larijani B, Ghodssi-Ghassemabadi R, Tootee A, et al. Effectiveness of short message service-based intervention (SMS) on self-care in type 2 diabetes: a feasibility study. Prim Care Diabetes. 2016;10:251–8. doi: 10.1016/j.pcd.2015.11.001. [DOI] [PubMed] [Google Scholar]
- 10.Dick JJ, Nundy S, Solomon MC, Bishop KN, Chin MH, Peek ME. Feasibility and usability of a text message-based program for diabetes self-management in an urban African-American population. J Diabetes Sci Technol. 2011;5:1246–54. doi: 10.1177/193229681100500534. [DOI] [PMC free article] [PubMed] [Google Scholar]
- 11.Goruntla N, Mallela VJ, Nayakanti D. Impact of one-dose package dispensing with patient counseling on medication adherence in geriatrics suffering from chronic disorders. CHRISMED J Health Res. 2018;5:18–22. [Google Scholar]
- 12.Cocosila M, Archer N, Haynes RB, Yuan Y. Can wireless text messaging improve adherence to preventive activities? Results of a randomised controlled trial. Int J Med Inform. 2009;78:230–8. doi: 10.1016/j.ijmedinf.2008.07.011. [DOI] [PubMed] [Google Scholar]
- 13.Kim HS, Kim NC, Ahn SH. Impact of a nurse short message service intervention for patients with diabetes. J Nurs Care Qual. 2006;21:266–71. doi: 10.1097/00001786-200607000-00012. [DOI] [PubMed] [Google Scholar]
- 14.Awiti PO, Grotta A, van der Kop M, Dusabe J, Thorson A, Mwangi J, et al. The effect of an interactive weekly mobile phone messaging on retention in prevention of mother to child transmission (PMTCT) of HIV program: study protocol for a randomized controlled trial (WELTEL PMTCT) BMC Med Inform Decis Mak. 2016;16:86. doi: 10.1186/s12911-016-0321-4. [DOI] [PMC free article] [PubMed] [Google Scholar]
- 15.Huang HL, LI YC, Chou YC, Hsieh YW, Kuo F, Tsai WC, et al. Effects of and satisfaction with short message service reminders for patient medication adherence: a randomized controlled study. BMC Med Inform Decis Mak. 2013;127:3–12. doi: 10.1186/1472-6947-13-127. [DOI] [PMC free article] [PubMed] [Google Scholar]
- 16.Vervloet M, van Dijk L, Santen-Reestman J, van Vlijmen B, van Wingerden P, Bouvy ML, et al. SMS reminders improve adherence to oral medication in type 2 diabetes patients who are real time electronically monitored. Int J Med Inform. 2012;81:594–604. doi: 10.1016/j.ijmedinf.2012.05.005. [DOI] [PubMed] [Google Scholar]
- 17.Shareef J, Fernandes J, Samaga L, Bhat ML. Evaluating the effect of pharmacist’s delivered counseling on medication adherence and glycemic control in patients with diabetes mellitus. J Diabetes Metab. 2016;7:1–4. [Google Scholar]
- 18.Shao H, Chen G, Zhu C, Chen Y, Liu Y, He Y, et al. Effect of pharmaceutical care on clinical outcomes of outpatients with type 2 diabetes mellitus. Patient Prefer Adherence. 2017;11:897–903. doi: 10.2147/PPA.S92533. [DOI] [PMC free article] [PubMed] [Google Scholar]