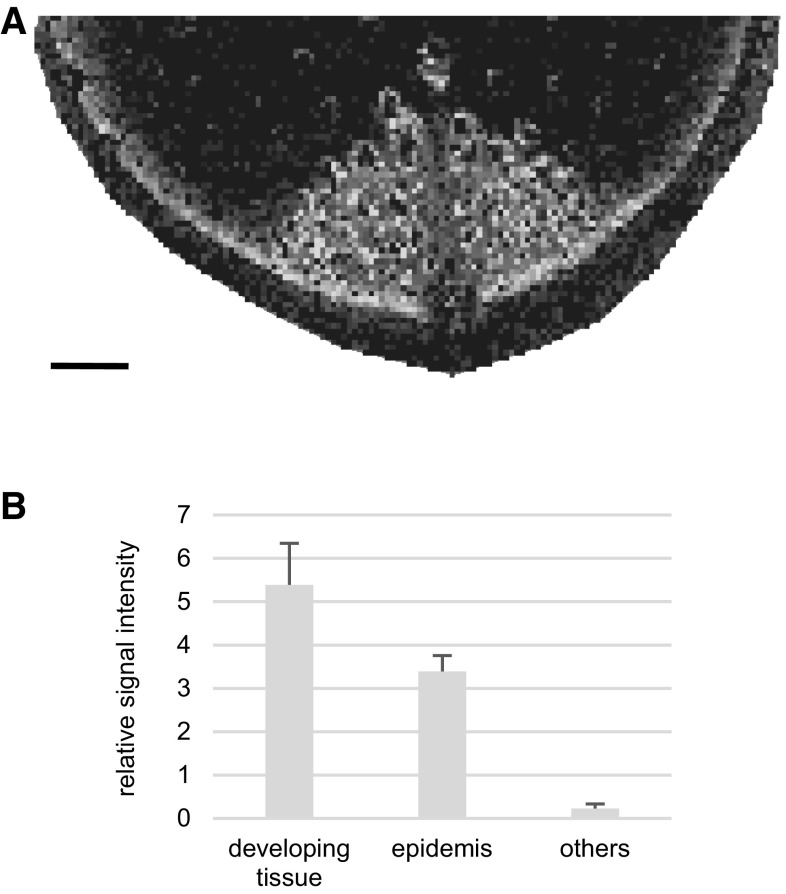
Fig. 3.
Identifying the localization of rutin. A The localization of rutin was visualized with m/z 633.1425 ± 1.8111 as [M + Na]+ form on the cross section. Bar indicates 1 mm. B Comparing the relative signal intensity of rutin in liquid chromatography–tandem mass spectrometry. The signal intensity of rutin was divided with that of the internal standard lidocaine in each sample. Others include the vascular and ground tissues. Bar indicates standard deviation (n = 3)

