Abstract
The aim of this study is to investigate the dissolution properties of poorly soluble drugs from their pure form and their amorphous formulation under physiological relevant conditions for oral administration based on surface dissolution ultraviolet (UV) imaging. Dissolution of two poorly soluble drugs (cefuroxime axetil and itraconazole) and their amorphous formulations (Zinnat® and Sporanox®) was studied with the Sirius Surface Dissolution Imager (SDI). Media simulating the fasted state conditions (compendial and biorelevant) with sequential media/flow rate change were used. The dissolution mechanism of cefuroxime axetil in simulated gastric fluid (SGF), fasted state simulated gastric fluid (FaSSGF) and simulated intestinal fluid (SIF) is predominantly swelling as opposed to the convective flow in fasted state simulated intestinal fluid (FaSSIF-V1), attributed to the effect of mixed micelles. For the itraconazole compact in biorelevant media, a clear upward diffusion of the dissolved itraconazole into the bulk buffer solution is observed. Dissolution of itraconazole from the Sporanox® compact is affected by the polyethylene glycol (PEG) gelling layer and hydroxypropyl methylcellulose (HPMC) matrix, and a steady diffusional dissolution pattern is revealed. A visual representation and a quantitative assessment of dissolution properties of poorly soluble compounds and their amorphous formulation can be obtained with the use of surface dissolution imaging under in vivo relevant conditions.
KEY WORDS: surface dissolution, UV imaging, poorly soluble drugs, amorphous formulation, intrinsic dissolution, biorelevant dissolution
INTRODUCTION
The amorphous form has attracted increasing interest within the pharmaceutical field because its higher solubility could achieve better dissolution rate and absorption rate and increase the bioavailability of poor water-soluble compounds (1). The solubility increment of amorphous forms over crystalline states depends on the potential energy difference between these physical states (2,3). It was estimated that 10–1600 folds of solubility increment can be achieved by applying the amorphous form (4).
From the physical stability point of view, the drug which is formulated in an amorphous state should be preserved and stabilised to exert its solubility advantage even during the dissolution process (5). There are only a handful of oral pharmaceutical products containing amorphous active pharmaceutical ingredient (API) that have been successfully marketed despite several decades of effort in research and development; examples include cefuroxime axetil (CA) (6), itraconazole (ITR) (7), quinapril (8), etravirine (9), zafirlukast (10) and rosuvastatin (11). The limited commercial success indicates the challenges with the stability of the amorphous formulations (12). One of the issues relating to the stability of the amorphous state is its solution-mediated transformation characteristic. Solution-mediated transformation of amorphous to crystalline state is the conversion of metastable solids such as amorphous solids to the crystalline state when the solids are exposed to a solvent. The transformation to the more thermodynamically stable crystalline state occurs at a higher rate because of the higher mobility in the solution state than in the solid. In drug process development, characterisation of solution-mediated transformations in the amorphous state is important because it describes information on amorphous crystallisation (13).
For poorly water-soluble drugs, the maximum achievable intraluminal drug concentration may limit absorption. However, the intraluminal concentration of a drug is not necessarily limited by its solubility in gastrointestinal fluids (14). Drugs may be in solution at a concentration above their saturation solubility, that is, in a state of supersaturation. A supersaturated drug solution is thermodynamically unstable compared to the equilibrium condition (saturation). Thus, it has the tendency to return to the equilibrium state (lowest chemical potential) by drug precipitation (15). The higher the supersaturation, the more precipitation will take place as the former is the driving force for the latter (16). This higher initial solubility may be sufficient to ensure increased and more rapid absorption for a drug with good permeability such as Biopharmaceutical Classification System (BCS) class 1 and 2 compounds. But, a more thermodynamically stable form may crystallise at any time inside the gastrointestinal (GI) tract and the crystallisation would have a major impact on the product performance in vivo (17). The higher dissolution rate and apparent solubility of an amorphous drug usually cause supersaturation during in vivo dissolution. Therefore, this may lead to precipitation in the GI tract (as the supersaturation is the driving force for the precipitation) and compromise oral bioavailability (14).
In the GI tract, drug solubility can be enhanced by food and bile components such as bile salts, lecithin and fatty acids. Supersaturation in the intestinal fluid is an important property that can play a significant role in drug absorption. For compounds with poor intrinsic solubility in the intestinal fluid, solubility is often a limiting factor for absorption. For many of these compounds, it may not be possible to enhance the saturation solubility to the extent required such that the whole dose is dissolved in the GI fluid. In this case, creating or maintaining supersaturation in the intestinal fluid can be an effective way to enhance the absorption of these compounds (18).
Surface ultraviolet (UV) dissolution imaging is very useful in characterising active compounds and their formulations, as the captured images illustrate the concentration distribution of drug compounds, which can be translated into the amount and rate of drug dissolution (19–24). The surface UV dissolution imaging is applicable as most pharmaceutical drug substances contain a UV chromophore. The intensity of the measured light is converted to absorbance, creating a high-resolution, real-time 2D absorbance and concentration map of dissolution events within the flow cell which presents a detailed view of the dissolution process occurring on the surface of the drug compact (25). The data can then be processed for measurement of the intrinsic dissolution rate (IDR) of the active compound (pure API or formulation), with the whole process typically taking around 20 min (26,27). The ActiPix™ SDI300 is a multipurpose UV area imaging system which enables quantitative imaging of surface dissolution for various applications such as pure active compound (19,21,23), transdermal patch (20), crystal (22,28), gels (29,30), polymer (31), cocrystal (32–34), excipient shielding (35), salt (36), drug-phospholipid complexes (37), oral strip film (38) and oily liquid (39). Using this system, temporal and high-resolution spatial data from the solid–liquid interface can be observed. Measurement of this dissolution process has been described in length in the literature (19,22,25,29), and it offers insight into surface events such as boundary layer thickness, surface concentration, contour distribution, concentration gradient profiles and surface changes from swelling or gelling. The ActiPix™ SDI300 also supplies special insights into processes occurring in microns to millimetres from the surface, the crucial distance range for recognising dissolution. Moreover, the dissolution medium can be changed easily (for example, from simulated gastric fluid to simulated intestinal fluid) that will reveal the effect of medium (pH and buffer) and hydrodynamics (flow rate) to the precipitation and dissolution of the tested compound. The resulting images with media change setup may increase the understanding of the in vivo dissolution process, which may also increase the predictive ability of this dissolution test method. Owing to the fact that the flow-cell volume is small, the time to produce the flow rate changes is relatively short. For example, the flow rate can go from high velocity (4 mL/min) down to no velocity (static, 0 mL/min) almost instantly. Similarly, the low volume also means that less dissolution medium is required, and it is cost-effective when biorelevant media are used. The dissolution setup is very useful for screening potential drug compounds during the pre-formulation stages because the intrinsic dissolution rates can be obtained in less than 20 min compared to 24-h equilibrium IDR using the traditional dissolution system (Wood apparatus).
In this study, two BSC class 2 amorphous compounds (CA and ITR) and their amorphous formulations (Zinnat® and Sporanox®, respectively) were used. The study aimed to investigate the dissolution properties of these poorly soluble compounds from their pure form and their amorphous formulation based on surface dissolution UV imaging under physiological relevant conditions for oral administration. The surface of the samples was exposed to media simulating the fasted state conditions: compendial (simulated gastric fluid (SGF) and simulated intestinal fluid (SIF)) and biorelevant (fasted state simulated gastric fluid (FaSSGF) and fasted state simulated intestinal fluid (FaSSIF-V1)) media with sequential media/flow rate change. Biorelevant dissolution media have been used in previous UV dissolution imaging studies (23,40,41) to characterise drug dissolution. To the best of our knowledge, our study is the first study in which an experimental design using media and flow rate change is applied in the UV dissolution imaging.
MATERIALS AND METHODS
Materials
Sporanox® capsules (Janssen-Cilag, Ltd., Bucks, UK) and Zinnat® tablets (GlaxoSmithKline, Middlesex, UK) were purchased commercially. ITR standard (98% w/w) (batch no. 097K1156; St. Louis, MO), CA standard (United States Pharmacopeia (USP) Reference Standard, Lot 09822G; Rockville, MD), amorphous ITR API (intrinsic solubility 0.001 μg/mL) and amorphous CA API (intrinsic solubility 0.4 μg/mL) were provided by Hoffmann-La Roche, Nutley USA.
Glyceryl monooleate (GMO; Rylo M19 Pharma®, 99.5% monoglyceride) was a gift from Danisco A/S, Grindsted, Denmark. Egg phosphatidylcholine (Lipoid E PC®) was generously donated by Lipoid GmbH, Ludwigshafen, Germany. Sodium oleate (lot number SZBB0110V) and sodium chloride (NaCl) were purchased from Sigma-Aldrich (Dorset, UK). Sodium taurocholate (NaTC, 97% pure) was purchased from Prodotti Chimici e Alimentari S.p.A., Basaluzzo, Italy. The Milli-Q water was obtained from a Nanopure® Diamond UF and UV/UF Water Barnstead System (Thermo Scientific, Dubuque, USA). Buffer components were analytical grade.
Preparation of Compendial and Biorelevant Media
A fasted state simulating gastric fluid without pepsin (SGF) (42) and fasted state simulating intestinal fluid without pancreatin (SIF) (42) were used to simulate the fasting gastric and intestinal composition, respectively (43,44). Biorelevant media simulating the conditions in the gastric and intestinal environment in the fasted state (FaSSGF and FaSSIF-V1, respectively) were prepared according to the procedure described by Vertzoni et al. (45,46).
Preparation of Compacts
Compacts were prepared using ITR (4 mg) and CA (4 mg) reference standard powder, Sporanox® pellet (4 mg; the hard gelatin Sporanox capsule was removed beforehand) and grounded Zinnat® tablet powder (4 mg; Zinnat® tablet was grounded into fine powder using a mortar and pestle). Samples were transferred into a stainless steel cylinder sample cup (2 mm inner diameter × 2.4 mm height). A Quickset Minor® torque screwdriver (Torqueleader; M.H.H. Engineering Co., Ltd., England) was used to compress the weighted materials at a constant torque pressure of 0.6 Nm for 1 min.
Surface Dissolution UV Imaging
Sirius SDI (model name: ActiPix™ SDI300; Sirius Analytical Instruments, East Sussex, UK) utilises ActiPix™ UV area imaging technology combined with a laminar flow-through sample holder, an integrated syringe pump and the software. The device consists of a pulsed xenon lamp (PerkinElmer, Waltham, MA) with personal computer interface control box, a remote UV camera sensor with fibre optic cable, a band-pass filter (wavelength 214 nm, 254 nm or 280 nm) and a CADISS-2 dissolution cartridge. The CADISS-2 comprises of a 62-mm rectangular quartz tube, Luer Lock connector flow-cell inlet and outlet as well as a cartridge body. Either the 20-mL and 50-mL BD plastic buffer delivery syringes were used to hold the dissolution medium. Detection was performed at 280 nm (band width 10 nm). The utilised CADISS-2 quartz flow cell had a light path of 4 mm. The imaging system consists of 1280 × 1024 pixels with dimensions of 9 mm2 × 7 mm2 (total imaging area of 9 mm2 × 7 mm2), and each pixel can be considered as a conventional single-beam spectrophotometer. Output from the sensor is connected to a computer at a rate of one snapshot every 0.5 s for processing and storage. A syringe pump (RS-232 integrated pump; Maxim Integrated Products, Inc., USA) was used for infusion of dissolution media at constant and changing flow rates, with temperature controlled at 37°C using a Techne DB-2D Dri-Block® digital heater (Staffordshire, UK). Dissolution experiments were performed using ITR and CA reference standard, Sporanox® and Zinnat® compacts, as described below.
Media and Flow Rate
Constant Flow Rate Studies
The flow rates in the ActiPix™ flow cell corresponding to the nominal physiological linear velocity of the fluid in the stomach (2 cm/min) and intestine (1 cm/min) (47) were determined using the following linear relationship: y = 7.17x − 0.0135 (R2 = 0.999) (the linear regression of linear velocity of the ActiPix™ flow-through cell [cm/min] versus various flow rates [mL/min]). Without taking into account the cross-sectional water loss, the calculated flow rates of the ActiPix™ flow cell are 0.28 mL/min and 0.14 mL/min for the stomach and intestine conditions, respectively (48). Furthermore, to complement the dataset of the flow rate range between 0 and 1.0 mL/min, two bridging flow rates of 0.6 mL/min and 1.0 mL/min were also used for these studies (Table I).
Table I.
Periods During Which the Compact Was Exposed to the Dissolution Media and the Flow Rate that Each Medium Was Pumped Through the Cell
| Medium | Period of each flow rate (min) | Flow rate (mL/min) |
|---|---|---|
| ITR and CA pure API compact | ||
| Constant flow rate | ||
| SGF/FaSSGF/SIF#/FaSSIF-V1 | 5 for gastric media | 0.14, 0.28, 0.4, 0.6, 0.8, 1 |
| 15 for intestinal media | ||
| Media and flow rate change | ||
| SGF/FaSSGF | 0–6 | 0.8 |
| SIF/FaSSIF-V1 | 7–24 | 0.4 |
| Sporanox® pellet compact* | ||
| Constant flow rate | ||
| SGF#/FaSSGF/SIF/FaSSIF-V1 | 5 for gastric media | 0.14, 0.28, 0.4, 0.6, 0.8, 1 |
| 15 for intestinal media | ||
| Media and flow rate change | ||
| SGF/FaSSGF | 0–6 | 0.8 |
| SIF/FaSSIF-V1 | 7–24 | 0.4 |
*Experiments with Zinnat® compact were not successful due to the presence of a superdisintegrant in the formulation
#Data for Sporanox® pellet compact in SGF with a flow rate of 0.6 mL/min and ITR API compact in SIF with a flow rate of 1.0 mL/min are not available
Flow Rate Change Studies
Based on the fact that both the ActiPix™ flow cell and USP apparatus 4 flow-through cell provide unilateral laminar flow and lower turbulence within the flow cell, a one-tenth magnitude scale-down of the corresponding USP apparatus 4 setup was used (49,50). Hence, flow rates of 0.8 mL/min and 0.4 mL/min (reflecting the conditions in the human stomach and intestine, respectively) were used in the experiment with media and flow rate change (Table I).
Experimental Conditions
The experimental conditions for the studies with surface dissolution UV imaging are described in Table I. Constant flow rate denotes a study using a single dissolution medium under the flow rates of 0.14 mL/min, 0.28 mL/min, 0.4 mL/min, 0.6 mL/min, 0.8 mL/min and 1 mL/min whereas the media and flow rate change denotes a study using, firstly, gastric medium (flow rate 0.8 mL/min) and then intestinal medium (flow rate 0.4 mL/min). Experiments were performed in triplicate unless otherwise indicated, and each run lasted 24 min.
Calibration curves were constructed by flowing drug standard solutions through the dissolution cell at a flow rate of 1 mL/min. Recording of UV images was performed when each of the standard solutions was infused for a period of 5 min. The buffer was infused before and after the series of reference standard solutions for 4 min in order to detect baseline drift. The standard solutions were prepared using CA and ITR reference standard in FaSSGF and SGF, respectively. The concentration range used for both CA and ITR was 5–180 μg/mL; FaSSGF was chosen for CA due to its low degradation in this medium, and SGF was chosen for ITR due to its relatively good solubility in this medium (51). Three UV readings were made at different time points at each concentration, and the average values were used for the calibration plot. The interference caused by the bile salts of FaSSGF or polymer of the solid dispersion was minimum as indicated by the similar absorbance recorded in standard solutions without bile salt and polymers. In each experiment, buffer solution was used to calibrate the spectrophotometer so that any absorbance attributable to the bile salts and polymer as well as particle on the compact surface can be compensated. By setting the absorbance of the blank to zero, an instrumental subtraction measures only the drug absorbance. The collected data were then used to calculate dissolution rates and cumulative amount dissolved of tested compounds in the various media at 1-min intervals, using ActiPix™ D100 software, version 1.5 (York, England) (20,51).
RESULTS AND DISCUSSION
Surface Dissolution UV Imaging of Cefuroxime Axetil
An initial dissolution test using Zinnat® (amorphous formulation of CA) compact was not satisfactory because the high loading of super-disintegrant croscarmellose sodium in Zinnat® became a dense layer after being exposed to the dissolution medium (51). This layer caused physical blocking of the light and yielded a large amount of debris that clogged the flow cell, thus preventing further testing of this amorphous formulation of CA (51).
Single Medium and Constant Flow Rate Study
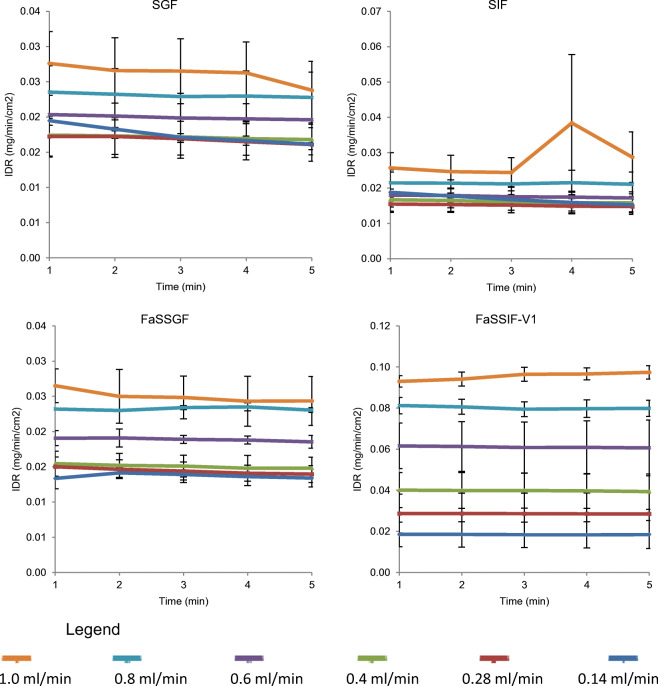
The IDR results of CA pure API in compendial and biorelevant media (constant media) versus time profiles under various flow rates are presented in Fig. 1.
Fig. 1.
Mean ± SD IDR of CA from its pure API compact in the compendial and biorelevant media (n = 3)
As observed from the results of the individual constant flow rate studies (flow rate of 1 mL/min, 0.8 mL/min, 0.6 mL/min, 0.4 mL/min, 0.28 mL/min and 0.14 mL/min), the effect of flow rate on the CA IDR profiles is evident (Fig. 1). A clear stepwise IDR reduction in tandem with a flow rate decrease (of each individual constant flow rate experiments) is revealed in FaSSIF-V1.
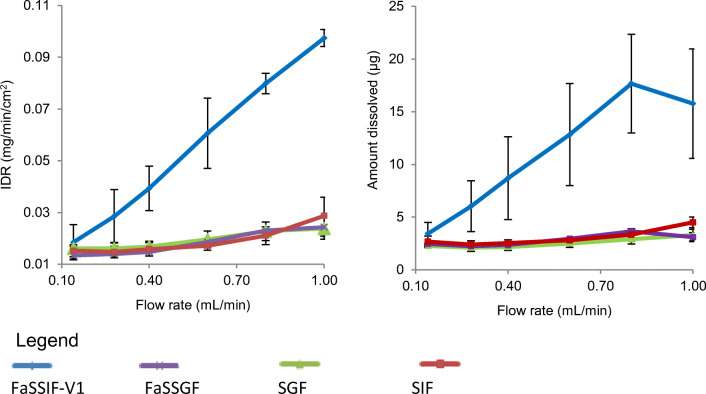
A compilation of all measured IDR results versus flow rate is shown in Fig. 2. The graph profiles for the studies in SGF, FaSSGF and SIF are almost straight lines and suggest that the dissolution rate is almost constant independent of the flow rate, whereas, with the FaSSIF-V1 profiles, the graph profile shows an apparent gradient which indicates dissolution in convective flow as the main dissolution mechanism. This observation is a good indicator of the effect of mixed micelles that facilitate and enhance the dissolution of poorly water-soluble compounds (52,53). All IDR profiles, regardless of the media used, yielded a plateau IDR versus time profile which reveals zero-order release kinetics with a constant drug release rate over a period of time. This indicates that sink conditions for CA dissolution possibly exist in the channel flow cell that would be of importance for the simulation of the in vivo conditions (26,48). Comparing specifically with an amorphous furosemide formulation reported elsewhere (41), several similarities were observed. Firstly, a larger area of intense absorbance was observed at the compact surface; secondly, precipitated drug was washed down from the compact surface; and thirdly, absorbant ‘tail’ was observed downstream from the surface of the compact (41).
Fig. 2.
Mean ± SD IDR and amount of CA dissolved at 5 min from its pure API compact in the compendial and biorelevant media (n = 3)
Media and Flow Rate Change Study
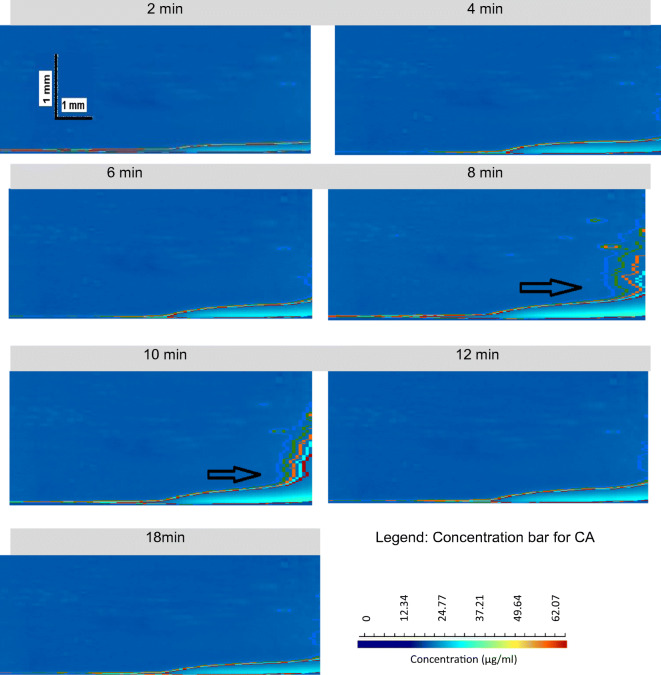
Dissolution behaviour of CA was monitored by the surface dissolution UV imaging in SGF (0.8 mL/min; 6 min) followed by SIF (0.4 mL/min; 18 min). The UV images of absorbance maps of dissolved CA at selected time points are shown in Fig. 3. A contour concentration line is presented in the concentration scale bar. All concentrations were lower than 35 μg/mL (within the linear range of the calibration curve). Dissolution occurs as a result of both convection and diffusion, as reported also in other studies (22,23,29,39,54). The absorbance contours reveal that laminar flow conditions are prevailing in the flow cell, while the thickness of the downstream tail varies with the flow rate, similar to what has been shown previously (22,23,29,39,54).
Fig. 3.
UV concentration maps of CA dissolved from pure API compacts in SGF (0.8 mL/min; 6 min)/ SIF (0.4 mL/min; 18 min) using surface dissolution UV imaging apparatus (Time point: 2, 4, 6, 8, 10, 12 and 18 min).The two horizontal arrows indicate turbulent pattern contour potentially caused by dispersion of the recrystallised particle
After media and flow rate change, the drug concentration peak at 8 min forms a supersaturated solution and then gradually reduces. An apparent turbulent pattern contour is observed which could probably imply a dispersion of the recrystallised particle at 8 min and 10 min corresponding to the crystal growth post supersaturation (as indicated by the arrow in Fig. 3). The measured dissolution layer thickness at the surface is approximately 0.05 mm to 0.1 mm under both flow rates (0.8 mL/min and 0.4 mL/min), whereas the calculated dissolution layer thickness is 4.34 mm × 10−3 mm under 0.8 mL/min and 8.66 mm × 10−3 mm under 0.4 mL/min (51).
On another note, the measured dissolution layer thickness values using surface UV imaging apparatus are far higher than the calculated dissolution layer thickness. According to the literature (55), this phenomenon suggests that CA dissolved from the surface as aggregate, initially forming a supersaturated solution; this is in agreement with the observed IDR and amount of CA dissolved from the pure API compact with media and flow rate change from SGF (0.8 mL/min) to SIF (0.4 mL/min) (Fig. 4). Figure 4 indicates that there are two supersaturated solutions formed in SGF and SIF before particle precipitation and decrease of IDR. Drug supersaturation, which often precedes precipitation, is conventionally determined in vitro through solubility and solution concentration comparison. A recent study conducted using UV-vis imaging, light microscopy and Raman spectroscopy has characterised the piroxicam supersaturation, precipitation and dissolution in an enclosed flow-through casing (15). A study by Sun et al. (15) is different as crystalline drug and dissolved drug were inserted instead of the API or formulation that was used in the present study. Our study also reveals that hydrodynamic conditions such as flow rate and flow pattern influence the rate and extent of drug precipitation (15). Furthermore, swelling, crystal growth and/or precipitation at the compact surface can be detected as it has also been shown for the metastable forms of amlodipine besylate where the amorphous salt, the crystalline anhydrate and dihydrate salt forms as well as the amlodipine free base were confirmed (21).
Fig. 4.
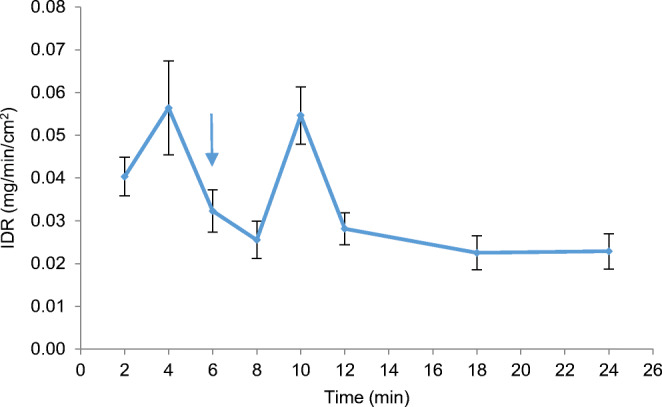
Mean ± SD IDR of CA dissolved from its pure API compact in SGF (0.8 mL/min; 6 min)/SIF (0.4 mL/min; 18 min) (n = 2). Blue arrow indicates time with media change
Surface Dissolution UV Imaging of Itraconazole
Single Medium and Constant Flow Rate Study
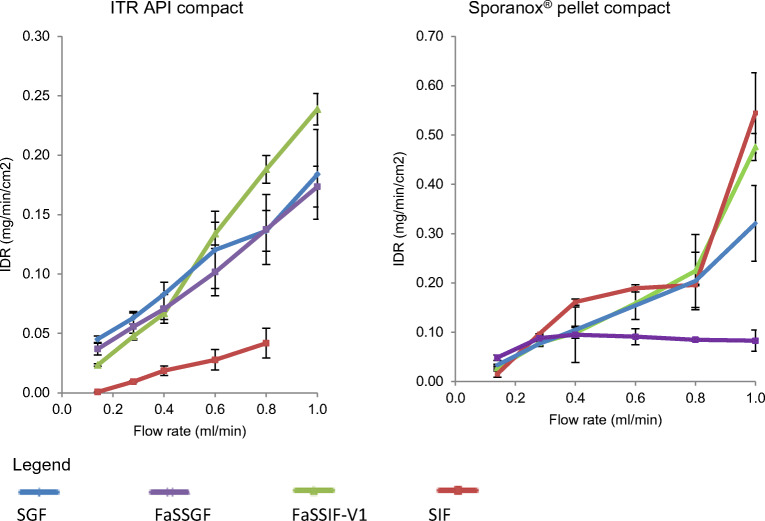
The IDR results of ITR from ITR pure API and Sporanox® compacts in compendial and biorelevant media versus time profiles are presented in Fig. 5. A stepwise decrease in dissolution rate corresponding to the stepwise reduction in flow rate is obtained from the imaging data (Fig. 5). This trend is expected based on the convective diffusion theory (56). The key parameter in convective diffusion theory is the concentration at the surface (57). The impact of reducing the flow rate from 1 to 0.14 mL/min on the IDR profiles was evident in ITR pure API in the compendial and biorelevant media and Sporanox® formulation in SGF and FaSSIF-V1. In Sporanox®, the IDR profiles in FaSSGF and SIF showed no obvious rank order, probably due to the interference of surface dissolution characterisation in the presence of excipients and polymers, such as hydroxypropyl methylcellulose (HPMC) and polyethylene glycol (PEG). In order to determine the dissolution mechanism of ITR from both compacts, the IDR results were plotted against the flow rate (Fig. 6).
Fig. 5.
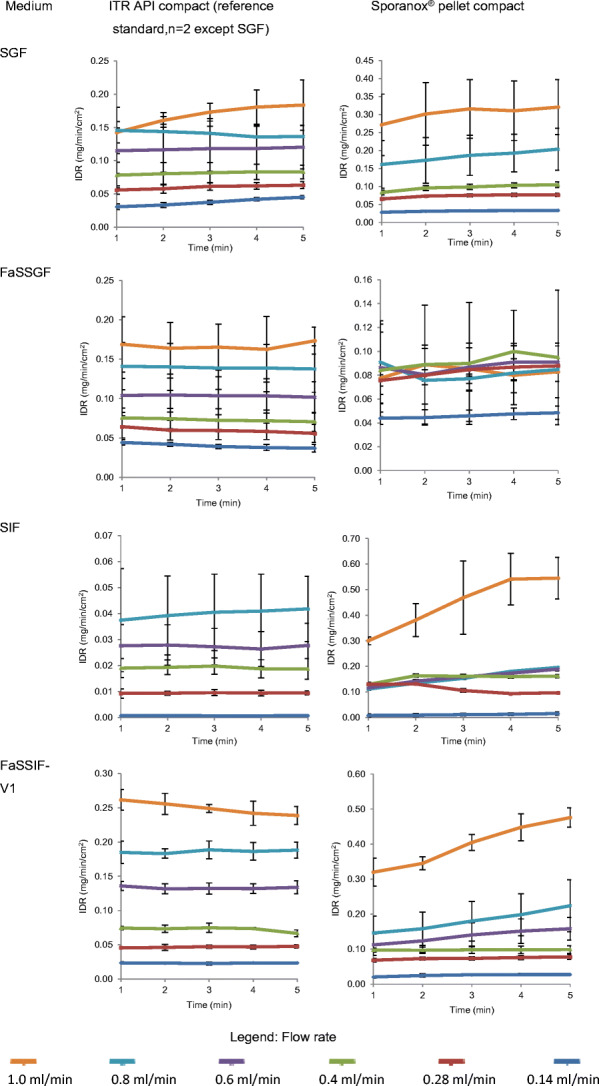
Mean ± SD IDR of ITR from its pure API compact (n = 2; n = 3 in SGF) and Sporanox® compact (n = 3) in the compendial and biorelevant media
Fig. 6.
Mean ± SD IDR and amount of ITR dissolved at 5 min from its pure API compact (n = 2 in SIF, FaSSGF and FaSSIF-V1) and Sporanox® compact (n = 3)
Comparing with analysis using the MRI flow-cell dissolution setup using amorphous felodipine (58), slow erosion of compacted material due to the consolidation of the matrix on compression was also observed in our study. The close resemblance of the flow-cell setup allowed us to indicate that supersaturated drug solution occurred in the proximity of the solid–liquid interface caused by the relatively slow erosion of the compacted materials under the conditions of low convection employed. In agreement with the findings presented by Langham et al. (58), nucleation and growth of solid drug particles were driven by the supersaturated solutions.
The dissolution mechanism of ITR from Sporanox® compact (SIF and FaSSIF-V1 at 1 mL/min) showed a steeper curve than from the pure API compact. This is in agreement with the dissolution kinetics of ITR characterised with USP apparatus 4, showing that the dissolution in convective flow is the main process in determining the dissolution of ITR formulated as a solid dispersion–coating pellet (51). The IDR trends in biorelevant media did not reveal the advantage of the surfactants in terms of enhancing the dissolution rate. This is because bile salt has been shown to potentially undergo an acid–base reaction with ITR molecules, leading to slower ITR dissolution (52,53).
The HPMC content in Sporanox® pellet coating is 60% w/w (ratio of 1:1.5 ITR to HPMC); thus, at this high concentration, the release of ITR is controlled by HPMC. The multiparticulate drug–coated Sporanox® pellet is also coated with the PEG membrane at its outer most layer (7). The rate of ITR dissolution is dependent not only on the thickness of the membrane but also on the composite of the HPMC-ITR solid solution matrix itself which sustains the dissolution (59). Furthermore, HPMC has a gelling property upon hydration which has been identified as a variable affecting drug dissolution (60). Hence, the dissolution of ITR from Sporanox® compact was delayed due to drug particles having to diffuse out from the HPMC matrix before undergoing dissolution.
Due to the poor solubility of ITR in SIF and without the interference of bile salt and lecithin, SIF was able to discriminate Sporanox® formulation (amorphous formulation) and ITR pure API (crystalline compact), with the IDR of ITR from Sporanox® pellet compact in SIF being nearly ten times higher than the one from pure API compact. The results seem to suggest that this experiment setup and conditions could be used to discriminate critical manufacturing variables of such formulations.
Media and Flow Rate Change Study
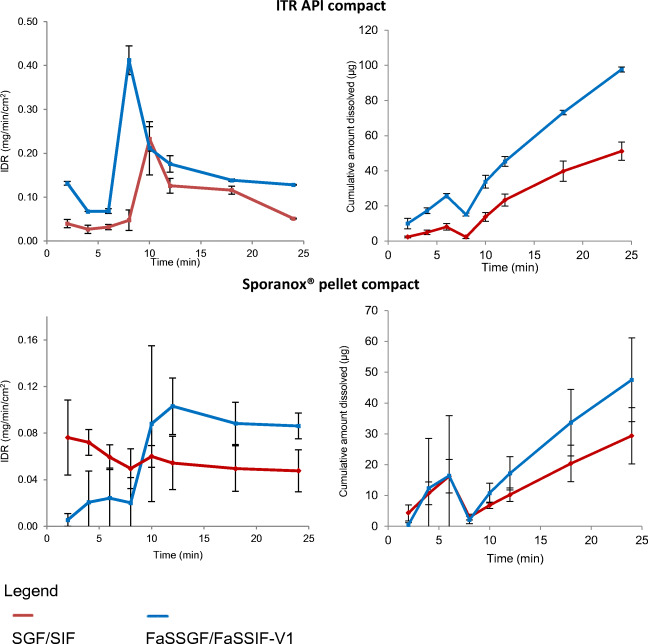
Dissolution behaviour of ITR from its pure API and Sporanox® compacts were monitored by the surface UV dissolution apparatus in the sequential change of compendial media (SGF [0.8 mL/min; 6 min] followed by SIF [0.4 mL/min; 18 min]) and in the sequential change of biorelevant media (FaSSGF [0.8 mL/min; 6 min] followed by FaSSIF-V1 [0.4 mL/min; 18 min]). The IDR and cumulative amount of ITR dissolved are presented in Fig. 7.
Fig. 7.
Mean ± SD IDR and amount of ITR dissolved from its pure API and Sporanox® compact in SGF (0.8 mL/min; 6 min)/SIF (0.4 mL/min; 18 min) and in FaSSGF (0.8 mL/min; 6 min)/FaSSIF-V1 (0.4 mL/min; 18 min) (n = 3)
Compared to the flat and linear profiles in single media (SGF, SIF, FaSSGF and FaSSIF-V1; Fig. 7), the profiles with media change have exhibited their own characteristic gradient. In the dissolution profiles of experiments with media change using surface dissolution UV imaging, a biphasic curve is apparent, with a sudden increment after media change from the simulated gastric medium to the simulated intestinal medium. A higher supersaturation ratio could be observed with the media change from FaSSGF to FaSSIF-V1, due to micellar solubilisation. The same dissolution rate enhancement was observed for the Sporanox® pellet compact in the biorelevant setup (FaSSGF/FaSSIF-V1) but not in the compendial one (SGF/SIF).
The IDR profile of ITR from the pure API compact in SGF/SIF and FaSSGF/FaSSIF-V1 showed that after medium and flow rate changes from simulating gastric condition to simulating intestinal condition, the IDR and amount dissolved increased significantly, forming a transient supersaturated solution of ITR. After 5 min to 8 min, the supersaturation ratio reduced steadily toward the equilibrium dissolution rate of 0.128 mg/min/cm2 in FaSSIF-V1 and 0.051 mg/min/cm2 in SIF, yielding a total amount of ITR dissolved of 98 μg and 51 μg, respectively. The higher ITR dissolution expected from the amorphous formulation compact was not revealed probably due to the interaction of bile salt (found in FaSSIF-V1) and potassium salt (found in SIF) with PEG (61). The PEG coating used in Sporanox® pellet to prevent agglomeration hinders the ITR dissolution in the surface dissolution UV imaging; this was also shown in the ITR profiles from Sporanox® compacts in the constant biorelevant media (FaSSGF and FaSSIF-V1) study (Fig. 7).
The concentration curves of ITR dissolved from ITR pure API compact and Sporanox® pellet compact relative to the compact surface axis are presented as concentration contours within the UV absorbance maps of ITR dissolved at different selected time points (Fig. 8). The contours of Sporanox® pellet compacts (Fig. 8) show that density gradients in the proximity of compact surface affect the concentration distribution of the surrounding solutions. Accumulation of dissolved ITR was slightly skewed toward the left part of the contour images for the sample due to a higher density of the HPMC and PEG gel matrix as compared to the solvent. As discussed previously, ITR dissolution from the Sporanox® compact is affected by the PEG gelling layer and HPMC matrix. On the other hand, the contour of ITR pure API compact shows a flat and broad laminar layer. ITR pure API compact in FaSSGF/FaSSIF-V1 forms the least concentrated solution in the dissolution layer compared with the studies in SGF/SIF and also compared to the studies of the Sporanox® compact. There was a clear upward movement of the dissolved ITR into the bulk buffer solution as the downstream distance increases to form a stable dissolution layer. Furthermore, the distorted curve and abnormal shifting of contour lines observed strongly indicate that ITR dissolution is followed by recrystallisation of the ITR particle at the compact surface (black bold arrow in Fig. 8). In the studies using pure API compact with compendial media, although a thicker dissolution layer is observed throughout the whole experiment, the size of the dissolution layer quickly dissipates to the minimum layer at 18 min. In the ITR pure API compact studies with biorelevant media, there was a significant decrease in the dissolution layer after 10 min of the dissolution test that slowly relaxed at a low concentration layer. It could be concluded that the fast supersaturation formed on the surface after media change drastically increased the recrystallisation of ITR on the surfaces of the compacts which could also lead to crystal growth on the surface. A similar setup to examine nilotinib, a protein kinase inhibitor formulated as an amorphous solid dispersion has been reported (27). Compared to the study conducted by Colombo et al. (27), solution-mediated phase transformation did not occur to ITR from Sporanox® compact in the beginning of this experiment. ITR from Sporanox® compact precipitated at the later stage of the experiment, confirming that precipitation of an amorphous compound was avoided due to high drug load that prevented matrix swelling during media change (27).
Fig. 8.
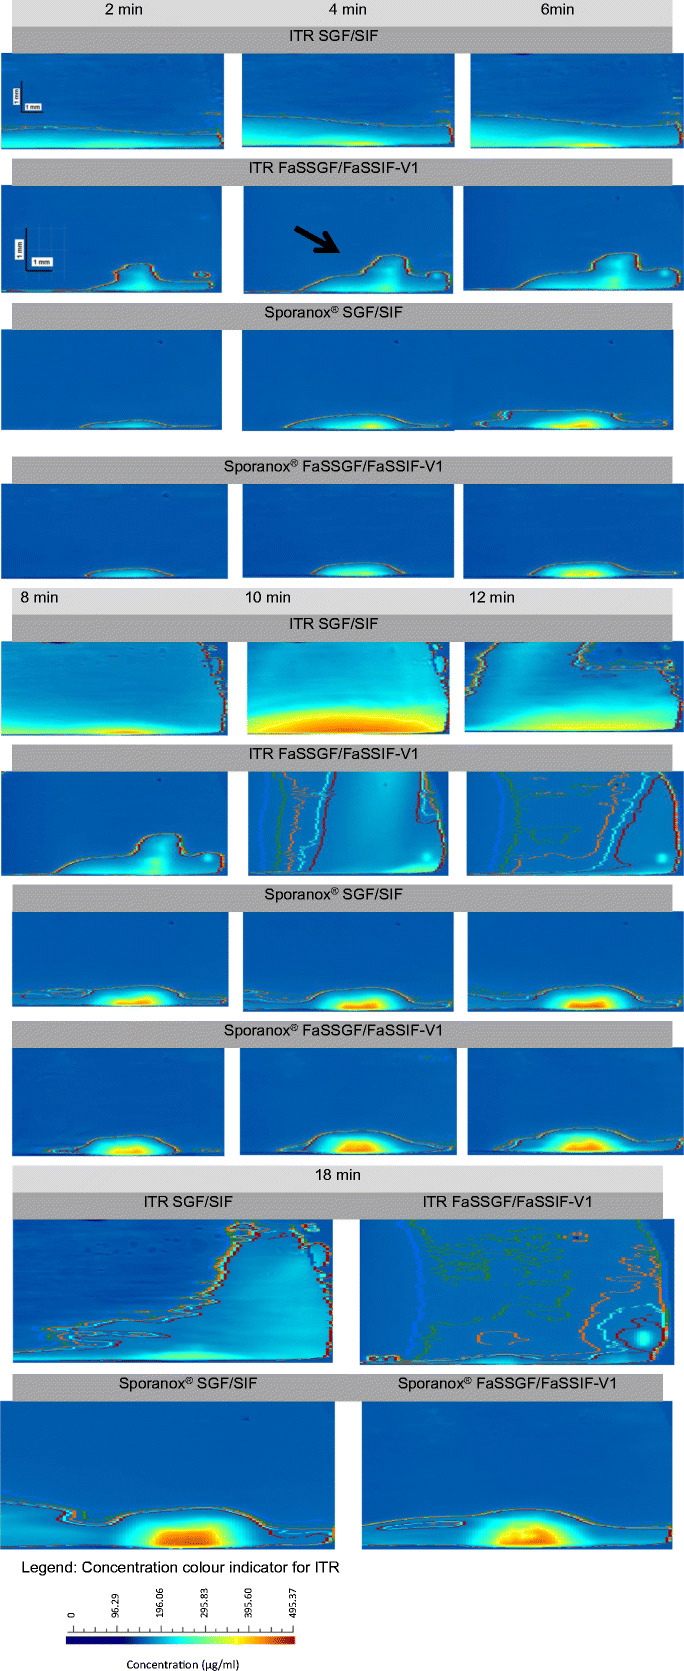
UV concentration maps of ITR dissolved from pure API and Sporanox® pellet compacts in the compendial (SGF [0.8 mL/min; 6 min]/SIF [0.4 mL/min; 18 min]) and biorelevant (FaSSGF [0.8 mL/min; 6 min]/FaSSIF-V1 [0.4 mL/min; 18 min]) media using surface dissolution UV imaging apparatus (time points 2 min, 4 min, 6 min, 8 min, 10 min, 12 min and 18 min)
CONCLUSIONS
Surface dissolution UV imaging methodology that could be used to understand the mechanism of CA and ITR (pure APIs and their amorphous formulations) dissolution was developed in this project. From the surface dissolution UV imaging testing, the UV images of absorbance maps and contour concentration lines of the dissolved CA during the studies with media and flow rate change (SGF/SIF) revealed that CA dissolved from the compact surface as aggregates and formed a supersaturated CA solution that subsequently precipitated out. Similarly, for ITR, the supersaturation of ITR after media change drastically increased the recrystallisation of ITR on the surfaces of the ITR pure API and Sporanox® compacts which could lead to ITR crystal growth. The UV images obtained from these studies provided a visual representation and a qualitative as well as quantitative assessment of the differences in dissolution rates and concentration for the model compounds used.
Acknowledgments
Part of this work has been previously presented at the AAPS annual meeting in November 2013 (poster presentation).
Abbreviations
- API
Active pharmaceutical ingredient
- BCS
Biopharmaceutical Classification System
- CA
Cefuroxime axetil
- E PC
Egg phosphatidylcholine
- FaSSGF
Fasted state simulated gastric fluid
- FaSSIF-V1
Fasted state simulated intestinal fluid, version 1
- GI
Gastrointestinal
- GMO
Glyceryl monooleate
- HPMC
Hydroxypropyl methylcellulose
- IDR
Intrinsic dissolution rate
- ITR
Itraconazole
- MRI
Magnetic resonance imaging
- NaCl
Sodium chloride
- NaTC
Sodium taurocholate
- PEG
Polyethylene glycol
- SDI
Surface dissolution imaging
- SGF
Simulated gastric fluid
- SIF
Simulated intestinal fluid
- UF
Ultra filtration
- UK
United Kingdom
- USP
United States Pharmacopeia
- UV
Ultraviolet
Funding
The authors acknowledge Lipoid GmbH for the donation of lecithin for the preparation of biorelevant media and F. Hoffman-La Roche, Inc. (USA), for the PhD studentship awarded to C.M. Long.
Footnotes
Publisher’s Note
Springer Nature remains neutral with regard to jurisdictional claims in published maps and institutional affiliations.
References
- 1.Leuner C, Dressman J. Improving drug solubility for oral delivery using solid dispersions. Eur J Pharm Biopharm. 2000;50(1):47–60. doi: 10.1016/s0939-6411(00)00076-x. [DOI] [PubMed] [Google Scholar]
- 2.Hancock BC, Zografi G. Characteristics and significance of the amorphous state in pharmaceutical systems. J Pharm Sci. 1997;86(1):1–12. doi: 10.1021/js9601896. [DOI] [PubMed] [Google Scholar]
- 3.Gupta P, Chawla G, Bansal AK. Physical stability and solubility advantage from amorphous celecoxib: the role of thermodynamic quantities and molecular mobility. Mol Pharm. 2004;1(6):406–413. doi: 10.1021/mp049938f. [DOI] [PubMed] [Google Scholar]
- 4.Hancock BC, Parks M. What is the true solubility advantage for amorphous pharmaceuticals? Pharm Res. 2000;17(4):397–404. doi: 10.1023/a:1007516718048. [DOI] [PubMed] [Google Scholar]
- 5.Fotaki N, Long CM, Tang K, Chokshi H. Dissolution of amorphous solid dispersions: theory and practice. In: Shah N, Sandhu H, Choi DS, Chokshi H, Malick AW, editors. Amorphous solid dispersions: theory and practice. New York: Springer New York; 2014. pp. 487–514. [Google Scholar]
- 6.GlaxoSmithKline. Ceftin/Zinnat prescribing information 2007. http://www.accessdata.fda.gov/drugsatfda_docs/label/2007/050605s042lbl.pdf. Accessed 18 October 2018
- 7.Janssen-Cilag Ltd. Sporanox® (itraconazole) capsule product info. 2013. Available from: http://www.janssen.com.au/files/Products/Sporanox_Capsules_PI.pdf. Accessed 10 March 2018. In.
- 8.Pfizer Inc. Accupril® (quinapril hydrochloride tablets) product information leaflet. 2011. Available online: https://www.accessdata.fda.gov/drugsatfda_docs/label/2012/019885s035lbl.pdf. Accessed 14 January 2019. In
- 9.European Medicines Agency. CHMP assessment report for Intelence; International Nonproprietary Name: etravirine Procedure No. EMEA/H/C/000900.2008. Available online: https://www.ema.europa.eu/documents/assessment-report/intelence-epar-public-assessment-report_en.pdf. Accessed 14 January 2019. In.
- 10.AstraZeneca Pharmaceuticals. Accolate® (zafirlukast) tablets product information leaflet. Available online: https://www.accessdata.fda.gov/drugsatfda_docs/label/2013/020547s033lbl.pdf. Accessed 14 January 2019. In.; 2013.
- 11.AstraZeneca Pharmaceuticals. Crestor (rosuvastatin calcium) tablets product information leaflet. 2005. Available online: https://www.accessdata.fda.gov/drugsatfda_docs/label/2005/21366slr005lbl.pdf. Accessed 14 January 2019. In.
- 12.Serajuddin ATM. Solid dispersion of poorly water-soluble drugs: early promises, subsequent problems, and recent breakthroughs. J Pharm Sci. 1999;88(10):1058–1066. doi: 10.1021/js980403l. [DOI] [PubMed] [Google Scholar]
- 13.Zhang GGZ, Zhou D, Yihong Q, Yisheng C, Geoff GZZ, Lirong L, William RP. Developing solid oral dosage forms. San Diego: Academic; 2009. Crystalline and amorphous solids; pp. 25–60. [Google Scholar]
- 14.Brouwers J, Brewster ME, Augustijns P. Supersaturating drug delivery systems: the answer to solubility-limited oral bioavailability? J Pharm Sci. 2009;98(8):2549–2572. doi: 10.1002/jps.21650. [DOI] [PubMed] [Google Scholar]
- 15.Sun Y, Chapman A, Larsen SW, Jensen H, Petersen NJ, Goodall DM, Ostergaard J. UV-vis imaging of piroxicam supersaturation, precipitation, and dissolution in a flow-through setup. Anal Chem. 2018;90(11):6413–6418. doi: 10.1021/acs.analchem.8b00587. [DOI] [PubMed] [Google Scholar]
- 16.Six K, Verreck G, Peeters J, Brewster M, Van Den Mooter G. Increased physical stability and improved dissolution properties of itraconazole, a class II drug, by solid dispersions that combine fast- and slow-dissolving polymers. J Pharm Sci. 2004;93(1):124–131. doi: 10.1002/jps.10522. [DOI] [PubMed] [Google Scholar]
- 17.Sarode AL, Sandhu H, Shah N, Malick W, Zia H. Hot melt extrusion for amorphous solid dispersions: temperature and moisture activated drug-polymer interactions for enhanced stability. Mol Pharm. 2013;10(10):3665–3675. doi: 10.1021/mp400165b. [DOI] [PubMed] [Google Scholar]
- 18.Tong W-QT. Developing solid oral dosage forms. San Diego: Academic; 2009. Salt screening and selection: new challenges and considerations in the modern pharmaceutical research and development paradigm; pp. 75–86. [Google Scholar]
- 19.Hulse WL, Gray J, Forbes RT. A discriminatory intrinsic dissolution study using UV area imaging analysis to gain additional insights into the dissolution behaviour of active pharmaceutical ingredients. Int J Pharm. 2012;434(1):133–139. doi: 10.1016/j.ijpharm.2012.05.023. [DOI] [PubMed] [Google Scholar]
- 20.Ostergaard J, Meng-Lund E, Larsen SW, Larsen C, Petersson K, Lenke J, Jensen H. Real-time UV imaging of nicotine release from transdermal patch. Pharm Res. 2010;27(12):2614–2623. doi: 10.1007/s11095-010-0257-9. [DOI] [PubMed] [Google Scholar]
- 21.Boetker JP, Savolainen M, Koradia V, Tian F, Rades T, Mullertz A, Cornett C, Rantanen J, Ostergaard J. Insights into the early dissolution events of amlodipine using UV imaging and Raman spectroscopy. Mol Pharm. 2011;8(4):1372–1380. doi: 10.1021/mp200205z. [DOI] [PubMed] [Google Scholar]
- 22.Ostergaard J, Ye F, Rantanen J, Yaghmur A, Larsen SW, Larsen C, Jensen H. Monitoring lidocaine single-crystal dissolution by ultraviolet imaging. J Pharm Sci. 2011;100(8):3405–3410. doi: 10.1002/jps.22532. [DOI] [PubMed] [Google Scholar]
- 23.Gordon S, Naelapaa K, Rantanen J, Selen A, Mullertz A, Ostergaard J. Real-time dissolution behavior of furosemide in biorelevant media as determined by UV imaging. Pharm Dev Technol. 2012;18(6):1407–1416. doi: 10.3109/10837450.2012.737808. [DOI] [PubMed] [Google Scholar]
- 24.Boetker JP, Rantanen J, Rades T, Mullertz A, Ostergaard J, Jensen H. A new approach to dissolution testing by UV imaging and finite element simulations. Pharm Res. 2013;30(5):1328–1337. doi: 10.1007/s11095-013-0972-0. [DOI] [PubMed] [Google Scholar]
- 25.Ostergaard J. UV imaging in pharmaceutical analysis. J Pharm Biomed Anal. 2018;147:140–148. doi: 10.1016/j.jpba.2017.07.055. [DOI] [PubMed] [Google Scholar]
- 26.Paraytec Ltd . Actipix SDI300:rapid dissolution measurement for API development (technical report) 2011. [Google Scholar]
- 27.Colombo S, Brisander M, Haglof J, Sjovall P, Andersson P, Ostergaard J, Malmsten M. Matrix effects in nilotinib formulations with pH-responsive polymer produced by carbon dioxide-mediated precipitation. Int J Pharm. 2015;494(1):205–217. doi: 10.1016/j.ijpharm.2015.08.031. [DOI] [PubMed] [Google Scholar]
- 28.Sarnes A, Ostergaard J, Jensen SS, Aaltonen J, Rantanen J, Hirvonen J, Peltonen L. Dissolution study of nanocrystal powders of a poorly soluble drug by UV imaging and channel flow methods. Eur J Pharm Sci. 2013;50(3–4):511–519. doi: 10.1016/j.ejps.2013.08.030. [DOI] [PubMed] [Google Scholar]
- 29.Ye F, Yaghmur A, Jensen H, Larsen SW, Larsen C, Ostergaard J. Real-time UV imaging of drug diffusion and release from Pluronic F127 hydrogels. Eur J Pharm Sci. 2011;43(4):236–243. doi: 10.1016/j.ejps.2011.04.015. [DOI] [PubMed] [Google Scholar]
- 30.Jensen SS, Jensen H, Cornett C, Moller EH, Ostergaard J. Real-time UV imaging identifies the role of pH in insulin dissolution behavior in hydrogel-based subcutaneous tissue surrogate. Eur J Pharm Sci. 2015;69:26–36. doi: 10.1016/j.ejps.2014.12.015. [DOI] [PubMed] [Google Scholar]
- 31.Pajander J, Baldursdottir S, Rantanen J, Ostergaard J. Behaviour of HPMC compacts investigated using UV-imaging. Int J Pharm. 2012;427(2):345–353. doi: 10.1016/j.ijpharm.2012.02.034. [DOI] [PubMed] [Google Scholar]
- 32.Box K, Comer J, Mole J, Taylor R, Karki S, Price R, Fotaki N. Small scale assays for studying dissolution and precipitation of pharmaceutical cocrystals. 2012. Accessed 12 Dec 2012. Available from http://abstracts.aapspharmaceutica.com/Verify/AAPS2012/postersubmissions/T2040.pdf. AAPS J. [DOI] [PMC free article] [PubMed]
- 33.Qiao N, Wang K, Schlindwein W, Davies A, Li M. In situ monitoring of carbamazepine-nicotinamide cocrystal intrinsic dissolution behaviour. Eur J Pharm Biopharm. 2013;83(3):415–426. doi: 10.1016/j.ejpb.2012.10.005. [DOI] [PubMed] [Google Scholar]
- 34.Li M, Qiao N, Wang K. Influence of sodium lauryl sulfate and Tween 80 on carbamazepine-nicotinamide cocrystal solubility and dissolution behaviour. Pharmaceutics. 2013;5(4):508–524. doi: 10.3390/pharmaceutics5040508. [DOI] [PMC free article] [PubMed] [Google Scholar]
- 35.Hiew TN, Alaudin MIB, Chua SM, Heng PWS. A study of the impact of excipient shielding on initial drug release using UV imaging. Int J Pharm. 2018;553:229–237. doi: 10.1016/j.ijpharm.2018.10.040. [DOI] [PubMed] [Google Scholar]
- 36.Asare-Addo K, Walton K, Ward A, Totea AM, Taheri S, Alshafiee M, Mawla N, Bondi A, Evans W, Adebisi A, Conway BR, Timmins P. Direct imaging of the dissolution of salt forms of a carboxylic acid drug. Int J Pharm. 2018;551(1–2):290–299. doi: 10.1016/j.ijpharm.2018.09.048. [DOI] [PubMed] [Google Scholar]
- 37.Gautschi N, Van Hoogevest P, Kuentz M. Amorphous drug dispersions with mono- and diacyl lecithin: on molecular categorization of their feasibility and UV dissolution imaging. Int J Pharm. 2015;491(1–2):218–230. doi: 10.1016/j.ijpharm.2015.06.039. [DOI] [PubMed] [Google Scholar]
- 38.Kevadiya BD, Barvaliya M, Zhang L, Anovadiya A, Brahmbhatt H, Paul P, et al. Fenofibrate nanocrystals embedded in oral strip-films for bioavailability enhancement. Bioengineering (Basel). 2018;5(1). [DOI] [PMC free article] [PubMed]
- 39.Ye F, Larsen SW, Yaghmur A, Jensen H, Larsen C, Østergaard J. Real-time UV imaging of piroxicam diffusion and distribution from oil solutions into gels mimicking the subcutaneous matrix. Eur J Pharm Sci. 2012;46(1):72–78. doi: 10.1016/j.ejps.2012.02.011. [DOI] [PubMed] [Google Scholar]
- 40.Niederquell A, Kuentz M. Biorelevant dissolution of poorly soluble weak acids studied by UV imaging reveals ranges of fractal-like kinetics. Int J Pharm. 2014;463(1):38–49. doi: 10.1016/j.ijpharm.2013.12.049. [DOI] [PubMed] [Google Scholar]
- 41.Nielsen LH, Gordon S, Pajander JP, Ostergaard J, Rades T, Mullertz A. Biorelevant characterisation of amorphous furosemide salt exhibits conversion to a furosemide hydrate during dissolution. Int J Pharm. 2013;457(1):14–24. doi: 10.1016/j.ijpharm.2013.08.029. [DOI] [PubMed] [Google Scholar]
- 42.United States Pharmacopeial Convention . The United States Pharmacopeia: USP32. The National Formulary: NF27. Rockville: United States Pharmacopeial Convention; 2009. [Google Scholar]
- 43.Klein S. The use of biorelevant dissolution media to forecast the in vivo performance of a drug. AAPS J. 2010;12(3):397–406. doi: 10.1208/s12248-010-9203-3. [DOI] [PMC free article] [PubMed] [Google Scholar]
- 44.Fotaki N, Vertzoni M. Biorelevant dissolution methods and their applications in in vitro-in vivo correlations for oral formulations. Open Drug Deliv J. 2010;4(2):2–13. [Google Scholar]
- 45.Vertzoni M, Dressman J, Butler J, Hempenstall J, Reppas C. Simulation of fasting gastric conditions and its importance for the in vivo dissolution of lipophilic compounds. Eur J Pharm Biopharm. 2005;60(3):413–417. doi: 10.1016/j.ejpb.2005.03.002. [DOI] [PubMed] [Google Scholar]
- 46.Vertzoni M, Fotaki N, Kostewicz E, Stippler E, Leuner C, Nicolaides E, Dressman J, Reppas C. Dissolution media simulating the intralumenal composition of the small intestine: physiological issues and practical aspects. J Pharm Pharmacol. 2004;56(4):453–462. doi: 10.1211/0022357022935. [DOI] [PubMed] [Google Scholar]
- 47.Diebold SM. Physiological parameters relevant to dissolution testing: hydrodynamic considerations. In: Dressman J, Kramer J, editors. Pharmaceutical dissolution testing. Boca Raton: CRC; 2005. pp. 127–191. [Google Scholar]
- 48.Lenke J. Two dimensional orthogonal imaging of laminar fluid flow across API surface: insight into dosage concentration inside GI lumen and permeability. Accessed 12 June 2012 from http://www.sciforum.net/presentation/523. In: 1st Electron Conf Pharm Sci; 2011. p. 1–18.
- 49.Fotaki N. Flow-through cell apparatus (USP apparatus 4): operation and features. Diss Tech. 2011;18(4):46–49. [Google Scholar]
- 50.Fotaki N, Reppas C. The flow through cell methodology in the evaluation of intralumenal drug release characteristics. Diss Tech. 2005;12(2):17–21. [Google Scholar]
- 51.Long CM. PhD thesis: Biopharmaceutical considerations and in vitro-in vivo correlations (IVIVCs) for orally administered amorphous formulations. 2014. Available from: http://opus.bath.ac.uk/42017. Accessed 5 Feb 2019
- 52.Naylor LJ, Bakatselou V, Dressman JB. Comparison of the mechanism of dissolution of hydrocortisone in simple and mixed micelle systems. Pharm Res. 1993;10(6):865–870. doi: 10.1023/a:1018961227717. [DOI] [PubMed] [Google Scholar]
- 53.Wiedmann TS, Kamel L. Examination of the solubilization of drugs by bile salt micelles. J Pharm Sci. 2002;91(8):1743–1764. doi: 10.1002/jps.10158. [DOI] [PubMed] [Google Scholar]
- 54.Jensen SS, Jensen H, Goodall DM, Ostergaard J. Performance characteristics of UV imaging instrumentation for diffusion, dissolution and release testing studies. J Pharm Biomed Anal. 2016;131:113–123. doi: 10.1016/j.jpba.2016.08.018. [DOI] [PubMed] [Google Scholar]
- 55.Paraytec Ltd . SDI 300 manual: theory and operation. York, UK: P/N 340-9004 Rev A; 2010. pp. 1–32. [Google Scholar]
- 56.Nelson KG, Shah AC. Convective diffusion model for a transport-controlled dissolution rate process. J Pharm Sci. 1975;64(4):610–614. doi: 10.1002/jps.2600640407. [DOI] [PubMed] [Google Scholar]
- 57.Goodall D, Chapman A. Matching theory and observations for surface dissolution imaging experiments. 2012. In: http://www.parayteccom/docs/339/matching-theory-and-observations-for-surface-dissolutionpdf.
- 58.Langham ZA, Booth J, Hughes LP, Reynolds GK, Wren SA. Mechanistic insights into the dissolution of spray-dried amorphous solid dispersions. J Pharm Sci. 2012;101(8):2798–2810. doi: 10.1002/jps.23192. [DOI] [PubMed] [Google Scholar]
- 59.Six K, Daems T, de Hoon J, Van Hecken A, Depre M, Bouche MP, Prinsen P, Verreck G, Peeters J, Brewster ME, Van den Mooter G. Clinical study of solid dispersions of itraconazole prepared by hot-stage extrusion. Eur J Pharm Sci. 2005;24(2–3):179–186. doi: 10.1016/j.ejps.2004.10.005. [DOI] [PubMed] [Google Scholar]
- 60.Nunthanid J, Huanbutta K, Sriamornsak P, Limmatvapirat S, Luangtana-anan M, Yoshihashi Y, Yonemochi E, Terada K. Swelling kinetics of spray-dried chitosan acetate assessed by magnetic resonance imaging and their relation to drug release kinetics of chitosan matrix tablets. Eur J Pharm Biopharm. 2011;77(2):320–326. doi: 10.1016/j.ejpb.2010.11.019. [DOI] [PubMed] [Google Scholar]
- 61.Pouton CW. Lipid formulations for oral administration of drugs: non-emulsifying, self-emulsifying and ‘self-microemulsifying’ drug delivery systems. Eur J Pharm Sci. 2000;11:S93–S98. doi: 10.1016/s0928-0987(00)00167-6. [DOI] [PubMed] [Google Scholar]


