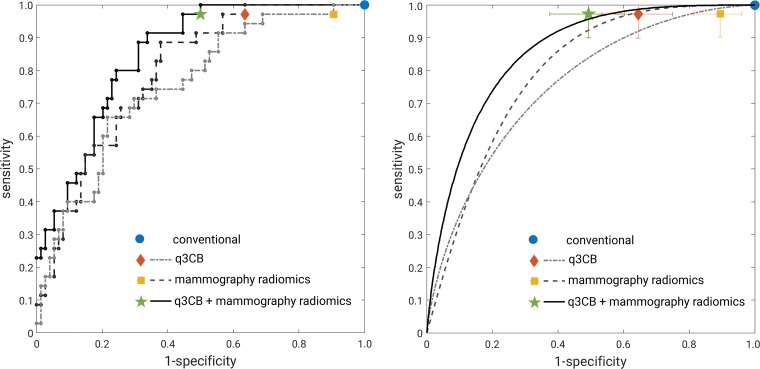
Figure 6:
Receiver operating characteristic analysis. Left, “raw staircase” receiver operating characteristic curves with operating points (no error bars for clarity) and, right, receiver operating characteristic curves fitted with the proper binormal model (30) with operating points. Error bars represent 95% confidence intervals. q3CB = quantitative three-compartment breast analysis.

