Abstract
Purpose
To evaluate myocardial strain and circumferential transmural strain difference (cTSD; the difference between epicardial and endocardial circumferential strain) in a genotyped cohort with hypertrophic cardiomyopathy (HCM) and to explore correlations between cTSD and other anatomic and functional markers of disease status. Left ventricular (LV) dysfunction may indicate early disease in preclinical HCM (sarcomere mutation carriers without LV hypertrophy). Cardiac MRI feature tracking may be used to evaluate myocardial strain in carriers of HCM sarcomere mutation.
Materials and Methods
Participants with HCM and their family members participated in a prospective, multicenter, observational study (HCMNet). Genetic testing was performed in all participants. Study participants underwent cardiac MRI with temporal resolution at 40 msec or less. LV myocardial strain was analyzed by using feature-tracking software. Circumferential strain was measured at the epicardial and endocardial surfaces; their difference yielded the circumferential transmural strain difference (cTSD). Multivariable analysis to predict HCM status was performed by using multinomial logistic regression adjusting for age, sex, and LV parameters.
Results
Ninety-nine participants were evaluated (23 control participants, 34 participants with preclinical HCM [positive for sarcomere mutation and negative for LV hypertrophy], and 42 participants with overt HCM [positive for sarcomere mutation and negative for LV hypertrophy]). The average age was 25 years ± 11 and 44 participants (44%) were women. Maximal LV wall thickness was 9.5 mm ± 1.4, 9.8 mm ± 2.2, and 16.1 mm ± 5.3 in control participants, participants with preclinical HCM (P = .496 vs control participants), and participants with overt HCM (P < .001 vs control participants), respectively. cTSD for control participants, preclinical HCM, and overt HCM was 14% ± 4, 17% ± 4, and 22% ± 7, respectively (P < .01 for all comparisons). In multivariable models (controlling for septal thickness and log-transformed N-terminal brain-type natriuretic peptide), cTSD was predictive of preclinical and overt HCM disease status (P < .01).
Conclusion
Cardiac MRI feature tracking identifies myocardial dysfunction not only in participants with overt hypertrophic cardiomyopathy, but also in carriers of sarcomere mutation without left ventricular hypertrophy, suggesting that contractile abnormalities are present even when left ventricular wall thickness is normal.
© RSNA, 2018
Summary
The difference in circumferential strain between the endocardial and epicardial left ventricular myocardium is greatest in individuals with overt hypertrophic cardiomyopathy, but may also be abnormal in carriers of preclinical mutation of the disease.
Implications for Patient Care
■ The difference in circumferential strain between the endocardial and epicardial layers of the left ventricular myocardium can be readily measured at MRI by using myocardial feature tracking.
■ The difference in myocardial strain between the endocardium and epicardium reflects underlying myocardial dysfunction in individuals with overt hypertrophic cardiomyopathy.
■ The difference in myocardial strain between the endocardium and epicardium may be abnormal in individuals with preclinical hypertrophic cardiomyopathy and normal ventricular wall thickness; this suggests a potential role of myocardial strain measurement to identify early disease expression in these individuals.
Introduction
Hypertrophic cardiomyopathy (HCM) is the most common genetic cardiomyopathy, affecting up to one in 500 people (1). HCM is diagnosed by using conventional echocardiographic or cardiac MRI by a maximal left ventricular (LV) wall thickness greater than 15 mm in adults and a z score greater than 2 in children in the absence of other causes for wall thickening (2). Modified criteria are typically used for at-risk relatives (3), and a z score greater than 3 has been suggested for children to better match disease prevalence (4). Sarcomere gene mutations are the most prevalent genetic cause of HCM (5). However, phenotypic expression of overt LV hypertrophy is often delayed until adulthood and penetrance is incomplete. Sarcomere mutation carriers without LV hypertrophy are termed preclinical HCM and are at risk for developing overt HCM. Our understanding of the progression from preclinical to overt HCM is limited. Echocardiographic strain studies have identified diastolic dysfunction in preclinical HCM (6,7) but preserved systolic function. To our knowledge, cardiac MRI studies have not been previously performed to characterize myocardial strain in preclinical HCM.
In healthy individuals, circumferential LV strain differs at the epicardium compared with the endocardium (eg, −16% vs −32%, respectively) (8,9). This difference between epicardial and endocardial strain (eg, −16% minus −32%, or 16%) is because of the smaller endocardial radius and is less than expected from geometric considerations because of a gradient in the myocardial fiber angle across the thickness of the LV wall. This gradient in fiber angle results in greater (ie, more negative) circumferential strain at the endocardium and lower (ie, less negative) strain at the epicardium (9).
With conventional tagged MRI, strain measurements are inaccurate at the endo- and epicardial surfaces because of partial volume averaging with the blood pool and trabecula. Nearly all cardiac MRI studies report midmyocardial strain. However, cardiac MRI feature tracking may be ideal for calculating strain differences at the endocardial and epicardial surfaces of the heart (Fig 1). We hypothesize that differences in strain between epicardial and endocardial surfaces may be elevated in HCM because of a combination of increased wall thickening, myocardial fibrosis (interstitial and replacement), and subendocardial dysfunction or disarray. Thus, the purpose of this study was to evaluate myocardial strain and circumferential transmural strain difference (cTSD; the difference between epicardial and endocardial circumferential strain) in a genotyped cohort with HCM. We also explored correlations between cTSD and other anatomic and functional markers of disease status.
Figure 1:
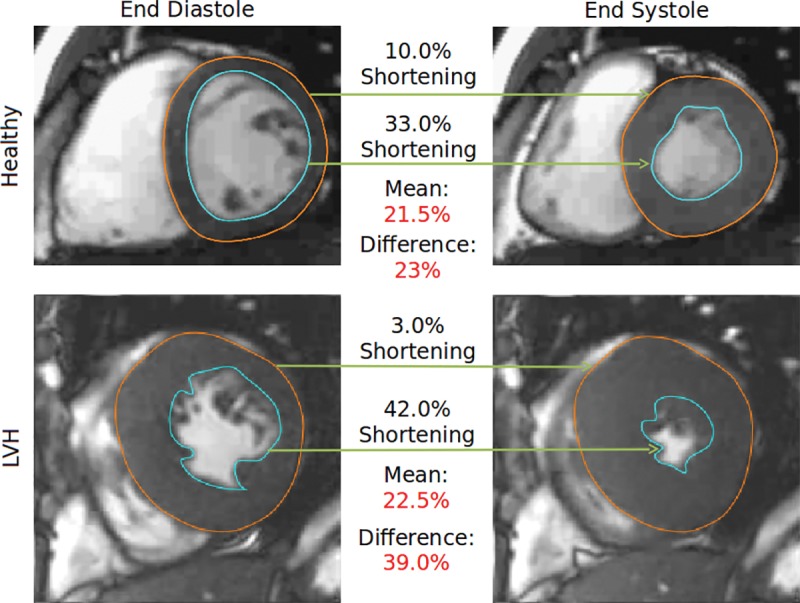
Circumferential transmural strain difference (cTSD). This figure illustrates the concept of cTSD in a healthy participant (healthy, top) and one with hypertrophic cardiomyopathy (LVH, bottom). Note that in the hypertrophied myocardium, epicardial shortening (orange) is lower and endocardial shortening (blue) is higher relative to the healthy scan. This divergence is diluted by taking the mean (analogous to midwall strain) but is enhanced by taking the difference (ie, the cTSD). LVH = left ventricular hypertrophy.
Materials and Methods
Participant Population
Participants with a clinical diagnosis of HCM and their family members participated in a multicenter (10 centers), observational, cross-sectional study (the HCMNet), and a subset of these participants underwent cardiac MRI (10). The institutional review boards of all participating institutions, including the echocardiographic and cardiac MRI core laboratories, approved the study. Written informed consent was obtained. Baseline enrollment was between 2009 and 2011. Individuals who lacked pathogenic or likely pathogenic sarcomere gene mutation were control participants. LV hypertrophy was defined as maximal LV wall thickness 12 mm or greater for adults or z score of 2 or greater for children on the basis of echocardiographic core laboratory measurement of LV wall thickness. On the basis of genetic and imaging studies, participants were categorized as either genotype-negative healthy participants (G-negative/LV hypertrophy-negative), preclinical HCM (G-positive/LV hypertrophy-negative), or overt HCM (G-positive/LV hypertrophy-positive), in which G is genotype. Participants with significant structural or functional cardiac abnormalities other than HCM, with conditions resulting in increased collagen turnover, and who were either pregnant or lactating were excluded from the study.
Cardiac MR Image Acquisition
Standardized cardiac MRI was performed at nine centers that used 1.5-T imagers and one that used a 3-T imager (Espree or Avanto, Siemens Medical Systems, Erlangen, Germany; Intera, Philips Medical Systems, Best, the Netherlands; Signa, GE Medical Systems, Waukesha, Wis). Short-axis, horizontal long-axis, and vertical long-axis cine series were acquired by using a steady-state free precession sequence with representative repetition time msec/echo time msec values of 2.2/1.1 at 1.5 T (flip angle, 60°). Short-axis cine images consisted of 10–12 sections covering from 1 cm above the mitral valve plane to the apex with 8-mm thickness and a 2-mm gap between sections. Late gadolinium chelate–enhanced cardiac MRI was performed after 0.15 mmol/kg intravenous contrast-agent administration to assess the extent of myocardial scar.
Image Analysis
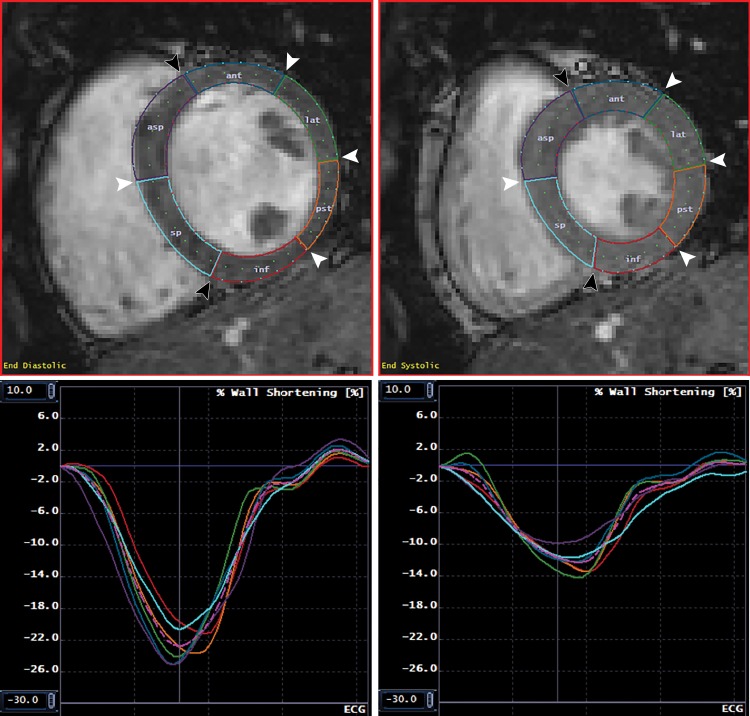
Feature tracking strain analysis of midventricular short-access steady-state free precession cine series was measured by using an algorithm (Multimodality Tissue Tracking v6.1.4826; Toshiba Medical Systems Corporation, Tokyo, Japan) (11). Preliminary studies demonstrated poor feature tracking on longitudinal views because of poor tracking of the endpoints of the contours; therefore, we evaluated only circumferential strain. Endocardial and epicardial contours were drawn in a semiautomated fashion, and the ventricle was segmented into six segments according to the American Heart Association model by setting the anterior and inferior right ventricular insertion points (Fig 2). Points along the contour at end diastole were used to define a 10 × 10 mm neighborhood, which was matched to a neighborhood in the subsequent frame within a search window by minimizing the sum of squared differences between the pixel intensities. The most prominent features on cardiac MR steady-state free precession images are located on the epicardial and endocardial surface, and there is a known difference in strain between these layers of myocardium. Therefore, we also defined the cTSD between epicardial and endocardial strain (more positive cTSD indicated greater transmural dysfunction). LV mass, LV and left atrium volumes, and functional parameters were determined by using software (CIM; University of Auckland, Auckland, New Zealand). Wall thickness was measured by using CMR42 (Circle Cardiovascular Imaging; Calgary, Canada). By convention, circumferential strain is negative with greater shortening. Image analysis for all participants was performed by echocardiographic and cardiac MRI core laboratories.
Figure 2:
Normal myocardial contours and corresponding circumferential strain. MR images show endocardial and epicardial contours and segmentation at end diastole (upper left) and end systole (upper right), with corresponding segmental and global circumferential strain curves at the endocardial (lower left) and epicardial (lower right) surfaces. Images are from a short-axis midslice in a healthy 24-year-old white man with negative genetic testing. Note that peak endocardial circumferential strain is substantially more negative than peak epicardial circumferential strain. Black arrowheads indicate the anterior and inferior septal insertion points; white arrowheads indicate the junctions between American Heart Association segments. The colored lines in the lower panels correspond to the colored segments in the upper graphs. The pink dotted line represents the mean of all segments. ant = anterior, asp = anteroseptal, inf = inferior, lat = anterolateral, pst = posterolateral, sp = inferoseptal.
Statistical Analysis
Continuous and discrete data were presented as mean ± standard deviation, and number and percentage, respectively. At univariate analysis, means were compared by Student t test following analysis of variance when more than two groups were compared. Categorical data were compared by using Pearson χ2 test. Continuous variables were regressed by using Pearson correlation, with the absolute value of r of 0.7 or greater considered strong; 0.3–0.7, moderate; and less than 0.3, no linear relationship. For single comparisons, P values less than .05 were considered to indicate statistical significance. For number of participant comparisons, P values less than .05/number of participants were considered to indicate significance (Bonferroni correction). Multivariable analysis to predict genotype (control vs preclinical HCM vs overt HCM, with control specified as the reference) was performed by using multinomial logistic regression. An initial (fully adjusted) model was constructed by controlling for demographics (age and female sex) and relevant cardiac parameters (average cTSD, septal thickness, LV mass index, early myocardial relaxation velocity measured at the septal mitral annulus [septal E’ velocity, measured at echocardiography], and log-adjusted N-terminal brain-type natriuretic peptide [ln {NTproBNP}]). A refined (ie, minimally adjusted) model was constructed by backward elimination (ie, by successively removing the least significant parameter as judged by the change in the log likelihood of the model until all predictors were significantly related to at least one outcome). No variables were preselected to survive backward elimination. The odds ratio (ie, the exponentiated log odds) per unit change in the predictor is reported. Cardiac volumes were indexed to body surface area. In a subset of 33 randomly selected participants, intra- and interobserver reproducibility were evaluated visually by Bland-Altman analysis; correlation and bias were assessed by intraclass correlation coefficient and Student t test, respectively. Intraclass correlation coefficient of 0.75 or greater was considered excellent; 0.75–0.40, moderate; and less than 0.40, poor. Statistical analysis was performed by using software (R version 3.5.0; www.r-project.org).
Geometric Modeling of Cardiac Contraction
Endocardial strain is more negative than epicardial strain in control participants because of the geometric constraints of the myocardium (9). Given a fixed LV diameter, cTSD will increase as a function of increasing wall thickness. Therefore, we performed simulations to explore the influence of any difference in wall thickness between control participants and participants with preclinical HCM on cTSD to rule out the possibility that a difference in cTSD observed between the control participants and participants with preclinical HCM could be solely the result of a difference in wall thickness, rather than a change in contractile function related to the underlying sarcomere mutation. The myocardium was modeled as two concentric circles that represented the epicardium and endocardium, with a fixed fractional area increase between systolic and diastolic phases, by using the measured values for epicardial circumferential strain, epicardial radius of the LV at end diastole, and end diastolic wall thickness to calculate expected cTSD. Full details of the method are in Appendix E1 (online).
Results
Participant Characteristics
The study cohort consisted of 99 participants: 23 control participants (23%), 34 participants with preclinical HCM (34%), and 42 participants with overt HCM (42%). The average age was 25 years ± 11. Forty-four (44%) participants were women and eight participants (8%) were nonwhite. Compared with control participants (Table 1), participants with preclinical HCM were similar in demographic features, whereas those with overt HCM were older (22 years ± 7 vs 30 years ± 13, respectively; P < .01) and more commonly men (35% vs 69%, respectively; P = .016). Relative to control participants, participants with overt HCM had greater LV wall thicknesses (9.5 mm ± 1.4 vs 16.1 mm ± 5.3, respectively; P < .001), higher ejection fraction (59% ± 4 vs 66% ± 9, respectively; P < .001), higher LV mass index (63 g/m2 ± 13 vs 88 g/m2 ± 25, respectively; P < .001), lower indexed end systole volume (32 mL/m2 ± 7 vs 26 mL/m2 ± 10, respectively; P = .011), higher indexed left atrium end diastole volume (32 mL/m2 ± 9 vs 48 mL/m2 ± 18, respectively; P < .001), and lower septal E’ velocity (14 cm/sec ± 2 vs 10 cm/sec ± 3, respectively; P < .001) and corresponding septal E’ velocity z score (0 ± 0.6 vs −1.4 ± 1.4, respectively; P < .01) (Table 2). Relative to control participants, participants with preclinical HCM had lower indexed end systole volume (32 mL/m2 ± 7 vs 26 mL/m2 ± 7, respectively; P < .01) and higher ejection fraction (59% ± 4 vs 63% ± 7, respectively; P < .01) relative to control participants, but were otherwise phenotypically similar.
Table 1:
Baseline Characteristics of the Study Population
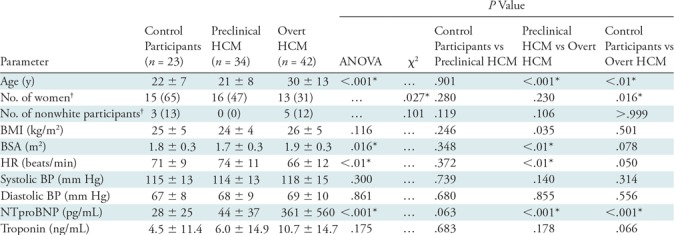
Note.—Unless otherwise indicated, data are mean ± standard deviation. ANOVA = analysis of variance, BMI = body mass index, BP = blood pressure, BSA = body surface area, HCM = hypertrophic cardiomyopathy, HR = heart rate, NTproBNP = N-terminal probrain natriuretic peptide.
*P values that remained significant after Bonferroni correction (with n = 3).
†Data in parentheses are percentages.
Table 2:
MRI and Echocardiography Parameters
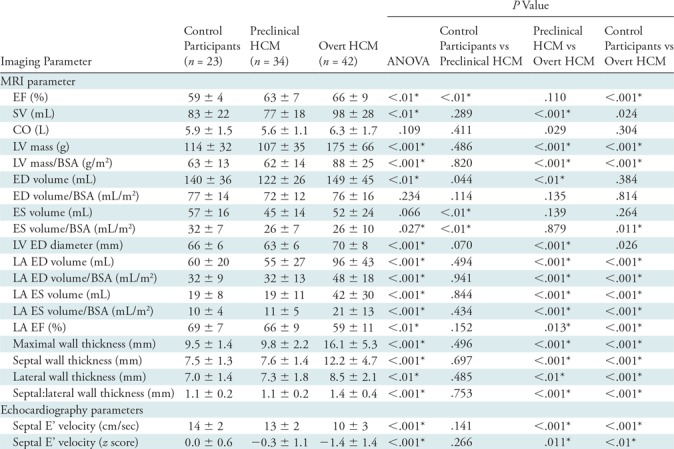
Note.—Data are mean ± standard deviation unless otherwise indicated. ANOVA = analysis of variance, BSA = body surface area, CO = cardiac output, ED = end diastole, EF = ejection fraction, ES = end systole, HCM = hypertrophic cardiomyopathy, LA = left atrium, LV = left ventricle, SV = stroke volume.
*P values that remain significant after Bonferroni correction (with n = 3).
Circumferential Strain and cTSD
Of the 99 midventricular short-access series analyzed, seven (7%) were excluded because of poor image quality (motion artifacts and/or steady-state free precession banding artifacts directly involving the LV, n = 4) or poor tracking (self-intersecting contours and/or contours that extended into the myocardium rather than tracking the bloodpool for some cardiac phases, n = 3). With cardiac MRI feature tracking, mean endocardial and epicardial circumferential strain in participants with preclinical HCM were similar to control participants (endocardial strain, −25% ± 4 vs −27% ± 5, respectively, P = .053; and epicardial strain, −12% ± 2 vs −11% ± 3, respectively, P = .293). Endocardial circumferential strain was significantly greater in participants with overt HCM compared with control participants (−25% ± 4 versus −30% ± 5, respectively; P < .001) and epicardial circumferential strain was significantly less in participants with overt HCM compared with control participants (−12% ± 2 vs −9% ± 4, respectively; P < .01).
cTSD was greater in both groups with sarcomere mutation compared with the control participants: average cTSD was lowest in the control group (14% ± 4), intermediate in the group with preclinical HCM (17% ± 4, P < .001, vs control participants), and greatest in the overt HCM group (22% ± 7, P < .001, vs control participants) (Table 3).
Table 3:
Global Segmental cTSD Strain Results Comparing Control Participants, Participants with Preclinical HCM, and Participants with Overt HCM
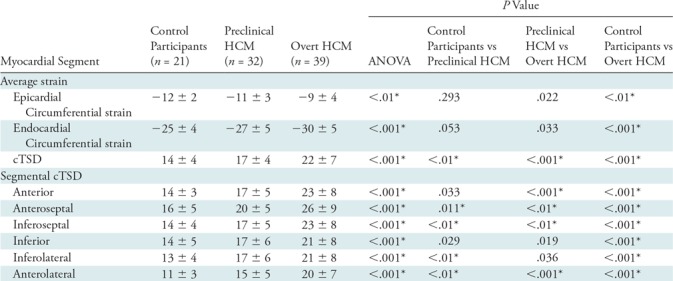
Note.–Unless otherwise indicated, data are mean ± standard deviation. Segmental differences in circumferential transmural strain difference were noted between control participants and participants with preclinical HCM in the lateral and septal segments. ANOVA = analysis of variance, cTSD = circumferential transmural strain difference, HCM = hypertrophic cardiomyopathy.
*P values that remain significant after Bonferroni correction (with n = 3).
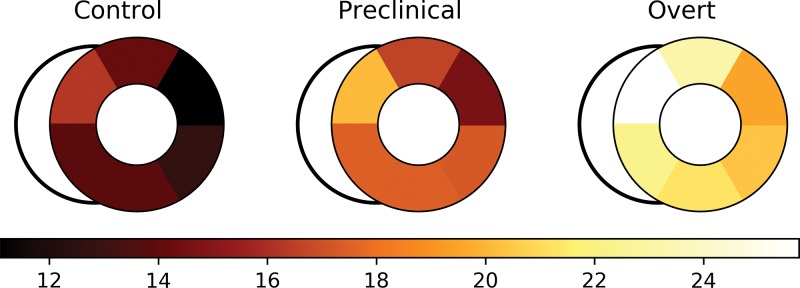
We also evaluated regional strain. Each of the six midventricular segments was compared between control, preclinical, and overt groups (Table 3). cTSD (Fig 3) was significantly greater in participants with overt HCM compared with control participants in all segments (P < .001). cTSD was greater in participants with preclinical HCM compared with control participants in the lateral and septal segments (P < .01).
Figure 3:
Segmental circumferential transmural strain difference (cTSD) is more negative in participants with preclinical and overt hypertrophic cardiomyopathy (HCM; middle and right side, respectively) compared with control participants (left side). Segmental cTSD values are presented for control, preclinical HCM, and overt HCM groups. Differences between control participants and participants with preclinical HCM were significant in the septal and lateral segments.
Correlation of cTSD with Functional Parameters
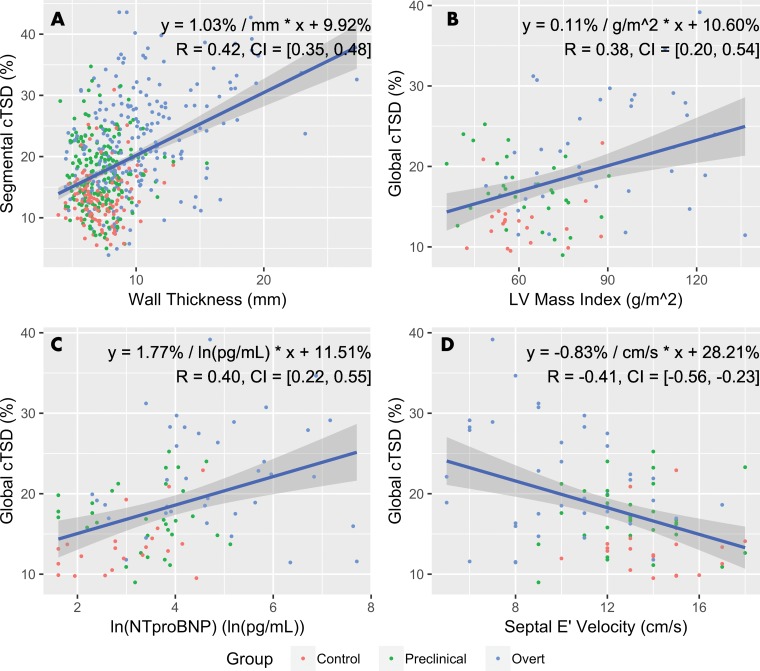
By considering all study participants, segmental cTSD was correlated with increased wall thickness (b = 1.0% per millimeter; r = 0.42; 95% confidence interval: 0.35, 0.48) (Fig 4). Average cTSD was correlated with increased LV mass index (b = 0.11% per g/m2 increase in LV mass index; r = 0.38; 95% confidence interval: 0.20, 0.54) and ln (NTproBNP) (b = 1.8% per ln [pg/mL]; r = 0.40; 95% confidence interval: 0.22, 0.55) and was inversely correlated with increased septal E’ velocity (b = −0.83% per cm/sec; r = −0.41; 95% confidence interval: −0.56, −0.23). cTSD was not correlated with the extent of late gadolinium-chelate enhancement at cardiac MRI.
Figure 4:
Graphs show correlation of circumferential transmural strain difference (cTSD) with functional parameters. Globally, cTSD moderately correlates left ventricular (LV) mass index, log-adjusted N-terminal brain-type natriuretic peptide (ln [NTproBNP]), and septal E’ velocity; segmentally, cTSD correlates moderately with wall thickness. Equations of linear regression lines and Pearson R coefficients are indicated. Gray regions surrounding regression lines indicate 95% confidence intervals (CIs).
Multivariable Analysis
Multinomial logistic regression was performed to predict disease status (control participants vs participants with preclinical HCM vs participants with overt HCM; Table 4). In the final minimally adjusted model (following backward elimination), average cTSD (odds ratio, 1.41 per unit percentage change in cTSD; P < .01), ln (NTproBNP) (odds ratio, 2.55 per ln [pg/mL]; P = .012), and septal thickness (odds ratio, 1.83 per millimeter; P = .035) were significantly associated with overt HCM status. For carriers of preclinical mutation, average cTSD was the only variable significantly associated with preclinical HCM status (odds ratio, 1.28 per percent; P < .01).
Table 4:
Multivariable Prediction of Disease Status from Imaging and Demographic Parameters

Note.—Data are from initial multinomial logistic regression models and refined models resulting from backward elimination. No variable was preselected to survive backward elimination. Odds ratios relative (ie, exponentiated log odds) for each predictor are reported. cTSD = circumferential transmural strain difference, HCM = hypertrophic cardiomyopathy, LV = left ventricle, NTproBNP = N-terminal probrain natriuretic peptide.
*P values that remain significant after Bonferroni correction (with n = 3).
Reproducibility
We reanalyzed 33 randomly selected cases for intra- and interobserver reproducibility of segmental strain measurements. Reproducibility of cTSD was excellent within observers (intraclass correlation coefficient, 0.783; 95% confidence interval: 0.722, 0.832) and moderate between observers (intraclass correlation coefficient, 0.670; 95% confidence interval: 0.584, 0.740). No intra- or interobserver bias was noted by Student t test (intraobserver P = .090 and .832, respectively) or visually by Bland-Altman analysis (Fig E1 [online]).
Geometric Modeling of Cardiac Contraction
In study participants from HCMNet, maximal LV wall thickness was slightly less for control participants compared with participants with preclinical HCM, although group differences were not significant (9.5 mm vs 9.8 mm, respectively; P = .496). Therefore, we performed simulations to explore whether the higher cTSD observed in participants with preclinical HCM could be solely the result of marginally greater wall thickness, rather than a change in contractile function related to the underlying sarcomere mutation (Fig E2 [online]). In this analysis, the calculated cTSD values were similar between control participants and those with preclinical HCM. Had the higher measured cTSD observed in the participants with preclinical HCM been simply a consequence of marginally greater wall thickness, we would expect simulated cTSD to be significantly higher. Similar cTSD between control participants and participants with preclinical HCM suggests that marginal wall thickness alone does not explain the measured difference in cTSD. For detailed results, see Appendix E1 (online).
Discussion
The major finding of our study was that cardiac MRI feature tracking identified systolic dysfunction in HCM participants with sarcomere mutations, regardless of the presence of wall thickening. A greater difference between epicardial and cTSD was present in overt HCM, and in carriers of preclinical sarcomere mutation compared with healthy control participants. Notably, analogous contractile abnormalities were not detected by conventional myocardial tagging. Our findings provide further evidence that functional myocardial abnormalities precede anatomic changes and reflect early phenotypic manifestations of sarcomere gene mutations.
Although relatively new, cardiac MRI feature tracking has been applied to various myocardial diseases (eg, cardiomyopathies, congenital structural abnormalities, valvular disease, and myocardial infarction). An advantage of feature tracking is that feature tracking is readily applied to conventional cine cardiac MRI; multiple commercial software packages are also available (12). Unlike myocardial tagging, feature tracking is unable to measure midwall strain because of the paucity of cardiac MRI features in the midwall of the myocardium. In this study, we instead took advantage of the intrinsic capabilities of feature tracking to evaluate the difference in myocardial strain at both myocardial surfaces, endocardial and epicardial. With this method, an abnormal pattern of systolic function was identified in participants with sarcomere mutations with a higher difference in circumferential strain across the myocardium.
The concept that genetic abnormalities in HCM result in early or occult functional abnormalities is based on results from echocardiography and biophysical models of mutant sarcomere proteins. Several echocardiographic studies have observed that LV diastolic function is reduced in participants with preclinical HCM compared with control participants (6,7). The degree of diastolic dysfunction is mild and variable, potentially related to penetrance and genetic variation (13). Biophysical studies (14–17) have indicated that HCM sarcomere mutations are associated with a gain of function with increased force generation. Echocardiographic studies have shown preserved LV systolic function in preclinical HCM (7,18), but reduced systolic strain with overt disease, suggesting that systolic dysfunction is not only the result of underlying sarcomere mutation but also from distinctive changes in myocardial architecture (hypertrophy, fibrosis, and disarray) that accompany the development of clinical disease. This study expands our understanding of the fundamental contractile abnormalities observed in HCM, demonstrating an abnormally high difference in circumferential strain between the endocardial an epicardial surfaces. Moreover, this abnormal pattern becomes more marked in clinically overt HCM. Although the physiologic underpinnings of this finding are unclear, we speculate that they reflect altered myocardial tissue characteristics, caused by the sarcomere mutation, and they become more pronounced when the ultrastructural changes of disease, fibrosis, hypertrophy, and disarray develop. Prospective investigation is needed to validate these findings, to characterize the underlying mechanisms, and to determine the clinical implications. Though we believe this study provided good evidence for a causative relationship between sarcomere mutation and higher cTSD in the preclinical group, we are agnostic as to whether this is the only disease state that could result in increased cTSD; though beyond our scope, it would be interesting in future work to investigate this parameter in other diseases resulting in LV hypertrophy.
Our study had limitations. This cohort was well characterized but relatively small (particularly the control group). Further prospective investigations in larger populations are needed to confirm these findings and provide greater understanding of the clinical implications. The participants in this study were young, which limited the range of disease represented, and age was different across groups; however, we do not feel the observed differences in cTSD could be explained by age because previous studies (19–21) failed to show a relationship between age and either midwall or endocardial circumferential strain. Not all participants with preclinical HCM ultimately express clinical disease, and in these participants we would not expect to observe abnormalities in cardiac function. Longitudinal follow-up was not available. The differences observed in strain were small relative to biologic variability. We were unable to adequately assess longitudinal LV strain, which may be software dependent and a limitation specific to multimodality tissue tracking. Finally, we used standard cardiac MR steady-state free precession images without further optimization of the pulse sequence for feature tracking.
In conclusion, cardiac MRI feature tracking allowed for characterization of systolic myocardial dysfunction in carriers of preclinical HCM mutation and in participants with overt HCM. Specifically, there is greater difference in circumferential strain between endocardium and epicardium in carriers of the sarcomere mutation that becomes more pronounced in participants with overt HCM. These findings also suggest that cardiac MRI feature tracking may be a favorable alternative to tagged cardiac MRI because routine cardiac MR sequences can be more feasibly acquired and analyzed. The feature tracking approach allows additional characterization of subtle abnormalities in myocardial mechanics that appear to be an early manifestation of sarcomere mutations. These results have potentially important clinical implications because they raise the possibility that a treatment strategy that diminishes the development of myocyte disarray, fibrosis, and hypertrophy, starting in the preclinical stage of disease, may have beneficial effects in attenuating systolic dysfunction and progression to symptomatic heart failure in HCM.
APPENDIX
SUPPLEMENTAL FIGURES
Study supported by National Institutes of Health Oxford Scholars Program (DMV), the National Institutes of Health Clinical Center (DMV), and the National Heart, Lung, and Blood Institute (1P20HL101408).
Disclosures of Conflicts of Interest: D.M.V. disclosed no relevant relationships. E.Y. Activities related to the present article: disclosed no relevant relationships. Activities not related to the present article: disclosed money to author’s institution from a T32 grant. Other relationships: disclosed no relevant relationships. P.J.J. disclosed no relevant relationships. M.W.T. disclosed no relevant relationships. H.F. disclosed no relevant relationships. L.C. disclosed no relevant relationships. J.A.N. disclosed no relevant relationships. S.M.D. Activities related to the present article: disclosed money paid to author’s institution for grants from American Heart Association and MyoKardia; disclosed money paid to author for consulting or honorarium from the MyoKardia advisory board. Activities not related to the present article: disclosed no relevant relationships. Other relationships: disclosed no relevant relationships. S.D.C. disclosed no relevant relationships. M.W.R. disclosed no relevant relationships. J.T. disclosed no relevant relationships. M.V.S disclosed no relevant relationships. C.E.C. disclosed no relevant relationships. L.S. disclosed no relevant relationships. C.Y.H. disclosed no relevant relationships. D.A.B. disclosed no relevant relationships.
Abbreviations:
- cTSD
- circumferential transmural strain difference
- HCM
- hypertrophic cardiomyopathy
- LV
- left ventricle
- ln (NTproBNP)
- log-adjusted N-terminal pro-brain natriuretic peptide
References
- 1.Maron BJ. Hypertrophic cardiomyopathy: a systematic review. JAMA 2002;287(10):1308–1320. [DOI] [PubMed] [Google Scholar]
- 2.Noureldin RA, Liu S, Nacif MS, et al. The diagnosis of hypertrophic cardiomyopathy by cardiovascular magnetic resonance. J Cardiovasc Magn Reson 2012;14:17. [DOI] [PMC free article] [PubMed] [Google Scholar]
- 3.McKenna WJ, Spirito P, Desnos M, Dubourg O, Komajda M. Experience from clinical genetics in hypertrophic cardiomyopathy: proposal for new diagnostic criteria in adult members of affected families. Heart 1997;77(2):130–132. [DOI] [PMC free article] [PubMed] [Google Scholar]
- 4.Ho CY, Cirino AL, Lakdawala NK, et al. Evolution of hypertrophic cardiomyopathy in sarcomere mutation carriers. Heart 2016;102(22):1805–1812. [DOI] [PubMed] [Google Scholar]
- 5.Seidman CE, Seidman JG. Identifying sarcomere gene mutations in hypertrophic cardiomyopathy: a personal history. Circ Res 2011;108(6):743–750. [DOI] [PMC free article] [PubMed] [Google Scholar]
- 6.Ho CY, Sweitzer NK, McDonough B, et al. Assessment of diastolic function with Doppler tissue imaging to predict genotype in preclinical hypertrophic cardiomyopathy. Circulation 2002;105(25):2992–2997. [DOI] [PubMed] [Google Scholar]
- 7.Ho CY, Carlsen C, Thune JJ, et al. Echocardiographic strain imaging to assess early and late consequences of sarcomere mutations in hypertrophic cardiomyopathy. Circ Cardiovasc Genet 2009;2(4):314–321. [DOI] [PMC free article] [PubMed] [Google Scholar]
- 8.Altiok E, Neizel M, Tiemann S, et al. Quantitative analysis of endocardial and epicardial left ventricular myocardial deformation-comparison of strain-encoded cardiac magnetic resonance imaging with two-dimensional speckle-tracking echocardiography. J Am Soc Echocardiogr 2012;25(11):1179–1188. [DOI] [PubMed] [Google Scholar]
- 9.Moore CC, Lugo-Olivieri CH, McVeigh ER, Zerhouni EA. Three-dimensional systolic strain patterns in the normal human left ventricle: characterization with tagged MR imaging. Radiology 2000;214(2):453–466. [DOI] [PMC free article] [PubMed] [Google Scholar]
- 10.Ho CY, Day SM, Colan SD, et al. The burden of early phenotypes and the influence of wall thickness in hypertrophic cardiomyopathy mutation carriers: findings from the HCMNet study. JAMA Cardiol 2017;2(4):419–428. [DOI] [PMC free article] [PubMed] [Google Scholar]
- 11.Ogawa K, Hozumi T, Sugioka K, et al. Usefulness of automated quantitation of regional left ventricular wall motion by a novel method of two-dimensional echocardiographic tracking. Am J Cardiol 2006;98(11):1531–1537. [DOI] [PubMed] [Google Scholar]
- 12.Bourfiss M, Vigneault DM, Aliyari Ghasebeh M, et al. Feature tracking CMR reveals abnormal strain in preclinical arrhythmogenic right ventricular dysplasia/ cardiomyopathy: a multisoftware feasibility and clinical implementation study. J Cardiovasc Magn Reson 2017;19(1):66. [DOI] [PMC free article] [PubMed] [Google Scholar]
- 13.Silva D, Madeira H, Almeida A, Brito D. Tissue Doppler imaging and plasma N-terminal probrain natriuretic peptide for the identification of hypertrophic cardiomyopathy mutation carriers. Am J Cardiol 2013;112(7):996–1004. [DOI] [PubMed] [Google Scholar]
- 14.Debold EP, Schmitt JP, Patlak JB, et al. Hypertrophic and dilated cardiomyopathy mutations differentially affect the molecular force generation of mouse α-cardiac myosin in the laser trap assay. Am J Physiol Heart Circ Physiol 2007;293(1):H284–H291. [DOI] [PubMed] [Google Scholar]
- 15.Palmer BM, Fishbaugher DE, Schmitt JP, et al. Differential cross-bridge kinetics of FHC myosin mutations R403Q and R453C in heterozygous mouse myocardium. Am J Physiol Heart Circ Physiol 2004;287(1):H91–H99. [DOI] [PubMed] [Google Scholar]
- 16.Blanchard E, Seidman C, Seidman JG, LeWinter M, Maughan D. Altered cross-bridge kinetics in the alphaMHC403/+ mouse model of familial hypertrophic cardiomyopathy. Circ Res 1999;84(4):475–483. [DOI] [PubMed] [Google Scholar]
- 17.Spindler M, Saupe KW, Christe ME, et al. Diastolic dysfunction and altered energetics in the alphaMHC403/+ mouse model of familial hypertrophic cardiomyopathy. J Clin Invest 1998;101(8):1775–1783. [DOI] [PMC free article] [PubMed] [Google Scholar]
- 18.Aly MFA, Brouwer WP, Kleijn SA, van Rossum AC, Kamp O. Three-dimensional speckle tracking echocardiography for the preclinical diagnosis of hypertrophic cardiomyopathy. Int J Cardiovasc Imaging 2014;30(3):523–533. [DOI] [PubMed] [Google Scholar]
- 19.Andre F, Steen H, Matheis P, et al. Age- and gender-related normal left ventricular deformation assessed by cardiovascular magnetic resonance feature tracking. J Cardiovasc Magn Reson 2015;17:25. [DOI] [PMC free article] [PubMed] [Google Scholar]
- 20.Cheng S, Larson MG, McCabe EL, et al. Age- and sex-based reference limits and clinical correlates of myocardial strain and synchrony: the Framingham Heart Study. Circ Cardiovasc Imaging 2013;6(5):692–699. [DOI] [PMC free article] [PubMed] [Google Scholar]
- 21.Mangion K, Clerfond G, McComb C, et al. Myocardial strain in healthy adults across a broad age range as revealed by cardiac magnetic resonance imaging at 1.5 and 3.0T: Associations of myocardial strain with myocardial region, age, and sex. J Magn Reson Imaging 2016;44(5):1197–1205. [DOI] [PMC free article] [PubMed] [Google Scholar]
Associated Data
This section collects any data citations, data availability statements, or supplementary materials included in this article.


