

Abstract
This review utilizes current national dietary guidelines and published databases to evaluate the impacts of reasonable shifts in the amount and type of protein intake in the United States on the intersection of human and environmental health. The established scientific basis and recommendations for protein intake as described in the US Dietary Reference Intakes are reviewed. Data on food availability from both the US Department of Agriculture and the Food and Agriculture Organization of the United Nations and data on consumption from the National Health and Nutrition Examination Survey are used to examine estimates of current US protein consumption. Greenhouse gas (carbon dioxide equivalents, CO2eq) and blue and green water impacts of US protein consumption resulting from US agricultural practices were obtained from previously published meta-analyses. A 25% decrease in protein intake paired with a 25% shift from animal food to plant food protein intake—from an 85:15 ratio to a 60:40 ratio—would best align protein intake with national dietary recommendations while simultaneously resulting in 40% fewer CO2eq emissions and 10% less consumptive water use. The modeling of this strategy suggests a savings of 129 billion kilograms of CO2eq and 3.1 trillion gallons of water relative to current consumption.
Keywords: animal-based protein, climate change, environment, Estimated Average Requirement, greenhouse gases, plant-based protein, protein, Recommended Dietary Allowance, sustainability, water
INTRODUCTION
Evidence is mounting for the adverse environmental impacts of the volume and types of foods and beverages produced and consumed nationally in the United States as well as globally. Specific concerns include emissions of greenhouse gases,1,2 farmland topsoil losses,3 and the pollution, depletion, and disruption of global water resources.4–6 Among the many different components of the human diet, beef and dairy products have been singled out as having a larger adverse environmental impact than most other dietary components, owing primarily to their heavy reliance on, and low efficiency of, converting crops to a feed.7–10 Meat is the major source of protein in the current US diet, and adequate protein is essential to good health. What is less clear and often confusing to many Americans is the optimal amount of protein needed for their health and how this compares with the amount they typically consume. This also raises the question of how well aligned US agricultural practices are with national dietary recommendations for protein intake.
According to data reported by the joint Organization for Economic Co-operation and Development–Food and Agricultural Organization (OECD-FAO) in 2018, Americans eat more meat from livestock sources, per person, than any other country in the world.11 According to the 2018 report, in the years 2015–2017, meat consumption in North America was an estimated 200 lbs per person per year. In comparison, annual meat consumption in Latin America and the Caribbean averaged approximately 130 lbs per person, in East Asia, South Asia, and the Pacific approximately 60 lbs per person, and in Africa only approximately 30 lbs per person.11 These numbers are increasing globally as more countries and cultures adopt a more Western-style diet.11,12 The most common types of livestock used for meat, as referred to above, are poultry, pig, and cattle, along with smaller amounts of sheep and goat. Additional animal-based protein sources are dairy and eggs, which are both heavily consumed in the United States and across many other parts of the world. Producing this much meat, dairy, and eggs efficiently and affordably for more than 300 million Americans has led to the widespread use of concentrated animal feeding operations and to increases in the production of corn and soy for use as livestock feed rather than for direct human consumption.13 While these developments have dramatically increased the access to and the affordability of animal-based protein, there is growing concern that they are contributing to a dual set of crises in human health and the health of the environment.1,14–16
There is a growing public health movement to promote a shift to a more plant-based, less animal-based diet.17 The objective of this review and analysis is fourfold: (1) to review the established scientific basis and recommendations for protein intake; (2) to examine how these recommendations align with current protein consumption in the United States; (3) to consider the current environmental impacts of US protein consumption resulting from US agricultural practices; and (4) to model and project a series of environmental impacts that could result from implementing several different strategies for shifting protein intake in the United States, thereby better aligning intake with dietary recommendations. Thus, the overall objective is to build a case for maximizing the intersection of human health and the health of the environment in the context of optimizing the amount and type of protein intake in the United States.
US RECOMMENDATIONS FOR PROTEIN INTAKE
Dietary Reference Intakes, Estimated Average Requirement, and Recommended Dietary Allowance
National recommendations for protein intake are based on the US Dietary Reference Intakes (DRIs), most recently updated in 2005.18 The DRIs for protein are presented in 2 distinct categories for 2 distinct purposes: the Estimated Average Requirement (EAR) (Table 1) and the Recommended Dietary Allowances (RDAs) (Table 2). The RDA is generally determined to be the EAR plus 2 standard deviations, so as to meet or exceed the requirement of 97.5% of the population. For women and men 18 years and older, the EAR is 0.66 g/kg of body weight, and the RDA is 0.8 g/kg of body weight. For a 57-kg woman, considered the reference, the EAR is 38 g/d and the RDA 46 g/d. For the reference 70-kg man, the EAR is 46 g/d and the RDA 56 g/d.
Table 1.
Estimated Average Requirement (EAR) for protein, by age and sex a
| Age group | EAR for protein (g/kg/d) |
|
|---|---|---|
| Females | Males | |
| 7–12 mo | 1.00 | 1.00 |
| 1–3 y | 0.87 | 0.87 |
| 4–8 y | 0.76 | 0.76 |
| 9–13 y | 0.76 | 0.76 |
| 4–18 y | 0.71 | 0.73 |
| > 18 yb | 0.66 | 0.66 |
Data from the Dietary Reference Intakes for Energy, Carbohydrate, Fiber, Fat, Fatty Acids, Cholesterol, Protein, and Amino Acids (2005).18
The EARs specified for each of the age groups of 19–30 y, 31–50 y, 51–70 y, and > 70 y are all identical. For the purpose of brevity, these age groups are presented here as > 18 y.
Table 2.
Recommended Dietary Allowances (RDAs) for protein, by age and sex a
| Age group | RDA for protein (g/kg/d) |
|
|---|---|---|
| Females | Males | |
| 7–12 mo | 1.20 | 1.20 |
| 1–3 y | 1.05 | 1.05 |
| 4–8 y | 0.95 | 0.95 |
| 9–13 y | 0.95 | 0.95 |
| 14–18 y | 0.85 | 0.85 |
| >18 yb | 0.80 | 0.80 |
Data from the Dietary Reference Intakes for Energy, Carbohydrate, Fiber, Fat, Fatty Acids, Cholesterol, Protein, and Amino Acids (2005).18
The RDA specified for each of the age groups of 19–30 y, 31–50 y, 51–70 y, and > 70 y is identical. For the purpose of brevity, these age groups are presented here as > 18 y.
Type and quality of protein: animal vs plant
With few exceptions, all foods contain protein. While the proportion and quality of protein differ somewhat from one food to another, there are general misconceptions in the US public about what these differences are. The quality of protein refers to the distribution of amino acids within the protein and in what amount the limiting amino acid is present. Essential amino acids cannot be synthesized by the body and therefore must be obtained from dietary sources; they include histidine, isoleucine, leucine, lysine, methionine, phenylalanine, threonine, tryptophan, and valine. The nonessential amino acids are alanine, arginine, asparagine, aspartic acid, cysteine, glutamic acid, glutamine, glycine, proline, serine, and tyrosine. This latter group can be produced from intermediates of various metabolic pathways in the body, and therefore they do not necessarily have to come from dietary sources. A typical day of eating a common variety of foods includes adequate amounts of both essential and nonessential amino acids, almost regardless of the presence or absence of animal foods (Figure 1, Table S1 in the Supporting Information online).
Figure 1.

Proportions of amino acids in selected foods across food groups. Amino acids are grouped as essential or nonessential, in descending order of prevalence within food groups. Amount of protein per 100 kcal is presented in Table S1. (Source: Nutrition Database System for Research, University of Minnesota; http://www.ncc.umn.edu/ndsr-database-page/). Abbreviations: Ala, alanine; Arg, arginine; Asp/n, aspartate and asparagine; Cys, cysteine; Glu/n, glutamate and glutamine; Gly, glycine; His, histidine; Iso, isoleucine; Leu, leucine; Lys, lysine; Met, methionine; Phe, phenylalanine; Pro, proline; Ser, serine; Thr, threonine; Trp, tryptophan; Tyr, tyrosine; Val, valine.
Protein quality and limiting amino acids.
The issue of dietary protein quality usually refers to the concept of the limiting amino acid. The limiting amino acid refers to the specific amino acid in a food that is present in the lowest proportion relative to an individual’s dietary requirement, which is a different amount for each amino acid. This is very different than simply being the amino acid present in the lowest amount in that food. Protein-containing foods do not contain the 20 amino acids in equal proportions. In many foods, tryptophan is the amino acid present in the lowest amount in comparison with the other amino acids. However, tryptophan is never the limiting amino acid in foods. While its proportion is low, the human requirement for tryptophan relative to other amino acids is also low. The 2 amino acids most likely to be limiting are lysine and methionine. Lysine tends to be the limiting amino acid in protein found in grains, and methionine in protein found in beans.
All plant foods have all 20 amino acids.
There are common misconceptions about whether all plant foods contain all 20 amino acids. It is widely believed among both health professionals and the general population that certain plant foods are entirely devoid of specific amino acids and, thus, that protein adequacy cannot be supported by plant foods alone. In fact, all plant foods contain all 20 dietary amino acids. Figure 1 (and Table S1 in the Supporting Information online) provides data on the proportions and amounts of each of the 20 amino acids found in a variety of animal and plant foods. Also included in Table S1 in the Supporting Information online are the grams of each amino acid per 100 kcal of each food. Notably, it would be unrealistic to think that anyone would obtain their entire daily protein needs from a single type of food in a given day, considering how ubiquitous protein is in all food sources.
Animal vs plant food sources of protein.
Meats contain protein and fat, but no carbohydrates. Plant foods contain protein, fat, and carbohydrates, with the largest component most often being the carbohydrate fraction (except for oilseeds). This explains why meats always have a higher proportion of protein per calorie (kilocalorie) than plant foods. In addition, the amino acid distribution of meats and other animal foods, including eggs and dairy, is more similar to the distribution needed by humans than is the distribution of amino acids in plant foods. Therefore, if it were difficult for individuals to meet their protein needs on a given day (eg, limited access to food), it could be easier to come closest to achieving protein adequacy by choosing animal foods over plant foods because of the better match-up of amino acid distributions. However, for those with access to a reasonably varied and diverse diet (eg, “…an eating pattern that is varied, nutritious and adequate in energy and other nutrients—not made up of, say, just cookies, crackers, potato chips and juice”), it would be rare for them to not meet their daily protein requirement from any of a diverse range of diets.19
Complementary amino acid distributions of different plant foods, typically not important for protein adequacy.
Mixed meals that contain a variety of plant foods can make up for the limiting amino acids of individual foods (eg, grains or legumes) by complementing one another; these are known as complementary proteins. While the protein in grains tends to be limiting in lysine, proportionally grains are relatively high in methionine. Conversely, while the protein in beans/legumes tends to be limiting in methionine, proportionally beans are relatively high in lysine. Therefore, consuming grains and beans/legumes together provides what is often referred to as complementary protein, the suggestion being that the distribution of amino acids in grains and beans/legumes consumed together is more similar to the distribution needed for humans than when these foods are eaten alone. It has been reported that complementary foods do not need to be eaten during the same hour or even the same meal to be effectively complementary but should be consumed within the same 24-hour period.20
Rarely, however, are there the situations in which it becomes important to make a conscious effort to complement one’s plant protein intake. There are 3 conditions that would need to be met simultaneously in order to create a need to complement plant-based proteins: total protein intake for the day was low (ie, close to an individual’s protein requirement); very little dietary variety was available or chosen; and no animal proteins were consumed, as in a vegan diet.
As will be presented here, most Americans consume a total protein intake that greatly exceeds their requirement. In addition, most Americans have access to and choose a diet comprised of a wide variety of foods. This can also be true for those following a vegan diet. Therefore, for the typical US consumer, even vegetarians and vegans, it is usually not necessary to pay close attention to whether complementary proteins have been consumed.21
Negligible impact of the ratio of plant protein to animal protein on the EAR and RDA.
The 2005 DRI for protein addresses the issue of plant vs animal protein in terms of the impact on protein recommendations. The DRIs for protein were determined from nitrogen balance studies (eg, those in which the maintenance of lean muscle mass was investigated). The following excerpt comes from the 2005 DRI: “ …the source of protein (90% animal, 90% vegetable, or mixed) did not significantly affect the median nitrogen requirement, slope, or intercept,”22 as determined by the research of Rand et al.23
In other words, even though the protein in plant foods is somewhat lower in quality than the protein in animal foods (owing to the concept of limiting amino acids), in mixed diets in which 90% of the protein derives from a variety of plant foods and only 10% of the protein derives from animal foods, the EAR and the DRI are no different than those for a typical American diet that is significantly higher in animal protein. Stated more simply, the difference between protein quality from a mostly plant-based diet and protein quality from a more animal-based diet is negligible for most people.
Protein requirements for the elderly, growing children, and pregnant women
Evidence shows that an increase in protein intake above what is recommended for the general adult population may reduce the aging population’s risk of osteoporosis, or bone loss, and sarcopenia, or muscle loss.24 The age category generally referred to here is 70 years of age and older. The literature supports an RDA of 1.0 to 1.2 g of protein per kilogram of body weight to maintain normal calcium metabolism, nitrogen balance, and renal function in the elderly.24,25 International recommendations also support an increase in protein intake for the elderly. The World Health Organization (WHO) recommends a protein intake of 0.9 to 1.1 g/kg/d for the elderly.26
The DRIs for protein intake per kilogram of body weight are modestly higher for children and pregnant women because of growth needs in these groups. For children aged 1 to 3 years, 4 to 13 years, and 14 to 18 years, the RDA is 1.05, 0.95, and 0.85 g/kg of body weight per day, respectively. The RDA for pregnant women of all ages is 1.1 g/kg of body weight per day.
Protein requirements for athletes
Another population that may have an increased need for daily protein is athletes. Several lines of research suggest that athletes may need a protein intake of between 1.2 and 1.7 g/kg/d to support their high activity level and their interest in gaining muscle mass.27–30 In a review on this topic, Coleman30 suggests a range of 1.2 to 1.6 g/d, with 1.2 g/d being the amount endurance athletes need during low- to moderate-intensity activity if energy and carbohydrate intakes are adequate, and 1.6 g/d being the amount that may be needed by elite endurance athletes. At the lower end of this range, 1.2 g/d should be enough for well-trained strength athletes such as bodybuilders. An exception is that individuals in the early stages of intensive resistance training may require a protein intake of up to 1.7 g/kg/d. Coleman30 suggests that a protein intake of up to 2 g/kg/d is unlikely to cause any adverse effects, but intake beyond this level may accelerate disease progression (eg, preexisting kidney disease), reduce glycogen levels, and be detrimental for optimal performance. Notably, as described in more detail in the section below, “Estimations of per capita protein intake,” the average American on a 2500-kcal diet currently consumes approximately 1.2 to 1.6 g of protein per kilogram. For highly active individuals, the higher energy intake required to support the energy output (eg, >4000 kcal/d) will almost certainly contain substantially more protein than 1.2 to 1.6 g/kg/d.
Protein intake, satiety, and weight control
Another outcome of interest with regard to protein intake is the potential to control appetite and satiety, along with the longer-term implications for weight control. With regard to appetite and satiety, it is possible that diets containing more than approximately 15% of energy intake from protein—the typical intake level in the United States31—could be useful. However, if the purpose of a higher proportional protein intake is to help curtail overall energy intake, the net increase in total protein intake could be minor. For example, 15% of calories from protein in 2000 kcal would be 75 g of protein, which would be identical to 20% of calories from protein in 1500 kcal, which could be the case for someone trying to achieve a daily deficit of 500 kcal for the purpose of weight loss or weight control. A 2004 review concluded that higher-protein diets are more satiating than lower-protein diets but also reported that the data on weight control for high- vs low-protein diets were less consistent.32 In a more recent study, Blatt et al33 conducted an experiment that involved covertly varying the protein content of a meal at 5 different levels, from 10% to 30% of energy, and found no impact on energy intake or ratings of satiety. This area of research warrants further study.
Summary
The RDA is currently 0.8 g/kg for the generally healthy adult population. Higher levels to support the growth of children and pregnant women range from 0.85 to 1.1 g/kg. For endurance and elite athletes, an even higher level of 1.2 to 1.6 g/kg may be appropriate and is also likely to be easily achieved simply from the greater caloric intake needed to support physical activity at a high level of intensity. Protein is widely available from all food sources, both animal and plant foods, and the amount and quality of protein from plant food sources is often underestimated or misunderstood. An ongoing area of interest with regard to protein intake is the potential impact on both appetite and satiety, which are likely influenced not only by the amount of protein but also by the specific food sources of protein as well as the other nutrients and food components found in those food sources.
ESTIMATIONS OF PER CAPITA PROTEIN INTAKE
Per capita consumption of protein, specifically animal food vs plant food protein, in the United States can be estimated in 2 ways, both of which have notable limitations. One is to use availability, ie, production adjusted for imports and exports, for which extensive data are provided by the US Department of Agriculture (USDA). An important difference between availability and consumption is the waste that occurs at many points in the food chain, from production to consumption. Adjustments for waste can be made, but the available data for waste along the many steps from production to consumption are limited. A second approach to estimating protein intake is to use national-level individual data on consumption. This is available from the National Health and Nutrition Examination Surveys (NHANES), which have been conducted annually since 1999. An important limitation here is that this data collection method relies on self-report. It has been well established that this method can result in substantial under-reporting, on average. Again, adjustments for under-reporting can be made, but these adjustments involve assumptions and estimates. Neither of the methods described above is able to provide a definitive level of per capita intake of protein in the United States, but an examination of the 2 complementary sources of data together provides what is likely a reasonable estimate.
Protein consumption estimated from USDA availability data, with adjustment for waste
Food availability data from the USDA provide estimates of per capita consumption of red meat, poultry, fish and seafood, dairy, eggs, grain, legumes and nuts that are based on domestic food production that moves through domestic marketing channels.34 All of the animal-based protein values are for raw, boneless meat. The dairy protein values include the contributions of such isolated proteins as whey or casein, which are used as a protein additive in some types of processed foods or are available in powdered form to be added by consumers to beverages or foods. The amount of protein available per capita for Americans is approximately 112 g/d, as reported by the sources presented in Table 334–37. Eighty-five percent of the protein in this estimate is derived from animal food sources, with only 3% of the total coming from fish and seafood.
Table 3.
Per capita protein intake in the United States, estimated as availability adjusted for loss
| Protein source | Per capita availability34 | Units | Protein produced (g/unit)35 | Protein produced (g/d) | Percent loss36 | Protein consumed, adjusted for loss (g/d) |
|---|---|---|---|---|---|---|
| Animal-based | ||||||
| Beefa,b | 54.5 lb | Pounds | 123 g/lb | 18.4 | 27 | 13.4 |
| Veala,c | 0.3 lb | Pounds | 165 g/lb | 0.14 | 27 | 0.10 |
| Porkd | 42.6 lb | Pounds | 128 g/lb | 14.9 | 27 | 10.9 |
| Chickene,f | 56.6 lb | Pounds | 144 g/lb | 22.3 | 22 | 17.4 |
| Turkeye,g | 12.6 lb | Pounds | 131 g/lb | 4.5 | 22 | 3.5 |
| Lambh | 0.6 lb | Pounds | 117 g/lb | 0.19 | 27 | 0.14 |
| Seafood and shellfishi37 | 14.4 lb | Pounds | 107 g/lb | 4.2 | 39 | 2.6 |
| Dairy productsj | 611.0 lb | Pounds | 16 g/lb | 26.8 | 31 | 18.4 |
| Eggsk | 246 eggs | Eggs | 6 g/large egg | 4 | 28 | 2.9 |
| Total, animal-based protein | 95.43 | 69.33 | ||||
| Plant-based | ||||||
| Grainsl | 174.7 lb | Pounds | 13 g/cup2 cups/lb | 12.4 | 30 | 8.7 |
| Beans, legumes, peasm | 6.7 lb | Pounds | 14 g/cup, cooked | 1.5 | 15.4 | 1.3 |
| Peanuts and tree nutsn | 10.9 lb | Pounds | 80 g/lb | 2.4 | 15 | 2.0 |
| Total, plant-based protein | 16.3 | 12.01 | ||||
| Total protein | 111.73 | 81.34 |
In Tables 5 and 6, values for veal and beef are combined because separate values for veal are not available.
Protein/unit based on cooked beef lean and fat; per capita availability based on boneless retail cut.
Protein/unit based on veal cutlet, lean and fat, cooked; per capita availability based on boneless retail cut.
Protein/unit based on broiled pork chop, lean and fat; per capita availability based on boneless retail cut.
In Tables 5 and 6, values for turkey and chicken are combined (and the category referred to as poultry) because separate values for turkey are not available.
Protein/unit based on roasted chicken breast; per capita availability based on boneless retail cut.
Protein/unit based on roasted dark and light meat; per capita availability based on boneless retail cut.
Protein/unit based on leg of lamb, lean and fat included; per capita availability based on boneless retail cut.
Protein/unit based on cod, baked or broiled; per capita availability based on boneless retail cut.
Protein/unit based on fluid milk; per capita availability based on all dairy products in milk equivalent units. Includes fluid milk, cream, butter, cheese, cottage cheese, frozen dairy products, evaporated and condensed milk, and dry dairy products.
Protein/unit based on a large egg.
Protein/unit based on wheat flour; per capita availability based on wheat, rye, rice, corn, oats, and barley.
Protein/unit based on cooked pinto beans; per capita availability based on dried beans, peas, and lentils; 1 pound dry beans = 6 cups cooked.
Protein/unit based on mixed nuts, dry roasted; per capita availability based on peanuts, almonds, hazelnuts, pecans, walnuts, macadamias, pistachios, and other miscellaneous tree nuts.
A second calculation to account for food waste can be applied to per capita food production availability estimates.36 US Department of Agriculture loss-adjusted food availability data accounts for loss at 3 levels: the primary level, which is from farm to retail, the retail level, and the consumer level. For meat, poultry, fish, and seafood, the primary loss from carcass weight to retail weight is taken into account before the data are presented in the food availability data sheets. Eggs and fresh vegetables and fruits have additional losses that include inedible portions that are removed, which are accounted for at the consumer level. When accounting for loss in these ways, Americans are estimated to consume approximately 81 g of protein per day, of which approximately 69 g/d (85%) is animal protein, as shown in Table 3.
Other estimates of food consumption come from the World Agricultural Supply and Demand Estimates (WASDE) data, which are based on the aggregate of US production and imports of agricultural products minus exports.38 Using just the WASDE values that are available for red meat, poultry, and eggs, protein availability per capita is 83 g/d. The WASDE data on total protein was not compared directly with the USDA food availability data sheets, as per capita values for seafood, beans (other than soybeans), nuts, and grains are not available through WASDE.
Protein consumption estimated from NHANES data, with adjustment for under-reporting
Using 1988–1991 NHANES III data from 7924 adults, Smit et al31 calculated age- and gender-specific estimates of protein intake. In their analysis, the authors systematically addressed sources of animal food protein vs plant food protein and concluded the average daily protein intake for adults was 80 g/d, with 69% from animal food protein. The energy intake values reported were 2591 ± 39 kcal for men and 1746 ± 18 kcal for women (mean ± SEM). Fulgoni39 analyzed protein intake data from NHANES 2003–2004. The analysis did not separate animal food protein from plant food protein. The report concluded daily protein intake was 90 g/d, but no energy intake data are provided, and so no estimates of under-reporting are possible.
The most recent dietary data from NHANES 2013–2014 estimates that Americans consume approximately 80 g of protein per day. For men, the average is 94 g of protein per day, and for women, 67 g of protein per day (Table 440). The values presented in the Table 4 are for the first day of 24-hour dietary recall data collected in person for 15 673 individuals by NHANES staff.41 In this analysis, the breakdown of animal food vs plant food protein was not available.
Table 4.
Protein consumption in the United States a
| Age group | Sex | Sample size | Mean energy (kcal)± SD | Mean protein (g) ± SD |
|---|---|---|---|---|
| 2–19 y | M and F | 3019 | 1885±1.1 | 69.8±1.16 |
| ≥ 20 y | M and F | 5047 | 2141±18.7 | 83.6±0.73 |
| ≥ 2 y (total) | M and F | 8066 | 2079±17.2 | 80.3±0.74 |
| 2–19 y | M | 1520 | 2101±26.4 | 79.9±1.96 |
| ≥ 20 y | M | 2414 | 2477±26.1 | 98.3±1.25 |
| ≥ 2 y (total) | M | 3934 | 2382±21.0 | 93.6±1.18 |
| 2–19 y | F | 1499 | 1657±27.7 | 59.2±1.13 |
| ≥ 20 y | F | 2633 | 1825±18.1 | 69.8±0.79 |
| ≥ 2 y (total) | F | 4132 | 1786±16.4 | 67.4±0.74 |
Data from the National Health and Nutrition Examination Survey (NHANES) 2013–2014.40
Estimation of under-reporting.
The 2005 report on DRIs for energy and macronutrients provides an estimated average total energy expenditure for adults by gender and activity level, as determined by doubly labeled water, the gold standard for measurement of energy expenditure.18 Data are presented separately in this analysis for those with a body mass index of 18.5 kg/m2, 25 kg/m2, and greater than 25 kg/m2. Applying current estimates that two-thirds of US adults are overweight or obese, these data suggest that the average level of total energy expenditure is approximately 3050 kcal/d for men and 2350 kcal/d for women, or approximately 2700 kcal/d for adults. Under weight-stable conditions, total energy intake should match total energy expenditure, while for individuals gaining weight, energy intake would be even higher. Assuming weight stability among adults aged 20 years and over, the values presented in Table 4 represent a likely under-reporting of approximately 28% for women and approximately 19% for men. For the NHANES 1988–1991 data presented by Smit et al,31 the numbers would be very similar: under-reporting of approximately 35% for women and 18% for men (no such estimates can be made for the work by Fulgoni39 because energy intake was not reported). Similar estimates of under-reporting of dietary intake have been observed and reported by other investigators.42–44
If NHANES assessments indicate an average protein intake of 80 g/d for adults, and if the profile of nutrients in the calories under-reported were identical to those that were reported, then addressing under-reporting of 25% would bring that total to 100 g/d. Another approach to addressing this is to consider using 15% to 16% of energy intake from protein, which has been consistently reported from NHANES analyses,31,39 and apply that to an average caloric intake of approximately 2700 kcal as determined by doubly labeled water studies as noted above, which equals approximately 100 to 110 g of protein per day. A third approach is to consider studies that have used 24-hour urinary nitrogen excretion under weight-stable conditions as a biomarker of protein intake. Several studies have consistently reported that the amount of protein intake assessed by 24-hour recalls is, on average, 80% to 90% of the amount determined by the more objective assessment by urinary nitrogen excretion.45–47 Therefore, average protein intake for American adults, as determined by assessment of dietary intake in NHANES, is greater than 80-90 g/d and is likely closer to 100 g/d or more.
Joint report of the Food and Agriculture Organization and the WHO
Another perspective on estimating protein intake comes from a 2009 Food and Agriculture Organization (FAO)/WHO report titled Livestock in the Balance.7 This document presents a global perspective from countries all over the world, including both developing and developed economies. In chapter 2, “Change in the Livestock Sector,” the United States was ranked highest in meat consumption from among more than 150 countries for which data were available, consuming approximately 126 kg per capita per year (277 lbs per capita per year). Given the proportion of protein in most types of meat, approximately 35% to 40% of calories,48 this would be approximately 130 g of protein per capita per day from meat, without taking into account the contribution of plant food protein. As noted in the Introduction, intake in North America and Europe is approximately fourfold higher than in Central and West Asia and North Africa.7,49
Summary of per capita protein intake estimations
As presented here, several different sources of national or global data can be used to estimate daily per capita protein consumption in the United States. The 3 approaches used here involve starting with USDA or WASDE protein availability data and factoring in waste; starting with NHANES protein intake data and factoring in under-reporting; or taking into consideration FAO/WHO data on US consumption of meat. From these different perspectives, a reasonable estimate of per capita protein intake in US adults is approximately 90 to 100 g/d, of which approximately 70% to 85% is animal food protein. From a global perspective, the United States consumes more protein and more animal-based protein than most, if not all, countries in the world.
ENVIRONMENTAL FOOTPRINT OF PROTEIN INTAKE IN THE UNITED STATES
As already described, the current mix of protein sources in the US diet is composed mostly of animal-based foods. Most foods from terrestrial animals are produced by converting plants eaten by animals into edible meat, milk, and eggs. Food from aquatic animals (eg, fish and shellfish) is produced by converting either plants or other fish into edible meat. Owing to losses in energy across trophic levels, the conversion of plants or fish into animal proteins is not completely efficient and results in the production of a smaller amount of food in terms of weight, energy (kilocalories), and protein. As such, producing a unit of animal food protein often results in greater environmental impacts than producing an equivalent unit of plant food protein, so long as the protein content of the plant product is not negligible.
The efficiency of converting feed is a major factor influencing the environmental footprints of different protein sources, though production practices (crop management, feeding, level of confinement) cause wide variations in impacts within even a single protein source. Conversion efficiencies differ by species and production method as well as by whether the animal food produced is muscle, milk, or eggs. It can take up to 49 times as much plant food material, by weight, to produce 1 unit of consumable animal food protein by weight. Generally, fish and shellfish are much more efficient converters of feed,50 although, as noted previously, fish and seafood intake in the United States is estimated to be only approximately 3% of total protein intake. The feed conversion ratio for converting plants into edible meat to produce some traditional animal proteins foods is as follows: beef, between 24:1 and 49:151,52; pork, between 3:1 and 9:153–55; chicken and turkey, approximately 2:1 to 5.4:155,56; dairy, approximately 2.4:155; eggs, approximately 2.4:155; salmon, approximately 1.3:150; and marine fish, approximately 1.9:1.50
The environmental impact of different animal-based foods is largely related to production practices and the resulting conversion efficiency. Animals raised on pasture or in the wild (eg, marine fish) will have substantially different impacts than animals raised in partial or full confinement at high densities, which rely heavily on feed inputs. For animal foods relying on feed, much of the environmental impact associated with feed production derives from the production of the crops (or fish) used to produce the feed.57,58 However, animal maintenance and digestion results in additional energy, water, and land inputs and carbon emissions. These impacts vary substantially by species and are correlated with conversion efficiencies.50,56
As of 2012, cropland occupied 17% of the total land area (390 million acres) of the United States. The most widely planted crops in the United States are corn and soybeans, which together occupy 40% of the total cropland in the United States, or about 7% of all land. The majority of US crop production is used to feed animals. Between 2000 and 2010, 67% of the crop calories and 80% of the plant proteins produced in the United States were allocated to animal feed, either domestically or abroad.59 An even larger amount of land is used to raise livestock directly, with permanent pastures occupying 18% of all land (415 million acres) in the United States.60
By comparison, acres planted with specialty crops, which include all fruits, vegetables, and nuts, totaled only 14 million acres in 2012,61 which is 8% of the acreage planted with corn and soybeans. Notably, the acreage planted with specialty crops is insufficient to produce enough fruits, vegetables, nuts, and seeds to provide enough of these foods for every person in the United States to meet current US dietary guidelines. Acreage planted in specialty crops would need to double to meet this need without imports.62
Carbon footprint of protein sources
The amount of greenhouse gases emitted to produce 1 pound of edible food (ie, the carbon footprint) differs substantially between animal foods and plant foods and is estimated through a life cycle assessment, which accounts for all of the greenhouse gases emitted to produce a food source, including those associated with feed production and transport and the inputs used to produce the feed. This footprint is commonly represented as the carbon dioxide equivalent (CO2eq) weight of all greenhouse gases emitted, which normalizes different volumes of emissions according to their global warming potential.
Data from Heller and Keoleian,63 which provide a comprehensive set of greenhouse gas emission estimates for protein sources on the basis of the largest meta-analysis of prior work compared with alternative options, were utilized in the current review (Figure 2)63. Sources from around the world were included in that study, but most of the estimates for animal foods derive from US studies. These estimates, when compared with those from several other meta-analyses that included a smaller subset of products, show that the 2014 estimates of greenhouse gas emissions reported by Heller and Keoleian63 are generally similar to those reported in these other studies, except for the data of Tillman and Clark1 who reported substantially lower estimates for pork, grains, and legumes (see Table S2 in the Supporting Information online). Because the greenhouse gas emission estimates for plant proteins reported by Heller and Keoleian63 are higher than those from alternative studies, they may be considered a conservative estimate of the potential carbon savings of moving from animal source proteins to plant source proteins.
Figure 2.

Carbon footprint of protein sources.63 Beef and lamb have by far the highest carbon footprint per unit of protein produced, followed by dairy, eggs, pork, and seafood. Plant proteins and poultry have the lowest carbon food prints per unit of protein. Detailed notes on the precise definitions of each category for each study and the exact studies included for comparison are listed in Table S2 in the Supporting Information online (Comparative Study 2 had values only for pork, poultry, and seafood). Abbreviation: KG CO2 eq, kilograms of carbon dioxide equivalents.
Across all studies, beef and lamb have by far the highest carbon footprint per unit of protein produced, followed by dairy, eggs, pork, and seafood (eg, long-lined wild cod or hake). Plant food proteins and poultry have the lowest carbon footprints per unit of protein produced. The carbon emissions associated with a gram of protein from beef are at least 7.5 times higher than those associated with a gram of protein from plant sources. The emissions associated with dairy and eggs are 2 to 3 times higher.
Water footprint of protein sources
The blue and green water footprints of the terrestrial protein food sources, as estimated by Mekonnen and Hoekstra (2012)52 and Mekonnen and Hoekstra (2010),64 are the most widely used data sets for determining the water footprints of food products. The blue water footprint assesses the amount of surface and groundwater required to make a product, while the green water footprint assesses rainwater usage. The blue and green water footprint estimates for livestock include water consumed directly, as well as water consumed indirectly via feed inputs. The blue water footprint associated with food production (ie, water consumed via irrigation) is often included in environmental assessments of food production and other human activities because it is actively managed by societies and has clearer tradeoffs with other potential uses. However, the green water footprint of food is also important to consider because it can reveal high tradeoffs associated with the yields of different food sources per unit of land and opportunities to better utilize water resources to meet food production goals.65
Most livestock production practices in the United States can be characterized as industrial; that is, they rely heavily on animal confinement and the use of feed inputs to maximize productivity. However, some livestock is exclusively grazed. The water footprints associated with meat production tend to decline with a move from grazed practices to fully industrial production because the conversion efficiencies increase.52 Unlike the greenhouse gas estimates provided by the meta-analysis above,63 the estimates provided by Mekonnen and Hoekstra52 are specific to animal products produced in the United States and are weighted by the amount of production associated with each practice. The blue and green water footprints from this study (see Table S3 in the Supporting Information online) are considered here, but the gray water estimates (water pollution associated with a product) are excluded because the data available include only leaching and runoff from nitrogen fertilizers and not pollution from animal excrement. As such they would underestimate the gray water impacts of animal source foods relative to plant source foods.
Plant food proteins have a higher water footprint than almost all animal proteins (Figure 3, A and B59,61). However, the green water footprint of ruminants (beef and lamb) is even higher than that of plant proteins because of the dependence of these animals on large pasture or rangeland areas. Poultry and eggs have a particularly low overall water footprint.
Figure 3.

Blue water footprint (A) and green water footprint (B) of protein sources.59,61 Plant proteins have a higher water footprint than almost all animal proteins. The green water footprint of beef and lamb is even higher than plant proteins. Poultry and eggs have a particularly low overall water footprint. Detailed notes on the precise definitions of each category are listed in Table S3 in the Supporting Information online.
Carbon and water footprints of current US protein intake
We have used the data presented up to this point to provide an estimate of the total annual greenhouse gas footprint (expressed in CO2eq) and water footprint of the foods that contribute to dietary protein consumption in the US. The starting values used were the USDA availability data in Table 3. Those values were increased by approximately 10% to match the conclusion in summary section on per capita protein intake estimations that Americans consume approximately 90 grams of protein/day (the low end of the 90–100 g/d range). Those daily values of grams of protein of each food type consumed per day were multiplied by 365 days/year, then multiplied by the greenhouse gas and water footprint per gram of protein of each food type (Table 5)52,62,63 and finally were multiplied by 308,827,000 people in the US from the most recent census data. The current consumption of animal food and plant food protein in the U.S. is associated with more than 360 billion kilograms (360 million metric tons) of CO2eq greenhouse gas emissions and more than 65 trillion gallons of water per year, or ≈1.2 metric tons CO2eq, and greater than 210,000 gallons water per capita/year.
Table 5.
Total annual carbon and water footprints of the animal and plant foods that contribute to dietary protein consumption in the United States 52 , 62 , 63
| Protein source | Greenhouse gases footprint (billion kg of CO2eq) | Water footprint, blue and green water (billion gallons of water) |
|---|---|---|
| Beef | 164.2 | 24 318 |
| Pork | 33.1 | 6655 |
| Poultry | 41.5 | 4576 |
| Lamb | 1.6 | 222 |
| Seafood | 5.1 | – |
| Dairy | 87.2 | 13 386 |
| Eggs | 12.1 | 1329 |
| Total, animal-based protein | 344.7 | 50 485 |
| Grains | 11.0 | 10 803 |
| Peanut and tree nuts | 2.4 | 1939 |
| Beans, legumes, peas | 2.0 | 2138 |
| Total, plant-based protein | 15.4 | 14 880 |
| Total, all protein sources | 360.2 | 65 366 |
Abbreviation: CO2eq, carbon dioxide equivalents.
Consumption of protein from cattle products accounts for by far the largest amount of carbon emissions and water usage, roughly 70% of the total annual greenhouse gas footprint and 58% of the water footprint of U.S. protein consumption. In contrast, all plant proteins currently contribute to just 4% of the total annual carbon footprint and 23% of the water footprint.
REDUCTION IN CARBON AND WATER IMPACTS OF US FOOD CONSUMPTION FROM CHANGES IN PROTEIN INTAKE
Three scenarios of potential shifts in protein intake that involve either reducing overall protein intake or shifting toward more plant protein and less animal protein, or both
Here, the potential environmental impact of 3 different shifts in protein intake in the US is considered, beginning with a general description of what those shifts would look like in terms of actual foods. This description is facilitated by a series of 4 food photographs (Figure 4). All 4 photographs include the same 6 items: 3 animal food protein sources (chicken, yogurt, and eggs) and 3 plant food protein sources (bread, nuts, and kidney beans). There are 2 amounts of total protein: approximately 90 g (see section above, Summary of Per Capita Protein Intake Estimations) and a 25% lower amount, approximately 67.5 g. The caloric value of the 6 foods on the plate ranges from approximately 600 kcal to approximately 1100 kcal (Figure 4). The intent of presenting each plate of food is to illustrate a plausible and familiar set of food types and quantities that would provide all approximately 90 g or all approximately 67.5 g for the entire day (ie, the set of foods is not intended to represent a single meal, nor is it intended to represent a full day of meals and snacks). Therefore, the photos help to demonstrate one possible approach for obtaining either approximately 90 g or approximately 67.5 g of protein from just 6 common animal and plant foods while contributing only 600 to 1100 kcal for the day. However, it should be noted that, for an individual eating a 2000-kcal, a 2500-kcal, or a 3000-kcal diet, the other foods consumed that day that are not represented on these plates would be providing additional calories and additional protein (as described previously), and so total protein intakes for the entire day would necessarily be higher than the numbers presented in all 4 food photos.
Figure 4.

A day’s worth of protein on 1 plate. Each plate represents a different option for consuming 90 g or 67.5 g of protein for the entire day; ie, breakfast, lunch, dinner, and snacks combined. For ease of comparison, the same 3 animal foods (chicken, eggs, yogurt) and the same 3 plant foods (bread, peanuts, kidney beans) are used. Calories for each plate range from ≈ 600 kcal to ≈ 1000 kcal, suggesting these would represent 25% to 50% of total kilocalories for a 2000-kcal diet (and a smaller percentage for higher kilocalorie intake). Only protein-rich foods are pictured here (ie, no vegetables or fruits). Notably, as described previously, since all whole foods contain protein, the additional foods consumed would provide additional protein to a complete diet of ≥ 2000 kcal.
For the shifts that involve an increase in plant protein intake, different strategies were used for grains, nuts, and beans. From Table 3 it can be seen that approximately three-quarters of the plant protein in the food items listed derives from grains, with only minor amounts coming from nuts and beans. For the examples in Figure 4, the increases in plant protein were achieved by increasing only the nuts and beans (given how high grain intake is already, the aim was to not increase this even further in the examples). Moreover, given the high caloric intake of nuts, the increase in nuts was limited to a maximum of 1 oz per day; the additional plant protein increases in these examples were achieved with increased amounts of beans. Therefore, when shifting toward more plant protein intake in the examples below, the amount of bread does not increase any higher than that shown the current scenario, the amount of nuts does not increase any higher than 1 oz, and increases in beans account for the remainder of the changes.
The current scenario, in food photo A (Figure 4), reflects approximately 90 g of total protein intake and an 85:15 ratio of animal protein to plant protein.
In shift scenario 1, in food photo B (Figure 4), total protein intake is kept at current levels while shifting 25% of the total protein from animal to plant, such that the distribution of animal protein to plant protein in an individual’s diet changes from 85:15 to 60:40.
In shift scenario 2, in food photo C (Figure 4), current protein intake levels are cut back by 25% while keeping the proportions of proteins from animal and plant foods the same as it is now, ie, 85:15.
In shift scenario 3, in food photo D (Figure 4), shift scenarios 1 and 2 are combined. Total protein intake is cut back by 25%, and at that lower total amount of protein, the distribution is also shifted from an 85:15 distribution to a 60:40 distribution of animal protein to plant protein.
Shift scenario 1: shift from a 85:15 ratio to a 60:40 ratio of animal protein to plant protein, while keeping total protein intake constant.
The case was made earlier that the quality of protein (ie, distribution of amino acids) is higher in plant foods than many people seem to believe. Vegetarian and even vegan diets typically contain adequate amounts of protein, including adequate amounts of all 20 amino acids and, specifically, all of the essential amino acids (Figure 1). Therefore, this shift would not substantively impact the adequacy of protein intake in Americans, given that typical total protein intake so greatly exceeds the EAR and the RDA. In addition, while this proposal shifts in the direction of fewer animal foods and more plant foods, the majority of protein intake would still be derived from animal foods (ie, this proposal does not suggest that everyone to shift to a vegan or vegetarian diet). For this example, the shift to greater plant protein intake was modeled by leaving grain intake constant, increasing average daily nut/seed intake by approximately 3-fold, from approximately 0.3 oz (≈50 kcal) to 1 oz per day (≈150 kcal), and increasing average daily legume intake by approximately 14-fold, from 0.6 oz (≈20 kcal) to 8.6 oz per day (≈300 kcal).
As illustrated in the example provided, this shift would have implications for the sources and amounts of calories and carbohydrate as well as for the sources and amounts of protein. The calories associated with obtaining approximately 90 g of protein from chicken, yogurt, eggs, wheat bread, kidney beans, and nuts, with an 85:15 ratio of animal protein to plant protein, would be approximately 800 kcal (Figure 4, food photo A). With the same amount of total protein and the same food sources of protein, but a 60:40 ratio of animal protein to plant protein (ie, less chicken, yogurt, and egg, more nuts and kidney bean), the calories would be approximately 200 kcal higher and mostly from beans (Figure 4, food photo B). The extra calories from beans would be primarily carbohydrate, but these would be complex carbohydrates and accompanied by fiber. If this were to be an overall isocaloric shift in diet, other dietary components, ie, non-protein-rich foods, would need to be decreased. This shift may not be optimal.
Shift scenario 2: decrease all main sources of protein intake from both animals and plants, while keeping the 85:15 ratio of animal protein to plant protein constant.
As noted in food photo C (Figure 4), if both the animal and plant protein intake from the food sources in food photo A (Figure 4) were decreased by 25%, kilocalorie intake from this subset of protein-rich foods would also decrease proportionally, by 25%. The net decrease would be approximately 200 kcal/d. Given the current rate of overweight and obesity in the United States, widespread adoption of a hypocaloric diet could lead to substantial benefits from weight loss. However, it is not realistic to think that the 200 kcal would not be compensated in some other way. If this were to be an isocaloric shift in diet, other dietary components, ie, non-protein-rich sources, would need to be increased. Making healthy shifts would be advised, but the specifics of those shifts are beyond the scope of this analysis. Again, this shift may not be optimal; however, an optimal shift might entail combining shift scenarios 1 and 2.
Shift scenario 3: decrease the total amount of protein consumed by 25%, and shift simultaneously from an 85:15 ratio to a 60:40 ratio of animal protein to plant protein.
As illustrated in food photo D (Figure 4), a 25% decrease in total protein intake to approximately 67.5 g/d, with a simultaneous shift from an 85:15 to a 60:40 ratio of animal protein to plant protein, would result in the smallest portions of chicken, yogurt, and eggs. This would also result in a relative increase in plant sources of protein, but not as much of an increase as illustrated in shift scenario 1. As in shift scenario 1, for this scenario, the amount of bread was not increased; only the amounts of nuts and beans were increased: a 3-fold increase in peanuts, from approximately 0.3 oz (≈50 kcal) to 1 oz (≈150 kcal) per day, and an approximately 8-fold increase in beans, from approximately 0.6 oz (≈20 kcal) to approximately 4.6 oz (≈160 kcal) per day. The net difference in overall caloric intake across all categories of animal and plant protein-rich foods for this type of shift would be negligible. The proportions of calories from macronutrients in these protein-rich foods would shift from two-thirds animal-derived and one-third plant-derived to one-third animal-derived and two-thirds plant-derived, ie, less protein and more carbohydrate, with the carbohydrate increase being primarily from nutrient-dense and fiber-rich legumes/beans. This scenario is proposed as the best choice of the 3 options presented to optimize the intersection of human health and the health of the environment.
Impacts of reduced protein intake
The environmental benefits of reducing protein intake and/or shifting the mix of protein consumed to include a larger share of plant-based protein are significant, particularly in terms of carbon emissions. Under shift scenario 3, US consumption of protein sources would result in 40% fewer CO2eq emissions and 10% less blue and green water, representing a savings of 129 billion kilograms of CO2eq and 3.1 trillion gallons of water relative to current consumption.
Under any scenario of reduced consumption of animal protein, CO2eq emissions would be reduced by more than 20%. Shift scenario 2 (a reduction in protein consumption by 25% without allocating more consumption toward plant sources) results in the largest reduction in water usage: approximately 25% less than current consumption patterns. These water savings are greater than those of shift scenario 3, owing to the relatively high water footprint of plant protein sources vs most animal sources (except for cattle products). However, shift scenario 2 would result in 25% higher CO2eq emissions than shift scenario 3, highlighting a tradeoff between climate mitigation and water conservation. Shifting toward plant protein consumption without reducing overall protein consumption (shift scenario 1) would still reduce CO2eq emissions by 20% but would also increase water consumption by 24% (Figure 5, A and B).
Figure 5.
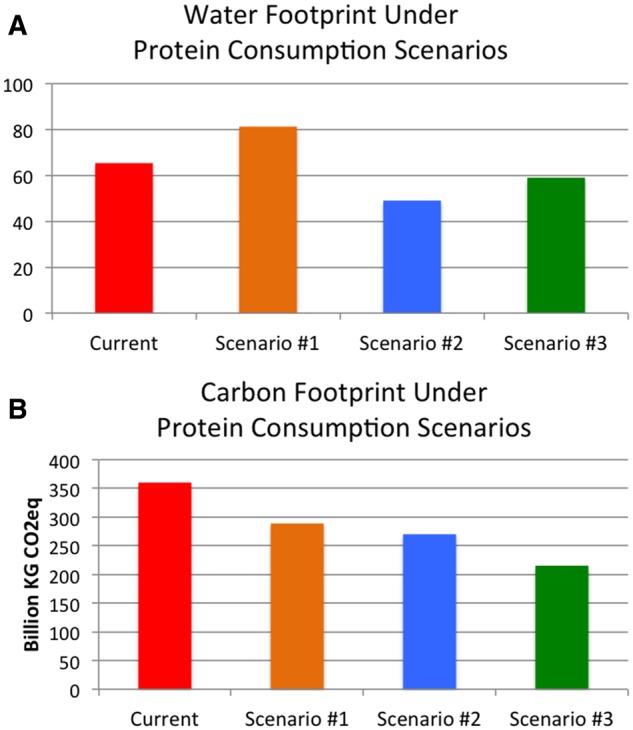
Calculations for carbon footprint (A) and water footprint (B) under different protein consumption scenarios. Abbreviation: KG CO2 eq, kilograms of carbon dioxide equivalents.
HEALTH IMPLICATIONS OF SHIFTING TO A MORE PLANT-BASED DIET
The above-described proposed shifts toward greater consumption of beans and nuts, with accompanying decreases in intakes of animal-based foods, is well aligned with the promotion of human health. As described by Merrigan et al,14 the Dietary Guidelines for Americans, which have been updated every 5 years since their inception in 1980, “…have consistently recommended a diet higher in plant-based foods and lower in animal-based foods.” Most recently, the 2015 Dietary Guidelines Advisory Committee stated in their Executive Summary that “…a diet higher in plant-based foods, such as vegetables, fruits, whole grains, legumes, nuts, and seeds, and lower in calories and animal-based foods is more health promoting and is associated with less environmental impact than is the current U.S. diet.”17 The data supporting this statement came from 15 studies identified by the 2015 Dietary Guidelines Advisory Committee.
In 2016, Nelson et al66 followed up with a systematic review that identified 23 total studies—the 15 above and 8 additional studies published after the report by the 2015 Dietary Guidelines Advisory Committee had been completed—that confirmed and strengthened the conclusion linking proposed changes in the US diet to the promotion of human health and environmental sustainability. The health outcomes noted include the major nutrition-related chronic noncommunicable diseases—cardiovascular disease, coronary artery disease, stroke, hypertension, type 2 diabetes, obesity, and cancer—as well as all-cause total mortality.67–71 Pan et al71 addressed the shift from animal protein to plant protein most directly in a prospective study that included 37 698 men from the Health Professionals Follow-up Study (1986–2008) and 83 644 women from the Nurses’ Health Study (1980–2008). They modeled the replacement of red meat (unprocessed, processed, and total) with nuts, legumes, and whole grains, and in each case the plant-based alternative was associated with a statistically significant reduction in total mortality.
As would be expected, these studies were observational and not interventional, ie, a mixture of cross-sectional and prospective cohorts. Therefore, the results are findings of associations and not causation. Notably, this topic does not lend itself to long-term, large-scale intervention trials. However, the level of causal inference is strengthened by the consistency of the findings, the mechanistic plausibility, and the reproducibility of the findings in the United States, Sweden, Japan, and Europe.66,67
DISCUSSION
The US RDA for protein has remained unchanged for decades.18 The basis for the recommendation, and the amount recommended, have come under debate, with some suggestions to increase the recommendation, particularly for certain subsets of the population.72–76 It is suggested here that discussions of determining an optimal level of total protein intake should be expanded to include not only different population subsets but also recognition of the current levels of intake, the health implications of animal vs plant food sources of protein, and the impact of growing and raising those food sources of protein on environmental sustainability and, thus, the ability to continue to produce adequate food and protein for generations to come.
Dietary and nutrition advice disseminated over the past several decades has focused on the macronutrient categories of fats and carbohydrates, often aiming to educate the public about the health risks and benefits from consuming too much of specific types of fats and carbohydrates. There appears to have been less effort to inform the public about the amount and sources of protein necessary to support good health or to provide advice about moderate protein intake. There also appears to be confusion about the amount and quality of protein that can be obtained from plant-food sources. Amidst a lack of understanding and confusion about protein requirements and intake, a growing body of scientific evidence has linked the agricultural practices of producing food sources of dietary protein to environmental sustainability, particularly with regard to greenhouse gas emissions and water usage. This review has utilized national dietary recommendations and published databases to link human protein requirements and intakes to estimated impacts on environmental sustainability in the United States. There is ample room in the US diet to consume less total protein and to shift toward an intake of more plant-based and less animal-based protein while still meeting and surpassing protein requirements, which, when scaled to the more than 300 million Americans, would significantly decrease greenhouse gases and, to a lesser extent, water usage. This shift would also be consistent with improving human health, as described earlier.
The findings presented in this review build on what are generally consistent findings from a growing body of research that addresses similar topics. The most common finding reported is that animal-based diets have higher greenhouse gas emissions than plant-based diets. Tilman and Clark1 address this by comparing the projected impact of 4 different diet types on greenhouse gas emissions. They conclude that greenhouse gas emissions are lower and sustainability is higher with vegetarian, pescatarian, or Mediterranean diets than with the current US diet, which is higher in meat and animal food intake than the other patterns. Harwatt et al77 report that substituting beans for beef could achieve 46% to 74% of the reductions needed to meet the US 2020 greenhouse gas target. Eshel and Martin78 report that shifting from the current US diet to a plant-based diet would reduce US greenhouse gas emissions by 6%. Other environmental sustainability benefits projected to result from shifting away from an animal-based diet toward a more plant-based diet include reductions in water usage, energy inputs, land use, and extinctions.4,79,80
A counter position is presented by Tom et al81 in an analysis that models changes in the US diet that involve the following: (1) decreasing caloric intake so as to achieve a healthy weight, (2) switching from the mix of foods of a current US diet to a mix more consistent with US dietary guidelines, or (3) doing both simultaneously. The authors conclude that, in the third scenario, energy use, blue water footprint, and greenhouse gas emissions are all increased relative to current dietary practices. Some of the assumptions made in this analysis with regard to dietary shifts to match US dietary guidelines include reducing meat consumption by approximately 100 kcal/d, increasing vegetable and fruit intake by approximately 300 kcal/d, and increasing dairy intake by approximately 300 kcal/d. The rationale for the magnitude of the proposed increase in dairy intake is unclear, debatable in its accuracy, and likely problematic in these projections. Moreover, the proposed increase contributes substantially to the higher negative environmental impacts reported by this study. However, the proposed increase in vegetable and fruit intake is realistic and would also help explain the overall increase in blue water usage in this analysis, since producing vegetables and fruits requires substantial water inputs. The corresponding analysis in water usage in the current review does not take changes in vegetable or fruit intake into account, which was beyond the scope of the research question, since that question was focused on protein-rich foods, with the primary protein sources of plant foods being grains, nuts, and beans. Even so, the environmental sustainability impacts projected for shifts to greater intakes of plant-based protein are much larger, in terms of reductions of greenhouse gases, than water usage.
The objective of this review was to address the intersection of human and environmental health and the importance of environmentally sustainable, healthy food choices for generations to come. As described above, the published literature is consistent with regard to the human health benefits attributable to shifting toward a more plant-based diet in the United States.14,17,67–71 Collectively, these studies conclude that a diet higher in legumes, nuts, seeds, whole grains, vegetables, and fruits and lower in animal-based foods—especially red meat—is consistent with aligning human health and environmental sustainability.66 Tilman and Clark1 also conclude that the more plant-based Mediterranean, pescatarian, and vegetarian diets are associated with lower rates of type II diabetes, cancer, coronary mortality, and total mortality. This review adds to the literature by focusing more specifically on protein, ie, animal-derived vs plant-derived protein. Both Pan et al71 and Song et al16 have reported that replacing animal protein with plant protein was associated with lower all-cause mortality.
CONCLUSION
The quality of plant-based protein is higher than many Americans realize. Similarly, the amount of total protein most Americans eat is well beyond their daily requirement. Unlike dietary fat or carbohydrate, which both have storage depots in the human body, there is no mechanism for storing dietary protein consumed in excess of functional need, and therefore daily excesses of protein intake are converted to carbohydrate and fat. Reductions in the consumption of animal food protein and shifts toward increases in the consumption of plant food protein are consistent with improvements in human health, particularly in the areas of prevention and treatment of chronic, noncommunicable, diseases. Reducing total protein consumption by 25%, while also reducing the proportion of animal food protein consumed, would contribute to substantial climate change mitigation equivalent to approximately 8% of the greenhouse gas emissions reductions pledged under the Paris Agreement.82,83 The associated water savings under the same scenario is equal to 4% of all the freshwater used annually in the United States or 14% of the freshwater used for irrigation and livestock.84 Reductions in animal food protein intake would have the added benefit of freeing up farmland now dedicated to corn and soybean production for livestock feed to produce more vegetables, fruits, nuts, and seeds. While the spillover effects of such large reductions in land area devoted to feed crops remain unknown, reducing greenhouse gas emissions associated with food consumption may be a comparatively low-cost mechanism of mitigating climate change and improving human health in the United States. Guidelines for optimal protein intake in the United States should consider human health, the availability of food sources of protein, and the effects of raising and growing those protein food sources on environmental sustainability. It should be less than the total protein currently consumed in the United States and should involve a shift toward consumption of a greater proportion of plant protein.
Supplementary Material
Acknowledgments
Author contributions. C.D.G. and A.S.W. initiated the review. C.D.G., A.S.W., J.C.H., R.D.G., and L.C.O. all wrote the manuscript collaboratively, contributed to the analyses, and reviewed and edited drafts.
Funding/support. J.C.H. is the recipient of an NIH/NHLBI (National Institutes of Health/National Heart, Lung, and Blood Institute) Postdoctoral Fellowship (no. T32 HL007034-41). L.C.O. is the recipient of an NIH/IRACDA (National Institutes of Health/Institutional Research and Academic Career Development Award) Postdoctoral Fellowship (no. 1 K12 GM088033).
Declaration of interest. The authors have no relevant interests to declare.
Supporting Information
The following Supporting Information is available through the online version of this article at the publisher’s website.
Table S1 Amino acid content in 35 foods standardized for 100 kcal, with corresponding weight, serving sizes, and protein per 100 kcal
Table S2 Greenhouse gases emitted per gram of protein—comparing data sources
Table S3 Water usage per gram of protein—comparing data sources
References
- 1. Tilman D, Clark M.. Global diets link environmental sustainability and human health. Nature. 2014;515:518–522. [DOI] [PubMed] [Google Scholar]
- 2. Clark M, Tilman D.. Comparative analysis of environmental impacts of agricultural production systems, agricultural input efficiency, and food choice. Environ Res Lett. 2017;12:064016. [Google Scholar]
- 3. Jacobson MF, staff of the Center for Science in the Public Interest. Better soil. In: Jacobson MF, staff of the Center for Science in the Public Interest, eds. Six Arguments for a Greener Diet: How a More Plant-Based Diet Could Save Your Health and the Environment Washington, DC: Center for Science in the Public Interest; 2006:73–85.
- 4. Tilman D, Fargione J, Wolff B, et al. Forecasting agriculturally driven global environmental change. Science. 2001;292:281–284. [DOI] [PubMed] [Google Scholar]
- 5. Vanham D, Mekonnen MM, Hoekstra AY.. The water footprint of the EU for different diets. Ecol Indic. 2013;32:1–8. [Google Scholar]
- 6. Mekonnen MM, Hoekstra AY.. A global and high-resolution assessment of the green, blue and grey water footprint of wheat. Hydrol Earth Syst Sci. 2010;14:1259–1276. [Google Scholar]
- 7. Food and Agriculture Organization of the United Nations. The State of Food and Agriculture. Livestock in the Balance. Rome, Italy: Food and Agricultural Organization of the United Nations; 2009:180. [Google Scholar]
- 8. Food and Agriculture Organization of the United Nations. Livestock's Long Shadow. Environmental Issues and Options. Rome, Italy: Food and Agriculture Organization of the United Nations; 2006. [Google Scholar]
- 9. Goodland R, Anhang J.. Livestock and climate change. World Watch Magazine. 2009;22:10–19. [Google Scholar]
- 10. Eshel G, Shepon A, Shaket T, et al. A model for ‘sustainable’ US beef production. Nat Ecol Evol. 2018;2:81–85. [DOI] [PubMed] [Google Scholar]
- 11. Organisation for Economic Co-operation and Development/Food and Agriculture Organization of the United Nations (OECD/FAO). Agricultural Outlook 2018–2027. Rome, Italy: Food and Agriculture Organization of the United Nations; 2018. [Google Scholar]
- 12. Kearney J. Food consumption trends and drivers. Philos Trans R Soc Lond B Biol Sci. 2010;365:2793–2807. [DOI] [PMC free article] [PubMed] [Google Scholar]
- 13. Menus of Change Advisory Council, the Culinary Institute of America, and the Harvard T.H. Chan School of Public Health. Menus of Change 2017 Annual Report: The Business of Healthy, Sustainable, Delicious Food Choices Boston, MA: Harvard T.H. Chan School of Public Health; 2017.
- 14. Merrigan K, Griffin T, Wilde P, et al. Designing a sustainable diet. Science. 2015;350:165–166. [DOI] [PubMed] [Google Scholar]
- 15. Wellesley L, Happer C, Froggatt A.. Changing Climate, Changing Diets: Pathways to Lower Meat Consumption. London, England: Chatham House, The Royal Institute of International Affairs; 2015:76. [Google Scholar]
- 16. Song M, Fung TT, Hu FB, et al. Association of animal and plant protein intake with all-cause and cause-specific mortality. JAMA Intern Med. 2016;176:1453–1463. [DOI] [PMC free article] [PubMed] [Google Scholar]
- 17. Dietary Guidelines Advisory Committee. Scientific Report of the 2015 Dietary Guidelines Advisory Committee: Advisory Report to the Secretary of Health and Human Services and the Secretary of Agriculture. Washington, DC: US Dept of Agriculture, Agricultural Research Service; 2015. [Google Scholar]
- 18. Institute of Medicine; Food and Nutrition Board; Standing Committee on the Scientific Evaluation of Dietary Reference Intakes; et al. Dietary Reference Intakes for Energy, Carbohydrate, Fiber, Fat, Fatty Acids, Cholesterol, Protein, and Amino Acids. Washington, DC: National Academies Press; 2005. [Google Scholar]
- 19. Sizer FS, Whitney E, eds. Nutrition Concepts and Controversies. 14 Boston, MA: Cengage Learning; 2017. [Google Scholar]
- 20. Young VR, Pellett PL.. Plant proteins in relation to human protein and amino acid nutrition. Am J Clin Nutr. 1994;59(5 suppl):1203S–1212S. [DOI] [PubMed] [Google Scholar]
- 21. Melina V, Craig W, Levin S.. Position of the Academy of Nutrition and Dietetics: vegetarian diets. J Acad Nutr Diet. 2016;116:1970–1980. [DOI] [PubMed] [Google Scholar]
- 22. US Dept of Health and Human Services, US Dept of Agriculture. Dietary Guidelines for Americans 2015–2020. 8th ed. Washington, DC: US Dept of Health and Human Services and US Dept of Agriculture. http://www.health.gov/dietaryguidelines/2015/guidelines. Published January 7, 2016. Accessed October 30, 2017.
- 23. Rand WM, Pellett PL, Young VR.. Meta-analysis of nitrogen balance studies for estimating protein requirements in healthy adults. Am J Clin Nutr. 2003;77:109–127. [DOI] [PubMed] [Google Scholar]
- 24. Gaffney-Stomberg E, Insogna KL, Rodriguez NR, et al. Increasing dietary protein requirements in elderly people for optimal muscle and bone health. J Am Geriatr Soc. 2009;57:1073–1079. [DOI] [PubMed] [Google Scholar]
- 25. Campbell WW, Crim MC, Dallal GE, et al. Increased protein requirements in elderly people: new data and retrospective reassessments. Am J Clin Nutr. 1994;60:501–509. [DOI] [PubMed] [Google Scholar]
- 26. World Health Organization. Keep Fit for Life: Meeting the Nutritional Needs of Older Persons. Geneva, Switzerland: World Health Organization; 2002. [Google Scholar]
- 27. Rodriguez NR, DiMarco NM, Langley S.. Position of the American Dietetic Association, Dietitians of Canada, and the American College of Sports Medicine: nutrition and athletic performance. J Am Diet Assoc. 2009;109:509–527. [DOI] [PubMed] [Google Scholar]
- 28. Phillips SM, Moore DR, Tang JE.. A critical examination of dietary protein requirements, benefits, and excesses in athletes. Int J Sport Nutr Exerc Metab. 2007;17(suppl):S58–S76. [DOI] [PubMed] [Google Scholar]
- 29. Tarnopolsky M. Protein and amino acid needs for bulking up In: Burke L, Deakin V, eds. Clinical Sports Nutrition. 4 Sydney, Australia: McGraw-Hill; 2009. [Google Scholar]
- 30. Coleman E. Protein requirements for athletes. Clin Nutr Insight. 2012;38:1–3. [Google Scholar]
- 31. Smit E, Nieto FJ, Crespo CJ, et al. Estimates of animal and plant protein intake in US adults: results from the Third National Health and Nutrition Examination Survey, 1988–1991. J Am Diet Assoc. 1999;99:813–820. [DOI] [PubMed] [Google Scholar]
- 32. Halton TL, Hu FB.. The effects of high protein diets on thermogenesis, satiety and weight loss: a critical review. J Am Coll Nutr. 2004;23:373–385. [DOI] [PubMed] [Google Scholar]
- 33. Blatt AD, Roe LS, Rolls BJ.. Increasing the protein content of meals and its effect on daily energy intake. J Am Diet Assoc. 2011;111:290–294. [DOI] [PMC free article] [PubMed] [Google Scholar]
- 34. US Dept of Agriculture, Economic Research Service. Food availability (per capita) data system. Economic Research Service website. https://www.ers.usda.gov/data-products/food-availability-per-capita-data-system/food-availability-per-capita-data-system/#Food Availability. Updated October 29, 2018. Accessed July 26, 2017.
- 35. Gebhardt SE, Thomas RG.. Nutritive Value of Foods. Beltsville, Maryland: US Dept of Agriculture, Agricultural Research Service, Nutrient Data Laboratory; 2002:104. Home and Garden Bulletin 72. [Google Scholar]
- 36. US Dept of Agriculture, Economic Research Service. Loss-adjusted food availability. Economic Research Service website. https://www.ers.usda.gov/data-products/food-availability-per-capita-data-system/food-availability-per-capita-data-system/#Loss-Adjusted Food Availability. Accessed July 26, 2017.
- 37. National Oceanic and Atmospheric Administration, US Dept of Commerce. Fisheries of the United States, 2012. A Statistical Snapshot of 2012 Fish Landings https://www.st.nmfs.noaa.gov/Assets/commercial/fus/fus12/FUS_2012_factsheet.pdf. Published September 2013. Accessed December 21, 2017.
- 38. US Dept of Agriculture, Economics, Statistics and Market Information System. World agricultural supply and demand estimates: World Agricultural Outlook Board [website with links to data]. https://usda.library.cornell.edu/concern/publications/3t945q76s?locale=en. Updated September 12, 2017. Accessed September 12, 2017.
- 39. Fulgoni VL., 3rd Current protein intake in America: analysis of the National Health and Nutrition Examination Survey, 2003–2004. Am J Clin Nutr. 2008;87:1554S–1557S. [DOI] [PubMed] [Google Scholar]
- 40. US Dept of Agriculture, Agricultural Research Service. Nutrient intakes from food and beverages: mean amounts consumed per individual, by gender and age, in the United States, 2013–2014. In: What We Eat in America, NHANES 2013–2014 https://www.ars.usda.gov/ARSUserFiles/80400530/pdf/1314/Table_1_NIN_GEN_13.pdf. Published 2016. Accessed September 12, 2017.
- 41. National Health and Nutrition Examination Survey. 2013–2014 Data Documentation, Codebook, and Frequencies. https://wwwn.cdc.gov/Nchs/Nhanes/2013-2014/DR1IFF_H.htm#DRDINT. Published September 2016. Accessed September 12, 2017.
- 42. Nestle M, Nesheim M.. Why Calories Count: From Science to Politics. Berkeley, CA: University of California Press; 2012. [PubMed] [Google Scholar]
- 43. Schoeller DA, Bandini LG, Dietz WH.. Inaccuracies in self-reported intake identified by comparison with the doubly labelled water method. Can J Physiol Pharmacol. 1990;68:941–949. [DOI] [PubMed] [Google Scholar]
- 44. Dhurandhar NV, Schoeller D, Brown AW, et al. Energy balance measurement: when something is not better than nothing. Int J Obes. 2015;39:1109–1113. [DOI] [PMC free article] [PubMed] [Google Scholar]
- 45. Schatzkin A, Kipnis V, Carroll RJ, et al. A comparison of a food frequency questionnaire with a 24-hour recall for use in an epidemiological cohort study: results from the biomarker-based Observing Protein and Energy Nutrition (OPEN) study. Int J Epidemiol. 2003;32:1054–1062. [DOI] [PubMed] [Google Scholar]
- 46. Slimani N, Bingham S, Runswick S, et al. Group level validation of protein intakes estimated by 24-hour diet recall and dietary questionnaires against 24-hour urinary nitrogen in the European Prospective Investigation into Cancer and Nutrition (EPIC) calibration study. Cancer Epidemiol Biomarkers Prev. 2003;12:784–795. [PubMed] [Google Scholar]
- 47. Freisling H, van Bakel MM, Biessy C, et al. Dietary reporting errors on 24 h recalls and dietary questionnaires are associated with BMI across six European countries as evaluated with recovery biomarkers for protein and potassium intake. Br J Nutr. 2012;107:910–920. [DOI] [PubMed] [Google Scholar]
- 48. US Dept of Agriculture, Agricultural Research Service. US Food Composition Databases. https://ndb.nal.usda.gov/ndb/. Accessed October 2, 2017.
- 49. Rosegrant MW, Thornton PK.. Do higher meat and milk prices adversely affect poor people? ILRI News. March 4, 2008. https://www.ilri.org/ilrinews/index.php/archives/579. Accessed December 6, 2017. [Google Scholar]
- 50. Naylor RL, Hardy RW, Bureau DP, et al. Feeding aquaculture in an era of finite resources. Proc Natl Acad Sci USA. 2009;106:15103–15110. [DOI] [PMC free article] [PubMed] [Google Scholar]
- 51. National Academies of Sciences, Engineering, and Medicine . Nutrient Requirements of Beef Cattle. 8 Washington, DC: The National Academies Press; 2016. [Google Scholar]
- 52. Mekonnen MM, Hoekstra AY.. A global assessment of the water footprint of farm animal products. Ecosystems. 2012;15:401–415. [Google Scholar]
- 53. Brown L, Hindmarsh R, McGregor R.. Dynamic Agriculture: Book 3 (Blackline Masters). New York, NY: McGraw-Hill Education; 2001. [Google Scholar]
- 54. National Pork Board. Pork quick facts. Pork Checkoff website. http://www.pork.org/pork-quick-facts/. Updated November 2017. Accessed December 21, 2017.
- 55. Shepon A, Eshel G, Noor E, et al. Energy and protein feed-to-food conversion efficiencies in the US and potential food security gains from dietary changes. Environ Res Lett. 2016;11:1–8. [Google Scholar]
- 56. Best P. Poultry performance improves over past decades. WATTAgNet website. https://web.archive.org/web/20160616092918/http://www.wattagnet.com/articles/10427-poultry-performance-improves-over-past-decades. Published November 24, 2011. Accessed January 14, 2019.
- 57. US Environmental Protection Agency. Sources of greenhouse gas emissions. Agriculture sector emissions. US Environmental Protection Agency website. https://www.epa.gov/ghgemissions/sources-greenhouse-gas-emissions#agriculture. Accessed April 14, 2017.
- 58. US Environmental Protection Agency. Inventory of U.S. Greenhouse Gas Emissions and Sinks, 1990–2013. https://www.epa.gov/sites/production/files/2016-03/documents/us-ghg-inventory-2015-main-text.pdf. Published April 2015. Accessed April 14, 2017.
- 59. Cassidy ES, West PC, Gerber JS, et al. Redefining agricultural yields: from tonnes to people nourished per hectare. Environ Res Lett. 2013;8:034015. [Google Scholar]
- 60.US Dept of Agriculture, National Agricultural Statistics Service. Agricultural Census, Full Report Vol 1, chap 1. https://www.nass.usda.gov/Publications/AgCensus/2012/Full_Report/Volume_1,_Chapter_1_US/st99_1_008_008.pdf. Published 2012. Accessed January 14, 2019.
- 61.US Dept of Agriculture, National Agricultural Statistics Service. 2012. Census of agriculture: speciality crops. Volume 2, subject series, part 8. https://www.nass.usda.gov/Publications/AgCensus/2012/Online_Resources/Specialty_Crops/SCROPS.pdf. Published February 2015. Accessed April 14, 2017.
- 62. Buzby JC, Wells HF, Vocke G. . Possible Implications for U.S. Agriculture from Adoption of Select Dietary Guidelines. Washington, DC: US Dept of Agriculture, Agricultural Research Service; 2006. Economic Research Report 31. [Google Scholar]
- 63. Heller MC, Keoleian GA.. Greenhouse gas emission estimates of U.S. dietary choices and food loss. J Ind Ecol. 2014;19:391–401. [Google Scholar]
- 64. Mekonnen MM, Hoekstra AY.. The Green, Blue and Grey Water Footprint of Farm animals and Animal Products. Delft, the Netherlands: UNESCO, IHE Delft Institute for Water Education; 2010. Value of Water Research Report 10. [Google Scholar]
- 65. Falkenmark M, Rockstrom J.. The new blue and green water paradigm: breaking new ground for water resources planning and management. J Water Resour Plan Manag. 2006;132:129–132. [Google Scholar]
- 66. Nelson ME, Hamm MW, Hu FB, et al. Alignment of healthy dietary patterns and environmental sustainability: a systematic review. Adv Nutr. 2016;7:1005–1025. [DOI] [PMC free article] [PubMed] [Google Scholar]
- 67. Kaluza J, Wolk A, Larsson SC.. Red meat consumption and risk of stroke: a meta-analysis of prospective studies. Stroke. 2012;43:2556–2560. [DOI] [PubMed] [Google Scholar]
- 68. Ley SH, Hamdy O, Mohan V, et al. Prevention and management of type 2 diabetes: dietary components and nutritional strategies. Lancet. 2014;383:1999–2007. [DOI] [PMC free article] [PubMed] [Google Scholar]
- 69. Satija A, Bhupathiraju SN, Rimm EB, et al. Plant-based dietary patterns and incidence of type 2 diabetes in US men and women: results from three prospective cohort studies. PLoS Med. 2016;13:e1002039. [DOI] [PMC free article] [PubMed] [Google Scholar]
- 70. Fung TT, van Dam RM, Hankinson SE, et al. Low-carbohydrate diets and all-cause and cause-specific mortality: two cohort studies. Ann Intern Med. 2010;153:289–298. [DOI] [PMC free article] [PubMed] [Google Scholar]
- 71. Pan A, Sun Q, Bernstein AM, et al. Red meat consumption and mortality: results from 2 prospective cohort studies. Arch Intern Med. 2012;172:555–563. [DOI] [PMC free article] [PubMed] [Google Scholar]
- 72. Wolfe RR, Miller SL.. The recommended dietary allowance of protein: a misunderstood concept. JAMA. 2008;299:2891–2893. [DOI] [PubMed] [Google Scholar]
- 73. Phillips SM. Current concepts and unresolved questions in dietary protein requirements and supplements in adults. Front Nutr. 2017;4:13. [DOI] [PMC free article] [PubMed] [Google Scholar]
- 74. Wolfe RR, Cifelli AM, Kostas G, et al. Optimizing protein intake in adults: interpretation and application of the recommended dietary allowance compared with the acceptable macronutrient distribution range. Adv Nutr. 2017;8:266–275. [DOI] [PMC free article] [PubMed] [Google Scholar]
- 75. Millward DJ, Layman DK, Tome D, et al. Protein quality assessment: impact of expanding understanding of protein and amino acid needs for optimal health. Am J Clin Nutr. 2008;87:1576S–1581S. [DOI] [PubMed] [Google Scholar]
- 76. Rodriguez NR, Miller SL.. Effective translation of current dietary guidance: understanding and communicating the concepts of minimal and optimal levels of dietary protein. Am J Clin Nutr. 2015;101:1353S–1358S. [DOI] [PubMed] [Google Scholar]
- 77. Harwatt H, Sabaté J, Eshel G, et al. Substituting beans for beef as a contribution toward US climate change targets. Clim Change. 2017;143:261–270. [Google Scholar]
- 78. Eshel G, Martin PA.. Diet, energy, and global warming. Earth Interact. 2006;10:1–17. [Google Scholar]
- 79. Pimentel D, Pimentel M.. Sustainability of meat-based and plant-based diets and the environment. Am J Clin Nutr. 2003;78(3 suppl):660S–663S. [DOI] [PubMed] [Google Scholar]
- 80. Ranganathan J, Vennard D, Waite R, et al. Shifting Diets for a Sustainable Future. Washington, DC: World Resources Institute; 2016:1–90. Working Paper, Installment 11 of Creating a Sustainable Food Future. [Google Scholar]
- 81. Tom MS, Fischbeck PS, Hendrickson CT.. Energy use, blue water footprint, and greenhouse gas emissions for current food consumption patterns and dietary recommendations in the US. Environ Syst Decis. 2016;36:92–103. [Google Scholar]
- 82.United Nations. Paris Agreement 2015. http://unfccc.int/files/essential_background/convention/application/pdf/english_paris_agreement.pdf. Accessed December 20, 2017.
- 83.The White House, Office of the Press Secretary. Fact sheet: US reports its 2025 emissions target to the UNFCCC. http://www4.unfccc.int/ndcregistry/PublishedDocuments/United%20States%20of%20America%20First/U.S.A.%20First%20NDC%20Submission.pdf. Released March 31, 2015. Accessed December 20, 2017.
- 84. Maupin MA, Kenny JF, Hutson SS, et al. Estimated Use of Water in the United States in 2010. Reston, VA: US Dept of the Interior, US Geological Survey; 2014. Circular 1405. [Google Scholar]
Associated Data
This section collects any data citations, data availability statements, or supplementary materials included in this article.