Abstract
Purpose
To reduce radiotracer requirements for amyloid PET/MRI without sacrificing diagnostic quality by using deep learning methods.
Materials and Methods
Forty data sets from 39 patients (mean age ± standard deviation [SD], 67 years ± 8), including 16 male patients and 23 female patients (mean age, 66 years ± 6 and 68 years ± 9, respectively), who underwent simultaneous amyloid (fluorine 18 [18F]–florbetaben) PET/MRI examinations were acquired from March 2016 through October 2017 and retrospectively analyzed. One hundredth of the raw list-mode PET data were randomly chosen to simulate a low-dose (1%) acquisition. Convolutional neural networks were implemented with low-dose PET and multiple MR images (PET-plus-MR model) or with low-dose PET alone (PET-only) as inputs to predict full-dose PET images. Quality of the synthesized images was evaluated while Bland-Altman plots assessed the agreement of regional standard uptake value ratios (SUVRs) between image types. Two readers scored image quality on a five-point scale (5 = excellent) and determined amyloid status (positive or negative). Statistical analyses were carried out to assess the difference of image quality metrics and reader agreement and to determine confidence intervals (CIs) for reading results.
Results
The synthesized images (especially from the PET-plus-MR model) showed marked improvement on all quality metrics compared with the low-dose image. All PET-plus-MR images scored 3 or higher, with proportions of images rated greater than 3 similar to those for the full-dose images (−10% difference [eight of 80 readings], 95% CI: −15%, −5%). Accuracy for amyloid status was high (71 of 80 readings [89%]) and similar to intrareader reproducibility of full-dose images (73 of 80 [91%]). The PET-plus-MR model also had the smallest mean and variance for SUVR difference to full-dose images.
Conclusion
Simultaneously acquired MRI and ultra–low-dose PET data can be used to synthesize full-dose–like amyloid PET images.
© RSNA, 2018
Online supplemental material is available for this article.
See also the editorial by Catana in this issue.
Summary
Diagnostic quality amyloid (fluorine 18 [18F]–florbetaben) PET images can be generated using deep learning methods from data acquired with a markedly reduced radiotracer dose.
Implications for Patient Care
■ The ability to generate diagnostic-quality images from 100-fold fewer counts can lead to reduced radiotracer dose and/or scan duration for amyloid PET/MRI examinations.
■ Deep learning with radiotracer dose reduction may lead to increased usage of hybrid amyloid PET/MRI for clinical diagnostic decision making and for longitudinal studies.
Introduction
Concurrent acquisition of morphologic and functional imaging information for the diagnosis of neurologic disorders has fueled interest in simultaneous PET and MRI (PET/MRI) (1). PET/MRI allows spatial and temporal registration of the two imaging data sets; therefore, the information derived from one modality can be used to improve the other (2,3). For dementia evaluation, PET/MRI enables a single combined imaging examination (4). Amyloid PET has become useful as an adjunct to the diagnosis of Alzheimer disease—amyloid plaque accumulation is a hallmark pathologic finding of Alzheimer disease and can precede the onset of frank dementia by 10 to 20 years (5)—as well as for screening younger populations at high risk of Alzheimer disease in clinical trials of Alzheimer disease pharmaceuticals (6,7).
PET image quality depends on collecting a sufficient number of coincidence events from annihilation photon pairs. However, the injection of radiotracers will subject patients who are scanned to radiation dose; motion during the prolonged data acquisition period results in a misplacement of the events in space, leading to inaccuracies in PET radiotracer uptake quantification (8,9). Thus, reducing collected PET counts either through radiotracer dose reduction (the focus of this work) or shortening scan time (ie, limiting the time for possible motion) while maintaining image quality would be valuable for increased use of PET/MRI.
Convolutional neural networks (CNNs) have the ability to learn translation-invariant representations of objects (10). This has led to remarkable performance increases for image identification (11) and generation (12–14). CNNs that incorporate spatially correlated multimodal MRI and PET information to produce standard-quality PET images from “low-quality (short-time)” PET acquisitions have been implemented (15). The potential to reduce radiotracer dose by at least 100-fold using a deep CNN for fluorine 18 (18F) fluorodeoxyglucose studies in patients with glioblastoma has been demonstrated (16). Such methods should be transferable to PET scans using other radiotracers, such as the amyloid tracer 18F-florbetaben, relevant to Alzheimer disease populations (6,17).
In this study, we aimed to train CNNs to synthesize diagnostic-quality images using a noisy image (eg, one that is reconstructed from simulated markedly reduced radiotracer dose compared with conventional PET/MRI reconstruction). This ultra–low-dose imaging, at levels close to those of transcontinental flights, can potentially increase the utilization of amyloid tracers and PET/MRI in general.
Materials and Methods
This retrospective analysis was approved by the local institutional review board. Written informed consent for PET/MRI imaging was obtained from all study patients or an authorized surrogate decision-maker. A Health Insurance Portability and Accountability Act waiver for authorization of recruitment was obtained for this study. Piramal Imaging (Berlin, Germany) provided support for the radiotracer and GE Healthcare (Waukesha, Wis) provided research funding support. M.K. is an employee for GE Healthcare (Waukesha, Wis) and the other authors had control of inclusion of any data and information that might present a conflict of interest.
PET/MRI Data Acquisition
Retrospective analysis was performed from March 2016 through October 2017 on a convenience sample of 40 separate data sets from 39 patients (mean age ± standard deviation [SD], 67 years ± 8), including 16 male patients and 23 female patients (mean age, 66 years ± 6 and 68 years ± 9, respectively; one female patient was scanned twice, 9 months apart), belonging to two different prospective research cohorts (research questions for each of these cohorts is not related to this study); their diagnoses are given in Table 1. Within the cohorts, the patients were referred by a treating physician. The control patients were scanned for cohort study purposes. Patients between the ages of 21 and 90 years were included; pregnant women and those for whom PET/MRI could not be performed were excluded. MRI and PET data were simultaneously acquired on an integrated PET/MRI scanner with time-of-flight capabilities (SIGNA PET/MR, GE Healthcare). T1-weighted, T2-weighted, and T2 fluid-attenuated inversion recovery morphologic MR images were acquired, with the parameters listed in Appendix E1 (online).
Table 1:
Clinical Diagnoses of Patients in Study Cohorts 1 and 2
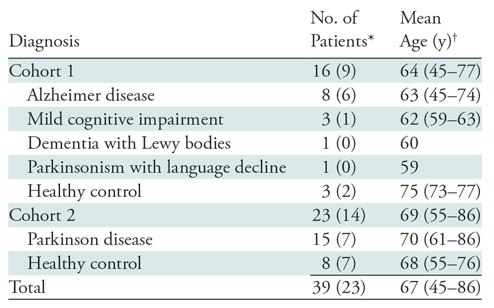
*Data in parentheses are number of female patients.
†Data in parentheses are age ranges.
Each patient was administered an intravenous injection of 330 MBq ± 30 of the amyloid radiotracer 18F-florbetaben (Piramal Imaging) and PET data were acquired 90–110 minutes after injection. The list-mode PET data were reconstructed for the full-dose ground truth image as well as a random subset containing 1/100th of the events (also taking the different randoms rate into account) to produce a low-dose PET image (18). Time-of-flight ordered-subsets expectation-maximization (two iterations and 28 subsets, accounting for randoms, scatter, dead-time, and attenuation) and a 4-mm full-width at half-maximum postreconstruction Gaussian filter was used for all PET images. MR-based attenuation correction was performed using the vendor’s atlas-based method (19) (K.C. with 6, F.M. with 5, and M.K. with 20 years of experience in image acquisition, reconstruction, and processing).
Image Preprocessing
To account for any positional offset of the patient during different acquisitions, MR images were coregistered to the PET images by using the software FSL (FMRIB, Oxford, UK) (20), with 6 degrees of freedom and correlation ratio as the cost function. All images were resectioned to the dimensions of the acquired PET volumes: 89 2.78-mm–thick sections with 256 × 256, 1.17 × 1.17 mm2 pixels. A head mask was made from the T1-weighted image through intensity thresholding and hole filling and applied to the PET and MR images. The voxel intensities of each volume were normalized by its Frobenius norm and used as inputs to the CNN (K.C.).
CNN Implementation
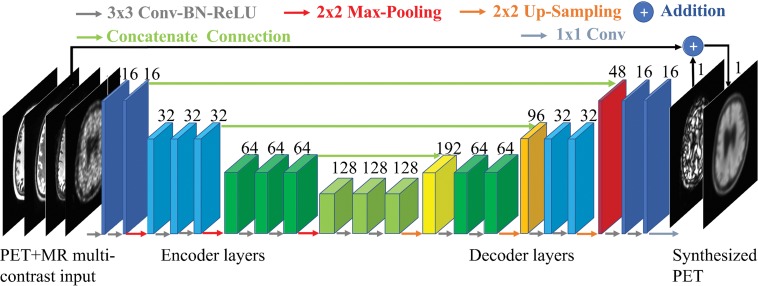
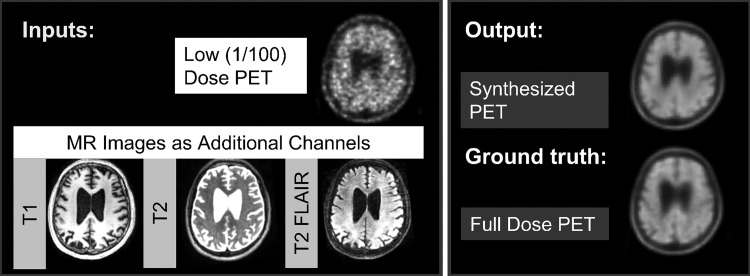
Authors (K.C. with 6 years, E.G. with 6 years, and J.X. with 2 years of experience in image acquisition, reconstruction, and processing) trained an encoder-decoder CNN with the structure (U-Net) shown in Figure 1 (12,21). The inputs of the network are the multicontrast MR images (T1-, T2-, and T2 fluid-attenuated inversion recovery–weighted) and the low-dose PET image. The full-dose PET image was treated as the ground truth and the network (PET-plus-MR model) was trained through residual learning (12) (Fig 2). A PET-only model (trained only with the low-dose PET images as input [ie, without the MR images]) was also trained.
Figure 1:
A schematic of the encoder-decoder convolutional neural network used in this work. The arrows denote computational operations and the tensors are denoted by boxes with the number of channels indicated above each box. Conv = convolution, BN = batch normalization, ReLU = rectified linear unit activation.
Figure 2:
The input and output channels of the convolutional neural network. For the PET+MR model, the low-dose PET and the three MRI contrasts are used as inputs and trained on the full-dose PET image as the ground truth to synthesize an image resembling the full-dose PET image. For the PET-only model, only the low-dose PET image is used as input.
Briefly, the encoder portion is composed of layers that perform two-dimensional convolutions (using 3 × 3 filters) on input 256 × 256 transverse sections, batch normalization, and rectified linear unit activation operations. Two-by-two max pooling is used to reduce the dimensionality of the data. In the decoder portion, the data in the encoder layers are concatenated with those in the decoder layers. Linear interpolation is performed to restore the data to its original dimensions. The network was trained with an initial learning rate of 0.0002 and a batch size of four over 100 epochs. The L1 norm was selected as the loss function, and adaptive moment estimation as the optimization method (22). The output is then added to the input low-dose image to obtain the synthesized PET image. Fivefold cross-validation was used (ie, 32 data sets for training, eight for testing, per network trained).
Assessment of Image Quality
The reconstructed images were first visually inspected for artifacts. For each data set, a FreeSurfer-based (23,24) (Martinos Center, MGH, Charlestown, Mass) brain mask derived from the T1-weighted images was used for voxel-based analyses. For each axial section, the image quality of the synthesized PET images and the original low-dose PET images within the brain mask were compared with the full-dose image using the peak signal-to-noise ratio, structural similarity (25), and root mean square error. The respective metrics for each section were then averaged (K.C., E.G.).
Clinical Readings
The synthesized PET images, the low-dose PET image, and the full-dose PET image of each data set were anonymized, their series numbers were randomized, then presented by series number to two physicians (S.S., G.Z., one a board-certified nuclear medicine physician and the other a board-certified neuroradiologist [both have 12 years of experience postfellowship], both of whom had been certified to read amyloid PET imaging) for independent reading. The amyloid uptake status (positive, negative, uninterpretable) of each image was determined. The amyloid status read from the full-dose images was treated as the ground truth.
For each PET image, the physicians assigned an image quality score on a five-point scale: 1, uninterpretable; 2, poor; 3, adequate; 4, good; and 5, excellent.
To ensure that agreements between and within raters were acceptably high and to compare with the readings of the synthesized full-dose images, the full-dose PET image was clinically read by the same physicians a second time for the amyloid uptake status in a separate reading session (3 months apart), and agreement analyses were performed.
Region-based Analyses
Region-based analyses were carried out to assess the agreement of the tracer uptake between images. Cortical parcellations and cerebral segmentations based on the Desikan-Killiany Atlas (26) were derived from FreeSurfer, yielding a maximum of 111 regions per data set. A total of 4396 records were included in the analysis. The PET (ground truth, low-dose, and synthesized) images were normalized by the cerebellar cortex to derive standard uptake value ratios (SUVRs). The mean SUVR was calculated in all records. The SUVRs were compared between methods (ground truth to low-dose, ground truth to PET-plus-MR model, ground truth to PET-only model) and evaluated by Bland-Altman plots and intraclass correlation from the mixed-effect model (taking into account multiple regions per scan and controlled for age and gender). The results are summarized at the diagnosis level to reflect the group variations and clinical significance (K.C.).
Statistical Analysis and Software
Pairwise t tests were conducted to compare the values of the image quality metrics across the different image processing methods. The accuracy, sensitivity, and specificity were calculated for the readings of the low-dose, PET-plus-MR synthesized PET images, and the PET-only synthesized images. Symmetry tests were also carried out to examine whether the readings produced an equal number of false-positive and false-negative findings. The agreement of the two readers was assessed using Kendall tau-b, Krippendorff alpha, and symmetry tests. Average image scores for each method are presented. Also, image quality scores were dichotomized into 1–3 versus 4–5, with the percentage of images with high scores calculated for each method; the logistic regression model with clustering on rater was used to obtain the predicted percentage of high ratings for each method and the difference between methods. The 95% confidence interval (CI) for the difference in the proportions of high scores was constructed and compared with a predetermined noninferiority benchmark of 15%. Tests were conducted at the P = .05 level (Bonferroni correction to account for multiple comparisons when necessary). Software information is provided in Appendix E1 (online).
Results
Assessment of Image Quality
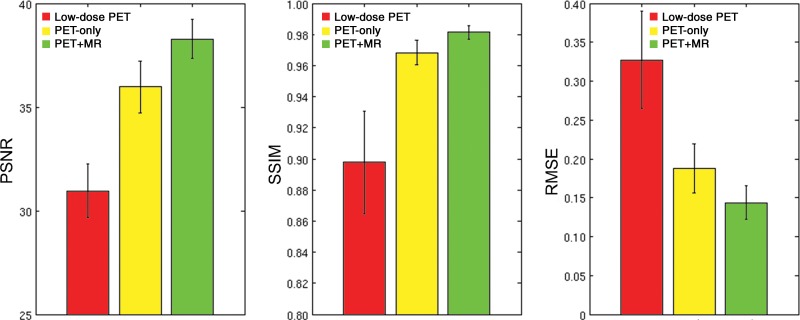
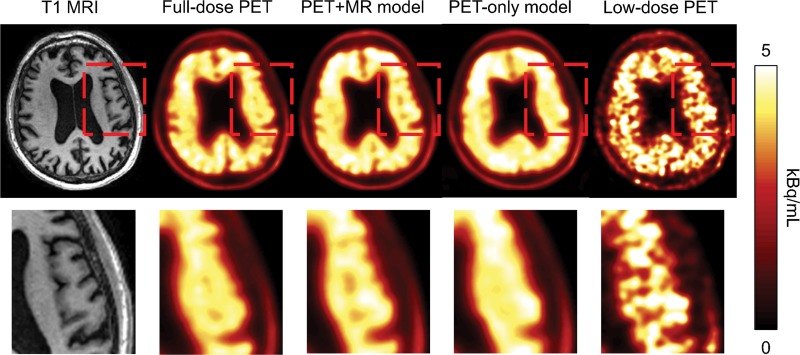
Qualitatively, the synthesized images show marked improvement in image quality compared with the low-dose images and visually resemble the ground truth image. The images synthesized from the PET-plus-MR model had the highest peak signal-to-noise ratio in 39 of 40 as well as the highest structural similarity and lowest root mean square error in all data sets (Fig 3). The low-dose images performed worst using all metrics. All pair-wise t tests (accounting for three comparisons) had P values less than .001. The model trained with multichannel MRI was better able to reflect the underlying anatomy in amyloid uptake (Fig 4; Figures E1 and E2 [online]). Occasional “blotches” of high-uptake patches 2–3 mm in diameter were occasionally observed in both types of synthesized images (Figure E3 [online]).
Figure 3:
Image quality metrics compare images from low-dose PET, the PET-only model, and the PET+MR model. For the three metrics, comparison is to the ground truth full-dose PET images. All pair-wise t tests had P values less than .001. The image generated from the PET+MR model is superior for all three metrics: higher peak signal-to-noise ratio (PSNR), higher structural similarity (SSIM), and lower root mean square error (RMSE).
Figure 4:
Amyloid-positive PET image in a 58-year-old male patient with Alzheimer disease, with the T1-weighted MR image (left) shown as reference. The region within the red box in the images in the top row is enlarged and shown in the bottom row. The synthesized PET images show significantly reduced noise compared with the low-dose PET images, while the images generated from the PET+MR model were superior in reflecting the underlying anatomic patterns of the amyloid tracer uptake compared with the images generated from the PET-only model.
Clinical Readings
Kendall tau-b, Krippendorff alpha, and symmetry tests were used to evaluate between and within raters’ agreements. Inter- and intrareader agreement on amyloid uptake status and image quality scores were high (P value for Kendall tau-b in all comparisons was < .001 and the Krippendorff alpha for all comparisons was > .7), and there was no difference in the scores from each reader (P value of the interreader symmetry tests for the amyloid status at the two time points were .77 and 1, respectively; for the symmetry test on the interreader image quality score, P = .49) (Tables E1–E3 [online]). Twenty-three of 80 (29%) total reads of the full-dose ground truth amyloid images were amyloid positive.
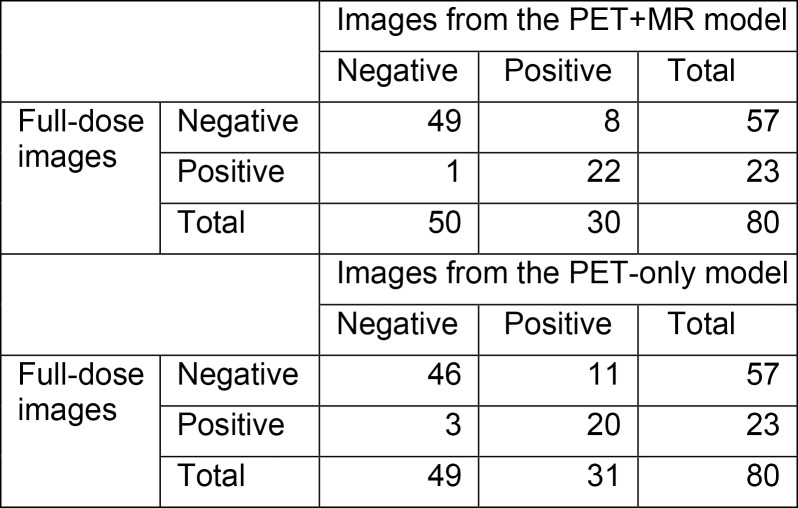
PET images created from 1% dose were inadequate, with a majority of them uninterpretable (56 of 80 [70%] of readings; 95% CI: 59%, 80%). When comparing the accuracy, sensitivity, and specificity of the clinical assessments between the synthesized images and the full-dose images, the PET-plus-MR model produced higher values than the PET-only model (Table 2). The accuracy of the PET-plus-MR model readings was high (71 of 80 [89%]; 95% CI: 80%, 95%). For comparison, the intrareader reproducibility on full-dose images was similar (73 of 80 [91%]; 95% CI: 83%, 96%). For the symmetry tests, the PET-plus-MR and PET-only models had a value of P = .04 and P = .06, respectively. The confusion matrices are provided in Figure 5.
Table 2:
Accuracy, Sensitivity, and Specificity of Uptake Status (Determining Amyloid Positive/Negative) Readings between Synthesized Images and Full-Dose Images

Note.—CI = confidence interval.
*Data in parentheses are percentages.
Figure 5:
Confusion matrices for amyloid status readings between full-dose and PET+MR model images and between full-dose and PET-only model images.
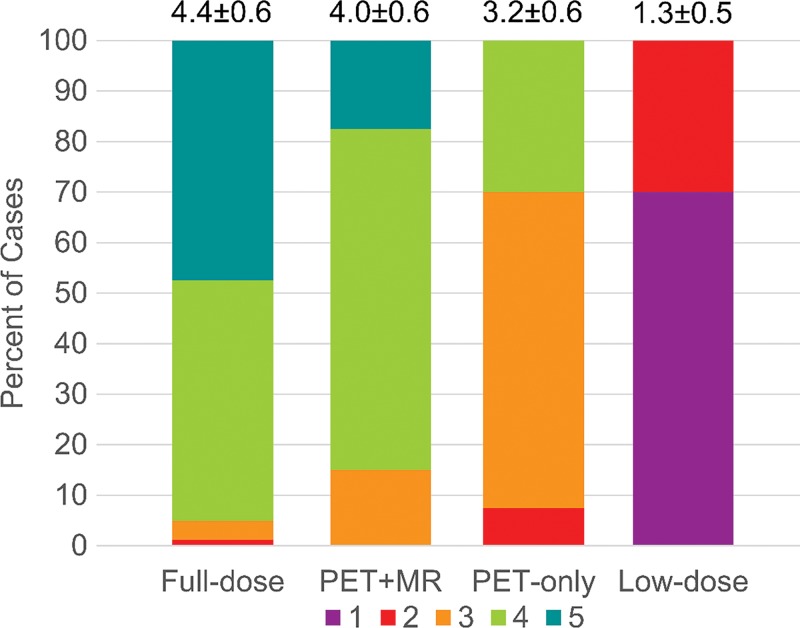
The image quality scores assigned by each reader to each of the reconstructed PET volumes are shown in Figure 6, along with mean scores for each group. All PET-plus-MR model images were scored as adequate (score = 3) or better. Also, the original full-dose images and the PET-plus-MR images generated from 1% dose had comparable proportions of images that scored 4 (good) or higher (difference in proportions of high score images between PET-plus-MR model and full-dose, −10%; 95% CI: −15%, −5%; within the noninferiority benchmark). The PET-only model had fewer images with good or better quality (difference in proportion, −65%; 95% CI: −85%, −45%]) (Tables E4, E5 [online]).
Figure 6:
Clinical image quality scores (1 = uninterpretable/low, 5 = excellent/high; mean scores and standard deviation of all readings presented at top of each bar) as independently assigned by the two readers.
Region-based Analyses
The Bland-Altman plots show the lowest bias, 0.04, and smallest variance (95% CI: −0.26, 0.33) for the PET-plus-MR model images compared with the reference standard full-dose images. The low-dose images had the largest bias and variance compared with the full-dose images (Fig 7). Across diagnosis groups, both deep learning methods produced higher intraclass correlation compared with the low-dose images (Table E6 [online]). For the regional SUVR differences, both deep learning methods have smaller bias compared with the low-dose images, while the standard deviation of the differences was smallest for the PET-plus-MR method (Table E7 [online]). Results based on diagnosis groups are provided in Appendix E1 and Figures E4–E6 (online).
Figure 7:
Bland-Altman two-dimensional histograms of regional standard uptake value ratios (SUVRs) compared between methods (ground truth to low dose, ground truth to PET+MR model, ground truth to PET-only model) across all data sets. The scale bar denotes the number of data points in each pixel; the solid and dashed lines denote the mean and 95% confidence interval (CI) of the SUVR differences, respectively. The images synthesized from the PET+MR model had the lowest bias (0.04) and smallest 95% CI (−0.26, +0.33) relative to the ground truth full-dose images.
Discussion
We aimed to generate diagnostic-quality amyloid PET images from low-dose PET images and simultaneously acquired multimodal MRI sequences, used as inputs in a deep CNN framework. In contrast to previous studies (15), we reconstructed low-count PET images from 1/100th of the list-mode raw data to simulate reduced dose. We have shown that the synthesized images generated from a model incorporating both PET and MR inputs had a greater mean image quality score and smaller regional SUVR bias and variance compared with the low-dose images as well as images synthesized from a model with PET-only inputs. This highlights the value of incorporating morphologic MR information into the model; for the PET-only model, the CNN performs a de-noising task, resulting in images that appear blurred and in a more challenging clinical interpretation. Since tracer uptake in the cortical gray matter is an important factor in determining the amyloid status clinically (27), the images generated with the PET-only model were given lower image quality scores by the readers.
The synthesized images also demonstrated diagnostic value with high accuracy, sensitivity, and specificity for the amyloid status readings, though the synthesized images had a borderline significantly higher false-positive rate, possibly due to the smoothing effect of the CNN that causes activity from adjacent white matter to bleed into the cortical regions. While the reader reproducibility for interpreting full-dose images is different from the reader accuracy for reading amyloid status from different image types, we nevertheless included these reproducibility values as a reference to show typical human accuracy. Our results demonstrate that the accuracy of the PET-plus-MR synthesized images is comparable to that of readers interpreting the same full-dose images at different time points.
Quantitative analyses from the Bland-Altman plots show less bias and variance in the mean regional SUVR values from the CNN-generated values compared with the low-dose images. Moreover, the images from the PET-plus-MR model performed better than the images from the PET-only model. This shows that the PET-plus-MR model is capable of generating images with SUVR values that are comparable to the original full-dose images.
There are several limitations to our study. We performed CNN model training on a two-dimensional model (section by section), though the tracer uptake distribution is also dependent on the morphology along the z-axis. The results can likely be improved by implementing a full three-dimensional model or incorporating morphologic information from neighboring sections (so-called 2.5-dimensional model) for training. During the readings, an unavoidable limitation of the study was that the low-dose images were relatively easy to identify. Also, we occasionally observed blotches of high-intensity values, about 2–3 mm in diameter, possibly due to overfitting from noise that manifested as high-activity spots in the neck region. While these artifacts are not likely to interfere with the clinical interpretation of the image, a mask which excludes the lower sections could mitigate this in the future (further characterization in Appendix E1 [online]). The optimal selection of model hyperparameters and number of MRI contrasts is also a potential area of future work. Motion of the patient during the scan, especially from dementia patients who are more prone to exhibit motion (28), will affect the image quality of the PET images (blurring) used as the ground truth, the MR channels used as inputs to the network, and the clinical readings. This could be assessed with an external motion tracking system for motion correction (29).
Also, with simultaneously acquired PET and MRI data, the clinical image readings, read with image fusion (ie, the amyloid images overlaid upon the T1-weighted images), might have an effect on reader accuracy and agreement, which we would expect to be different if readers relied on the PET images only or if the PET data were acquired on other scanners. The patient population, while adequate to demonstrate the performance of the models, is relatively small. Larger cohorts scanned on a diverse range of scanners will be an area of future study. Also, while the 1% subset of PET data represent only an approximation of the image quality that would be obtained with a true 1% dose, we believe it is a conservative estimation, as with dose reduction, true coincidences decrease linearly while random coincidences decrease as the square of the reduction; future studies examining true ultra–low-dose acquisition are planned. Lastly, we acknowledge that a similar study could be performed with the PET and MRI information acquired separately, though this does not diminish the impact of our study’s findings.
We have shown that high-quality amyloid PET images can be generated using deep learning methods starting from simultaneously acquired MR images and ultra–low-dose PET data. The CNN can reduce image noise from low-dose reconstructions while the addition of multicontrast MR as inputs can recover the uptake patterns of the tracer. Our results can potentially increase the utility of amyloid PET scanning at lower radiotracer dose (radiation exposure similar to that on a transcontinental plane flight) and can inform future Alzheimer disease diagnosis workflows and large-scale clinical trials for amyloid-targeting pharmaceuticals.
APPENDIX
SUPPLEMENTAL FIGURES
Acknowledgments
Acknowledgments
This project was made possible by the NIH grants P41-EB015891 and P50-AG047366, GE Healthcare, the Michael J. Fox Foundation for Parkinson’s Disease Research, and Piramal Imaging. The authors would also like to thank Tie Liang, EdD, for the statistical analyses.
K.T.C., A.B., and G.Z. supported by Piramal Imaging. A.B. and K.L.P. supported by Michael J. Fox Foundation for Parkinson’s Research (6440-01). K.T.C., E.G., K.L.P., S.J.S., M.D.G., E.M., and G.Z. supported by National Institutes of Health (P41-EB015891, P50-AG047366). K.T.C., E.G., A.B., M.K., J.M.P., and G.Z. supported by GE Healthcare.
Disclosures of Conflicts of Interest: K.T.C. Activities related to the present article: disclosed grant to institution from GE Healthcare, National Institutes of Health (NIH), Foundation of the American Society of Neuroradiology (ASNR); support from Foundation of the ASNR (received through Stanford University) for travel to meetings for the study or other purposes; and receipt of payment from Piramal Imaging for provision of writing assistance, medicines, equipment, or administrative support. Activities not related to the present article: disclosed receipt of National Defense Science and Engineering Graduate (NDSEG) Fellowship, Whitaker Health Fund Fellowship (graduate stipend received through Massachusetts Institute of Technology [MIT]); payment from The Chinese Oncology Society, National Taiwan University, National Taiwan University Hospital for lectures, including service on speakers’ bureaus; payment from International Society for Magnetic Resonance in Medicine (ISMRM) and World Molecular Imaging Society (WMIS) for travel/accommodations/meeting expenses. Other relationships: disclosed no relevant relationships. E.G. Activities related to the present article: disclosed no relevant relationships. Activities not related to the present article: disclosed payment received from Subtle Medical for board membership and employment, and stock options from Subtle Medical. Other relationships: disclosed money paid to institution for pending applied patent through Stanford University. F.B.d.C.M. Activities related to the present article: disclosed no relevant relationships. Activities not related to the present article: disclosed payment received for employment by Hospital da Clinicas da USP. Other relationships: disclosed no relevant relationships. J.X. disclosed no relevant relationships. A.B. Activities related to the present article: disclosed grant received by institution from GE Healthcare and Michael J Fox Foundation; payment made to institution by Piramal Imaging for provision of writing assistance, medicines, equipment, or administrative support. Activities not related to the present article: disclosed no relevant relationships. Other relationships: disclosed no relevant relationships. M.K. Activities related to the present article: disclosed no relevant relationships. Activities not related to the present article: disclosed payment received for employment with GE Healthcare. Other relationships: disclosed no relevant relationships. K.L.P. Activities related to the present article: disclosed grant (NIH/NIA P50 AG047366) to institution from Michael J Fox Foundation for Parkinson's Research, NIH. Activities not related to the present article: disclosed grants (NIH/NIA AG047366, NIH/NINDS NS075097, NS062684, NS091461, NS086085, NIH/NIBIB EB022907, NIH/NIAAA AA023165) from Michael J Fox Foundation for Parkinson's Research, NIH. Other relationships: disclosed no relevant relationships. S.J.S. Activities related to the present article: disclosed NIH grant P50 AG047366 (Stanford Alzheimer Disease Research Center Grant) to institution; receipt of honorarium from the University of Southern California to serve as safety officer for NIH-funded study, LEARNit; receipt of payment by Merck for work as principal investigator on clinical trial for prodromal Alzheimer disease; receipt of payment from Biogen Idec for serving as principal investigator on two clinical trials for prodromal or mild Alzheimer disease (PRIME and EMERGE); receipt of payment from F Hoffman La Roche Ltd/Genentech for serving as principal investigator on three clinical trials for prodromal or mild Alzheimer disease; and receipt of payment by Alkahest for serving as principal investigator for clinical trial for moderate Alzheimer disease. Activities not related to the present article: disclosed payment from Abelson Taylor, Baird, Clearview Healthcare Partners, SelfCare Catalysts Inc. for consultancy. Other relationships: disclosed no relevant relationships. M.D.G. Activities related to the present article: disclosed grant to institution from NIH. Activities not related to the present article: disclosed no relevant relationships. Other relationships: disclosed no relevant relationships. E.M. Activities related to the present article: disclosed no relevant relationships. Activities not related to the present article: disclosed receipt of payment by Eli Lilly Advisor Board for board membership and by Biogen for consultancy, and grant(s) from NIH. Other relationships: disclosed no relevant relationships. J.M.P. Activities related to the present article: disclosed institutional grants for research support from GE and NIH. Activities not related to the present article: disclosed membership on the Scientific Advisory Board for Subtle Medical, for which no cash payment was received but stock options may one day be available. He also disclosed money paid to his institution by Subtle Medical for pending patent on method presented in the article, licensed exclusively to Subtle Medical, and stock options paid to Stanford for the exclusive license (approximately 10% was paid to J.M.P.). Other relationships: disclosed no relevant relationships. S.S. Activities related to the present article: disclosed no relevant relationships. Activities not related to the present article: disclosed employment as Chief Medical Officer for approximately 1 year with Sirtex Medical Inc., which manufactures microspheres for radioembolization of liver tumors and has nothing to do with the research topics in this article. Other relationships: disclosed no relevant relationships. G.Z. Activities related to the present article: disclosed institutional grant from GE Healthcare. Activities not related to the present article: disclosed stock in and co-foundership of Subtle Medical. Other relationships: disclosed money received by institution for pending, issued, and licensed US patents on deep learning methods.
Abbreviations:
- CI
- confidence interval
- CNN
- convolutional neural network
- SUVR
- standard uptake value ratio
References
- 1.Pichler BJ, Kolb A, Nägele T, Schlemmer HP. PET/MRI: paving the way for the next generation of clinical multimodality imaging applications. J Nucl Med 2010;51(3):333–336. [DOI] [PubMed] [Google Scholar]
- 2.Catana C, Drzezga A, Heiss WD, Rosen BR. PET/MRI for neurologic applications. J Nucl Med 2012;53(12):1916–1925. [DOI] [PMC free article] [PubMed] [Google Scholar]
- 3.Judenhofer MS, Wehrl HF, Newport DF, et al. Simultaneous PET-MRI: a new approach for functional and morphological imaging. Nat Med 2008;14(4):459–465. [DOI] [PubMed] [Google Scholar]
- 4.Drzezga A, Barthel H, Minoshima S, Sabri O. Potential clinical applications of PET/MR imaging in neurodegenerative diseases. J Nucl Med 2014;55(Supplement 2):47S–55S. [DOI] [PubMed] [Google Scholar]
- 5.Jack CR, Jr, Knopman DS, Jagust WJ, et al. Hypothetical model of dynamic biomarkers of the Alzheimer’s pathological cascade. Lancet Neurol 2010;9(1):119–128. [DOI] [PMC free article] [PubMed] [Google Scholar]
- 6.Berti V, Pupi A, Mosconi L. PET/CT in diagnosis of dementia. Ann N Y Acad Sci 2011;1228(1):81–92. [DOI] [PMC free article] [PubMed] [Google Scholar]
- 7.Sevigny J, Chiao P, Bussière T, et al. The antibody aducanumab reduces Aβ plaques in Alzheimer’s disease. Nature 2016;537(7618):50–56. [DOI] [PubMed] [Google Scholar]
- 8.Catana C, Benner T, van der Kouwe A, et al. MRI-assisted PET motion correction for neurologic studies in an integrated MR-PET scanner. J Nucl Med 2011;52(1):154–161. [DOI] [PMC free article] [PubMed] [Google Scholar]
- 9.Chen KT, Salcedo S, Chonde DB, et al. MR-assisted PET motion correction in simultaneous PET/MRI studies of dementia subjects. J Magn Reson Imaging 2018;48(5):1288–1296. [DOI] [PMC free article] [PubMed] [Google Scholar]
- 10.Gens R, Domingos P. Deep Symmetry Networks. Adv Neural Inf Process Syst 2014. [Google Scholar]
- 11.He KM, Zhang XY, Ren SQ, Sun J. Delving Deep into Rectifiers: Surpassing Human-Level Performance on ImageNet Classification. 2015 IEEE International Conference on Computer Vision (ICCV), 2015; 1026–1034. [Google Scholar]
- 12.Chen H. Low-Dose CT with a Residual Encoder-Decoder Convolutional Neural Network (RED-CNN) 2017. https://arxiv.org/pdf/1702.00288.pdf. Accessed November 4, 2017. [DOI] [PMC free article] [PubMed]
- 13.Liu F, Jang H, Kijowski R, Bradshaw T, McMillan AB. Deep learning MR imaging-based attenuation correction for PET/MR imaging. Radiology 2018;286(2):676–684. [DOI] [PMC free article] [PubMed] [Google Scholar]
- 14.Shen D, Wu G, Suk HI. Deep learning in medical image analysis. Annu Rev Biomed Eng 2017;19(1):221–248. [DOI] [PMC free article] [PubMed] [Google Scholar]
- 15.Xiang L, Qiao Y, Nie D, An L, Wang Q, Shen D. Deep auto-context convolutional neural networks for standard-dose PET image estimation from low-dose PET/MRI. Neurocomputing 2017;267:406–416. [DOI] [PMC free article] [PubMed] [Google Scholar]
- 16.Gong E, Guo J, Pauly J, Zaharchuk G. Deep learning enables at least 100-fold dose reduction for PET imaging [abstr]. In: Radiological Society of North America scientific assembly and annual meeting program [book online]. Oak Brook, Ill: Radiological Society of North America, 2017. https://rsna2017.rsna.org/program/index.cfm. Accessed March 11, 2018. [Google Scholar]
- 17.Becker GA, Ichise M, Barthel H, et al. PET quantification of 18F-florbetaben binding to β-amyloid deposits in human brains. J Nucl Med 2013;54(5):723–731. [DOI] [PubMed] [Google Scholar]
- 18.Gatidis S, Würslin C, Seith F, et al. Towards tracer dose reduction in PET studies: simulation of dose reduction by retrospective randomized undersampling of list-mode data. Hell J Nucl Med 2016;19(1):15–18. [DOI] [PubMed] [Google Scholar]
- 19.Iagaru A, Mittra E, Minamimoto R, et al. Simultaneous whole-body time-of-flight 18F-FDG PET/MRI: a pilot study comparing SUVmax with PET/CT and assessment of MR image quality. Clin Nucl Med 2015;40(1):1–8. [DOI] [PMC free article] [PubMed] [Google Scholar]
- 20.Jenkinson M, Beckmann CF, Behrens TE, Woolrich MW, Smith SM. Fsl. Neuroimage 2012;62(2):782–790. [DOI] [PubMed] [Google Scholar]
- 21.Ronneberger O, Fischer P, Brox T. U-Net: Convolutional Networks for Biomedical Image Segmentation 2015. https://arxiv.org/pdf/1505.04597.pdf. Accessed November 4, 2017.
- 22.Kingma DP, Ba J. Adam: A Method for Stochastic Optimization 2014. https://arxiv.org/pdf/1412.6980.pdf. Accessed April 12, 2018.
- 23.Fischl B, Sereno MI, Dale AM. Cortical surface-based analysis. II: Inflation, flattening, and a surface-based coordinate system. Neuroimage 1999;9(2):195–207. [DOI] [PubMed] [Google Scholar]
- 24.Dale AM, Fischl B, Sereno MI. Cortical surface-based analysis. I. Segmentation and surface reconstruction. Neuroimage 1999;9(2):179–194. [DOI] [PubMed] [Google Scholar]
- 25.Wang Z, Bovik AC, Sheikh HR, Simoncelli EP. Image quality assessment: from error visibility to structural similarity. IEEE Trans Image Process 2004;13(4):600–612. [DOI] [PubMed] [Google Scholar]
- 26.Desikan RS, Ségonne F, Fischl B, et al. An automated labeling system for subdividing the human cerebral cortex on MRI scans into gyral based regions of interest. Neuroimage 2006;31(3):968–980. [DOI] [PubMed] [Google Scholar]
- 27.Rowe CC, Villemagne VL. Brain amyloid imaging. J Nucl Med 2011;52(11):1733–1740. [DOI] [PubMed] [Google Scholar]
- 28.Ikari Y, Nishio T, Makishi Y, et al. Head motion evaluation and correction for PET scans with 18F-FDG in the Japanese Alzheimer’s disease neuroimaging initiative (J-ADNI) multi-center study. Ann Nucl Med 2012;26(7):535–544. [DOI] [PubMed] [Google Scholar]
- 29.Maclaren J, Aksoy M, Ooi MB, Zahneisen B, Bammer R. Prospective motion correction using coil-mounted cameras: cross-calibration considerations. Magn Reson Med 2018;79(4):1911–1921. [DOI] [PMC free article] [PubMed] [Google Scholar]
Associated Data
This section collects any data citations, data availability statements, or supplementary materials included in this article.


