

Abstract
Purpose
To evaluate ability of radiomic (computer-extracted imaging) features to distinguish non-small cell lung cancer adenocarcinomas from granulomas at noncontrast CT.
Materials and Methods
For this retrospective study, screening or standard diagnostic noncontrast CT images were collected for 290 patients (mean age, 68 years; range, 18–92 years; 125 men [mean age, 67 years; range, 18–90 years] and 165 women [mean age, 68 years; range, 33–92 years]) from two institutions between 2007 and 2013. Histopathologic analysis was available for one nodule per patient. Corresponding nodule of interest was identified on axial CT images by a radiologist with manual annotation. Nodule shape, wavelet (Gabor), and texture-based (Haralick and Laws energy) features were extracted from intra- and perinodular regions. Features were pruned to train machine learning classifiers with 145 patients. In a test set of 145 patients, classifier results were compared against a convolutional neural network (CNN) and diagnostic readings of two radiologists.
Results
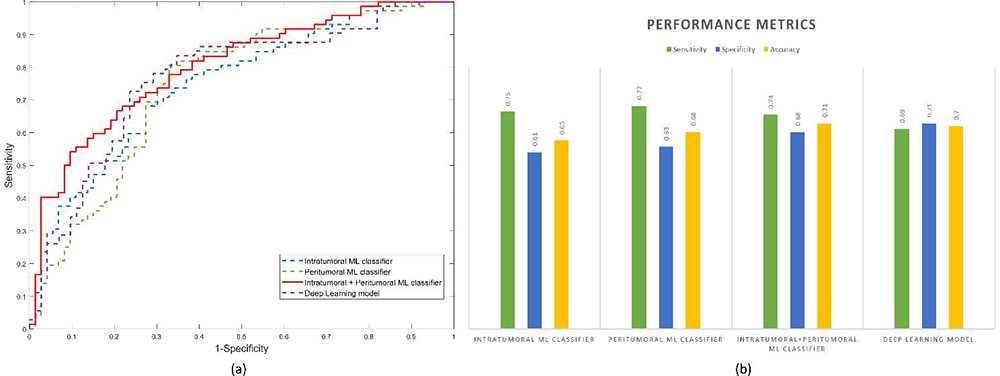
Support vector machine classifier with intranodular radiomic features achieved an area under the receiver operating characteristic curve (AUC) of 0.75 on the test set. Combining radiomics of intranodular with perinodular regions improved the AUC to 0.80. On the same test set, CNN resulted in an AUC of 0.76. Radiologist readers achieved AUCs of 0.61 and 0.60, respectively.
Conclusion
Radiomic features from intranodular and perinodular regions of nodules can distinguish non-small cell lung cancer adenocarcinomas from benign granulomas at noncontrast CT.
© RSNA, 2018
Online supplemental material is available for this article.
See also the editorial by Nishino in this issue.
Summary
Perinodular and intranodular radiomic features corresponding to texture and shape (radiomics) were evaluated to distinguish non-small cell lung cancer adenocarcinomas from benign granulomas at noncontrast CT.
Implications for Patient Care
■ A radiomic machine classifier could potentially aid in distinguishing granulomas from adenocarcinomas at lung CT.
■ Radiomics analysis of lung CT has potential to reduce the number of interventions and repeat imaging scans due to benign granulomas misidentified as indeterminate or suspicious.
Introduction
Adenocarcinomas are the most prevalent subtype of non-small cell lung cancer, making it the most common true-positive finding in a given noncontrast lung cancer screening population (1), whereas noncalcified granulomas represent the most common and possibly most confounding false-positive finding (2,3). Differentiating these two pathologic conditions is one of the most challenging issues faced by thoracic radiologists due to their similar appearance on CT images. A majority of noncalcified granulomas (<1 cm in size), like adenocarcinomas, also tend to appear fluorodeoxyglucose avid at PET/CT during their acute phase of infection (4).
There is a substantial interest in the use of radiomics (computer-extracted imaging features) (5) on CT images for distinguishing between benign and malignant nodules on lung CT images (6–9). Hawkins et al (9) demonstrated that shape features of lung nodules can help to detect malignant nodules on screening CT images. However, lobulated shape features of malignant nodules can also be seen in 25% of benign nodules (10). The advent of deep learning algorithms, particularly convolution neural networks (CNNs), has emerged as a popular methodology for lung nodule classification (11,12). Jin et al (11) constructed a three-dimensional CNN on 888 CT images to achieve a sensitivity of 92% and to reduce false-positive detections in pulmonary nodules. Another CNN-based study obtained an error rate of 4.5% in classifying malignancy in 776 nodules (12).
Although radiomic or CNN-based analysis to distinguish benign and malignant lung nodules is extensive, no specific emphasis has been given to distinguish granulomas from adenocarcinomas on CT images. In a single-site study (13) of 55 nodules, the role of intranodular texture for distinguishing granulomas from adenocarcinomas was evaluated. However, we are not aware of any work that has attempted to collectively evaluate the role of nodule shape and textural patterns of heterogeneity within the nodule and also assess the perinodular habitat outside the nodule to classify granulomas from adenocarcinomas. On a small data set of 50 nodules with unconfirmed diagnosis (14), pulmonary parenchyma was evaluated to identify 39 significant radiomic features but lacked an independent validation set for final determination of algorithm utility.
Density of tumor-infiltrating lymphocytes and tumor-associated stromal macrophages in the stroma around tumor has been shown to be associated with likelihood of metastasis (15). We hypothesized that the peritumoral region may possess this valuable information to improve the efficiency of intranodular radiomic analysis. Our study attempted to evaluate whether radiomic features associated with heterogeneity patterns in the immediate vicinity outside of the nodule (perinodular habitat) was predictive of malignancy on noncontrast CT images, and whether the combination of peri- and intranodular radiomic patterns together was more predictive of nodule malignancy compared with intranodular measurements alone. A machine classifier was trained on a cohort of 145 patients to evaluate perinodular versus a combination of intra- and perinodular radiomic features for discriminating adenocarcinomas from granulomas on noncontrast CT images. We also compared the approaches against a CNN. All approaches were then independently evaluated on a separate cohort of 145 patients. An overview of our methodology is illustrated in Figure 1, A.
Figure 1:

A, Images show overview of methodology. CT images were retrospectively collected. Region of interest was manually segmented in axial view to obtain intranodular mask, and perinodular masks were automatically generated for varying distances (shown here at 5 mm) outside tumor. Haralick, Laws energy, Gabor texture, and shape features were extracted from largest tumor slice. Next, t test was implemented to select top 12 features to train support vector machine classifier and validate it on independent set (n = 145). B, Diagram shows features extracted in each experiment before feature selection was implemented. Total of 1776 features were extracted from each solitary pulmonary nodule, with 252 features from intranodular region, 12 shape features, and 1512 features from perinodular regions (252 features from each of the six perinodular regions).
Materials and Methods
Our study is Health Insurance Portability and Accountability Act–compliant and institutional review board–approved, where a retrospective chart review with de-identified data was used and no protected health information was needed. Thus, need for an informed consent from all patients was waived.
Data
A subset of this data has been previously published (16–18), in which nodule segmentation and classification by using intranodular, shape, and vessel tortuosity features were studied in 195 patients. Our work incorporates perinodular radiomics, evaluates a deep learning approach, and assesses the human-machine comparison. Between January 1, 2007 and December 31, 2013, radiologic image archives of participating institutions were searched consecutively to identify 471 patients who either had a granuloma or an adenocarcinoma as assessed with histopathologic analysis. Patients with the following criteria were included: availability of pathologic report through thoracoscopic wedge resection, presence of a screening or diagnostic thoracic CT image in axial view, and presence of a solitary pulmonary nodule. To this cohort of 405 patients, we applied the exclusion criteria of removing images with CT artifacts (n = 48), images with presence of contrast enhancement (n = 37), and patients who underwent biopsy prior to imaging (n = 30). The final cohort had 290 patients (Fig 2), which was randomly divided into a training set that consisted of 145 patients with 73 adenocarcinomas and 72 granulomas and a test set that contained 72 adenocarcinomas and 73 granulomas. The CT images were acquired from Siemens (Sygno; Erlangen, Germany), General Electric (Lightspeed16; Waukesha, Wis), Philips (iCT; Cleveland, Ohio), or Toshiba (Aquilion; Tochigi-ken, Japan). Further details regarding image acquisition are provided in section 1 of Appendix E1 and Table E1 (both online).
Figure 2:

Consolidated Standards of Reporting Trials, or CONSORT, flow diagram of patient enrollment, eligibility, and exclusion criteria of data set.
Nodule Segmentation and Feature Extraction
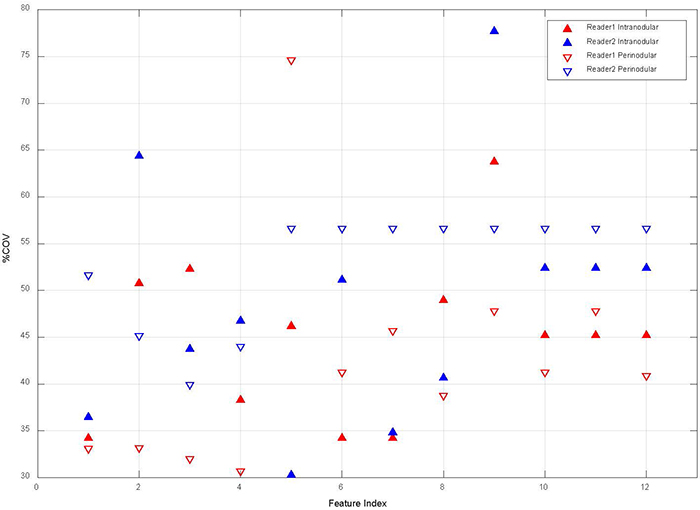
The nodule was identified by a single board-certified cardiothoracic radiologist (R.G., with 20 years of experience) and the region of interest was manually segmented (R.G.) across all of the two-dimensional sections of the nodule with a hand-annotation tool in axial view by using an open-source software (3D Slicer, version 4.7; National Institutes of Health–funded; https://www.slicer.org) (19,20). The radiologist was blinded to pathologic diagnosis but was provided with clinical information such as age, and was also given the option to vary the window and level setting within this software to efficiently annotate the nodule. From this intranodular region, two-dimensional texture features were extracted from a single representative section that had the largest nodule area (21). To assess for segmentation variability, two additional readers (P.R., a radiologist with 11 years of experience in thoracic radiology and K.B., a physician with 3 years of cardiothoracic research experience) were recruited to independently segment a random cohort of 60 nodules. Further details can be found in section 4 of Appendix E1 (online).
After the intranodular mask was annotated, depending on the pixel size, a morphologic operation of dilation was performed to capture the region outside the nodule up to a radial distance of 30 mm. The intranodular mask was then subtracted from this dilated mask to obtain a ring of lung parenchyma immediately around the nodule (see Fig 3). Further details about perinodular mask generation are provided in section 2 of Appendix E1 and Figure E1 (both online). From this 30-mm perinodular region, features were extracted (Fig 3, C) and then divided into 5-mm rings (Fig 3, D) by calculating median, standard deviation, skewness, and kurtosis.
Figure 3:

Images show feature extraction from perinodular region. A, B, Noncontrast CT scans in axial view of adenocarcinoma in a 55-year-old man and granuloma in a 67-year-old woman, respectively. C, Heat map of Haralick entropy feature that was extracted from lung parenchyma (also termed perinodular region of lung nodule) demonstrates, D, various intervals (up to 30 mm of lung parenchyma, outside lung nodule) from which radiomic features were extracted as annular rings.
Additionally, 12 shape features were also extracted with the Matlab platform (version 2015b; Mathworks, Natick, Mass). All feature values were normalized (mean of 0 and a standard deviation of 1). The detailed description of the features extracted (Haralick, wavelet-based Gabor responses, and Laws energy) are provided in section 3 of Appendix E1 (online). Table E2 (online) details the possible pathophysiologic relevance of these features. Table E3 (online) lists the shape features extracted. A pictorial representation of features extracted from each region is shown in Figure 1, B.
To extract deep features by using a CNN, two-dimensional patches with a receptive field size of 100 pixels around the center of the identified nodule were cropped across all slices and fed as input. Deep features were extracted by using a multilayer LeNet model (22), which consisted of three sets of convolutional, activation (rectified linear activation), and pooling layers, and a softmax classifier. Figure E7 (online) illustrates these different layers of the LeNet model. Further information is provided in section 6 of Appendix E1 (online).
Statistical Analysis
Statistical analysis reported in our study was performed with Matlab (Mathworks). The t test was implemented as a feature selection method (23), and to avoid the curse of dimensionality and reduce the risk of overfitting, only the top 12 performing features with the lowest unadjusted P value (P < .05, by using two-sided Wilcoxon rank sum tests) were used for further analysis (6).
In the first experiment, to determine perinodular imaging features that best discriminated adenocarcinomas from granulomas on CT images, top 12 features were used to train linear discriminant analysis, quadratic discriminant analysis, support vector machine (support vector machine–linear and radial basis function kernels) (24), and random forest classifiers and then validated on an independent set (n = 145) by using the area under the receiver operating characteristic curve (AUC) metric. Next, to identify quantitative imaging (intra- and perinodular) texture and shape features that best discriminated adenocarcinomas from granulomas on CT images, similarly to the first experiment, top features were used to train multiple classifiers (linear discriminant analysis, quadratic discriminant analysis, support vector machine–linear and radial basis function kernels, and random forest) and then validated on the independent test set. Unsupervised hierarchical clustering was also performed on the test set to assess the predictive ability of the identified features. These experiments were performed by four authors (N. Beig, M.K., M.A., and P.P.) in consensus.
To understand the biologic inference and potentially recognize a possible physiologic basis for these top-expressing radiomic features, hematoxylin and eosin–stained pretreatment diagnostic core biopsy specimens for representative patients (Fig 4) were qualitatively and independently examined by a single board-certified pulmonary pathologist (M.Y., with 10 years of experience).
Figure 4:

Images show intranodular and perinodular radiomics of adenocarcinoma in a 61-year-old woman at noncontrast CT (axial view). A, Higher spatial resolution image of malignant nodule. B, Top row represents higher expression of Laws energy (E5W5) inside tumor; E5W5 implies that Laws energy–based textural patterns of edges (or E ) in horizontal direction and waves (or W ) in vertical direction by using five-pixel by five-pixel two-dimensional convolution filter. Further information on Laws energy features can be found in Table E2 (online). Bottom row shows representative hematoxylin and eosin (H&E) stain of adenocarcinoma (original magnification, ×100), where tumor cells show high nucleus-to-cytoplasm ratio with irregularly shaped nuclei. Tumor cells form angulated irregular acini in background of fibrosis. Scant intranodular lymphocytes are present. Pigmented macrophages are present within malignant acini. C, Top row represents radiomic heat map of low-frequency Gabor feature, which is expressed higher in adenocarcinomas in peritumoral region, and bottom row is H&E stain of adenocarcinoma (original magnification, ×100), where increased lymphocytes and macrophages are observed at interface between tumor and normal lung. This “rim” of lymphocytes and macrophages is less than 1 mm. D, Shape of entire malignant nodule.
The machine learning classifier was compared against the deep learning algorithm by training and validating on a two-dimensional LeNet-tuned CNN architecture (22) and the nodule-evaluating ability of two human readers, who worked independently. Reader 1 (P.R.) was a board-certified attending radiologist and reader 2 (C.D., with 3 years of experience in reading chest CT images) was a pulmonologist. In this single readout session, both readers were blinded to the pathologic diagnosis and clinical information (ie, age and sex). Readers were allowed to go back between the images multiple times as required to make their final diagnosis and were also given the option to vary the window and level setting to adjust image intensity. Their individual nodule scores (score of 1 was “benign,” score of 2 was “mostly benign,” score of 3 was “not sure,” score of 4 was “mostly malignant,” and score of 5 was “malignant”) were recorded for comparison with the machine learning classifier. Last, influence of CT acquisition parameters (manufacturer, section thickness, type of image) was also assessed for the ability to distinguish adenocarcinomas from granulomas.
Results
Perinodular Radiomics 5 mm from the Nodule Discriminate Adenocarcinomas from Granulomas
The most predictive features were found to be within an immediate distance of 5 mm from the nodule. The top 12 radiomic feature set obtained from the training set are listed in Table 1. Higher expression of low-frequency Gabor features in adenocarcinomas was frequently represented, occupying 11 of the top 12 features (Fig E4 [online]). In Figure 4, C, higher expression of low-frequency Gabor features in adenocarcinomas can be seen when compared with granulomas in Figure 5, C. A higher filter response of Laws energy (R5S5) was also detected in the peritumoral region of adenocarcinomas, which perceives spotlike textural patterns.
Table 1:
Top 12 Radiomic Features Identified in Each Experiment to Distinguish Adenocarcinomas from Granulomas on CT Images
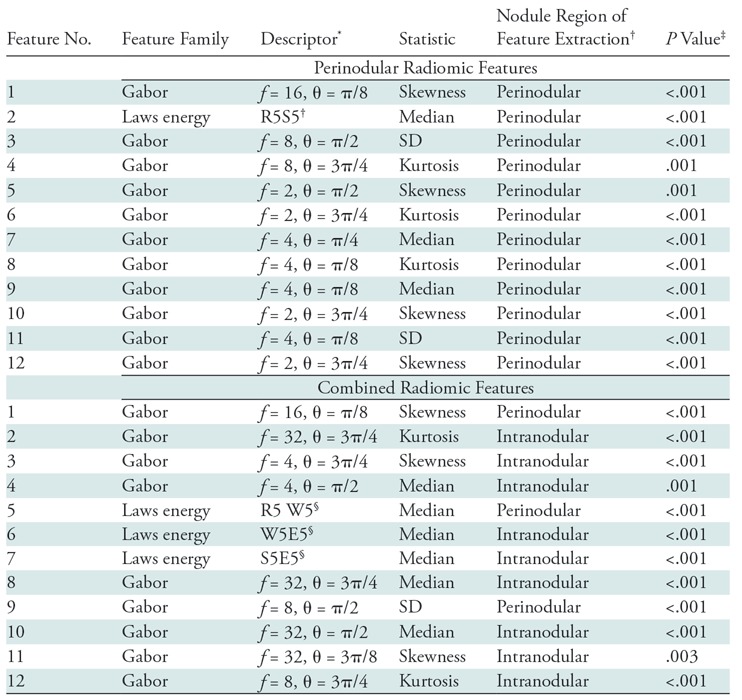
Note.—Combined radiomic features include intranodular, perinodular, and shape features. SD = standard deviation.
*Data indicates details about the feature (such as f = frequency of the filter, θ = orientation of the filter with respect to the normal axis).
†“Intranodular” implies that the texture within the lung nodule was a strong radiomic predictor of malignancy status. “Perinodular” (distance of 0–5 mm) indicates the region of the lung parenchyma immediately outside the CT nodule that has radiomic-based imaging markers that can differentiate adenocarcinomas from granulomas.
‡P values were computed by using the paired Student t test for continuous variables.
§Feature descriptors for Laws energy descriptors include all combinations of five one-dimensional filters: level (L), edge (E), spot (S), wave (W), and ripple (R). For example, in the perinodular radiomic feature experiment, R5S5 (feature number 2) implies that Laws energy-based textural patterns of ripples (R) in the horizontal direction and spots (S) in the vertical direction by using five-pixel by five-pixel two-dimensional convolution filter was statistically different (P < .001) between adenocarcinomas and granulomas. Further information on Laws energy features can be found in Table E2 (online).
Figure 5:

Images show intranodular and perinodular radiomics of granuloma in a 55-year-old man at noncontrast CT (axial view). A, Higher spatial resolution image of benign nodule. B, Top row represents lower expression of Laws energy (E5 W5) inside tumor; E5W5 implies that Laws energy-based textural patterns of edges (or E ) in horizontal direction and waves (or W ) in vertical direction by using five-pixel by five-pixel two-dimensional convolution filter. Further information on Laws energy features can be found in Table E2 (online). Bottom row shows representative hematoxylin and eosin (H&E) stain of granuloma (original magnification, ×100), where it consists of admixed lymphocytes, plasma cells, and histiocytes. There are also areas of fibrosis, necrosis, and calcification. C, Top row represents radiomic heat map of low-frequency Gabor feature, which has low expression in granulomas in peritumoral region, and bottom row is H&E stain of adenocarcinoma (original magnification, ×100), where giant cells are observed at interface between nodule and normal lung. D, Shape of entire benign nodule.
By using these top 12 features, highest AUC on the test set of 0.74 (95% confidence interval [CI]: 0.57, 0.90) was obtained by using the support vector machine classifier with a linear kernel. The other performance metrics were accuracy of 68%, sensitivity of 77%, and specificity of 63% at the operating point on the receiver operating characteristic curve (see Fig E6 [online]). Table 2 lists the AUCs of the other classifiers. The classification ability of intranodular radiomic features alone has been reported in section 5 of Appendix E1 and Figure E3 (both online).
Table 2:
AUC Values Obtained on the Training and Independent Test Set by Using Different Classifiers to Distinguish Adenocarcinomas from Granulomas on CT Images
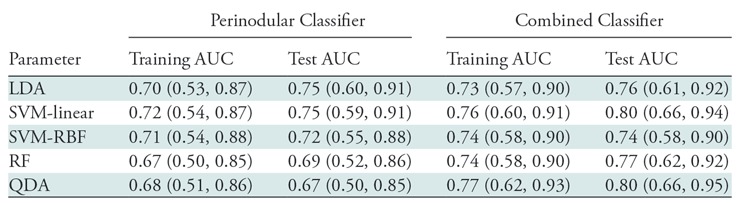
Note.— Combined classifier includes intranodular, perinodular, and shape features. Data in parentheses are 95% confidence intervals. Best performance on the independent test set was obtained by using the combined features from the nodule and its immediate parenchyma within a radial distance of 5 mm. Support vector machine (SVM) classifier with a linear kernel obtained a test area under the curve (AUC) of 80.02. LDA = linear discriminant analysis, RBF = radial basis function, RF = random forest, QDA = quadratic discriminant analysis.
Combined Radiomics (Intranodular and Perinodular Texture Features) to Distinguish Adenocarcinomas from Granulomas
The top 12 radiomic features obtained from the training set are listed in Table 1. Three features were from the perinodular distance of 5 mm outside the tumor, where midfrequency Gabor features were prominent in granulomas. The remaining nine features were picked from the intranodular region, where seven high-frequency Gabor filters were expressed higher in the granulomas when compared with adenocarcinomas. Additionally, three Laws energy features from the intra- and perinodular regions identified microstructure characteristics of wavelike patterns and edge enhancement in the adenocarcinomas (Fig E5 [online]). Interestingly, none of the shape attributes of the nodule were selected.
In a supervised setting, AUC of 0.80 (95% CI: 0.65, 0.94) was obtained on the test set by using support vector machine classifier with a linear kernel. This classifier yielded an accuracy of 0.71 (sensitivity of 74% and specificity of 68%). When unsupervised hierarchical clustering was implemented on the test set, accuracy of 69% was observed with sensitivity and specificity of 73% and 67%, respectively (Fig 6, A). This unsupervised clustering alternatively evaluated the combined features, where two distinct patient groups showed corroboration between the combined features and pathologic diagnosis.
Figure 6:

A, Graph shows unsupervised hierarchal clustering of intranodular and perinodular radiomic features. The x-axis represents top 12 features where (P) denotes a perinodular feature; y-axis represents independent test set of patients (n = 145). Dendrogram highlighted in red represents prominent cluster of adenocarcinomas. B, First row shows noncontrast baseline lung CT scans (axial view) of granuloma nodule in an 81-year-old man from independent test set, which was diagnosed as “mostly malignant” by both expert readers (score of 4). Radiomic heat map represents Laws energy feature inside nodule and also low expression of high-frequency Gabor response captured in perinodular region of 0–5 mm outside nodule. Second row shows noncontrast baseline lung CT scans (axial view) from independent test set of adenocarcinoma nodule in a 63-year-old woman from independent test set, which was diagnosed as a “mostly benign” granuloma by expert reader 1 (score of 2) and “not sure” by expert reader 2 (score of 3). Radiomic heat map represents Laws energy feature inside nodule and also high expression of low-frequency Gabor response (f = 8) captured in perinodular region of 0–5 mm outside nodule. These cases were correctly classified by linear support vector machine classifier that was trained.
Comparative Deep Learning Model and Multireader Study
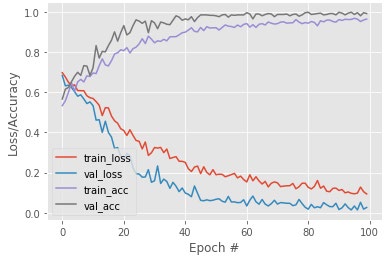
The CNN model was trained over 100 epochs after which the weights were locked down for testing (section 6 of Appendix E1 and Fig E8 [both online]). Weights learned from the training phase were then used on the same independent test set, and predicted probabilities were used to obtain AUC of 0.76 (95% CI: 0.60, 0.92) with sensitivity and specificity of 72% and 76%, respectively.
For the multireader study, reader scores were mapped to a classifier probability measure (score 1 of “benign,” −0.20; score 2 of “mostly benign,” −0.40; score 3 of “not sure,” −0.60; score 4 of “mostly malignant,” −0.80; and score 5 of “malignant,” −1). Readers achieved AUCs of 0.61 and 0.60, respectively. Details of human machine comparison are provided in Table E4 of Appendix E1 (online).
Influence of Clinical Parameters, CT Image Acquisition, and Manual Nodule Segmentation
The clinical parameters of smoking status and age were the only patient factors that were found to be significantly different between the two nodule classes (as shown in Table 3). The influence of reconstruction kernel on CT radiomics has been demonstrated by several groups (25), and therefore precaution was taken to maintain a class balance of reconstruction kernels in both the training and test set (Table E1 [online]). Furthermore, trained classifier (n = 145) was independently validated to assess CT manufacturer, section thickness, and type of CT image (diagnostic or screening). Table 4 lists the AUC values for these parameters. The classifier yielded an AUC of 0.82 (95% CI: 0.64, 0.99) and 0.72 (95% CI: 0.43, 0.99) with Siemens (n = 85) and Philips (n = 58) scanners, respectively. The highest AUC of 0.75 (95% CI: 0.56, 0.93) was obtained on diagnostic images with smaller section thickness (≤3 mm). Last, it was found that the top-performing radiomic features are largely resilient to variations as a result of reader segmentations (section 4 of Appendix E1 and Fig E2 [both online]).
Table 3:
Statistical Significance Testing between Patients’ Parameters and Disease Outcome for Both Training and Test Cohorts
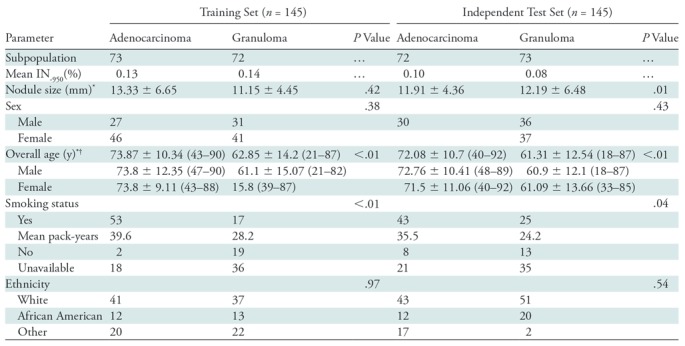
Note.—Unless otherwise specified, data are the number of patients. Smoking status and age were the only patient factors that were found to be significantly different between the two nodule classes. P values were computed by using Student t test for continuous variable and Fisher exact test for categorical data. IN−950 = percentage of lung less than 950 HU, SD = standard deviation.
*Data are means ± standard deviation.
†Data in parentheses are ranges.
Table 4:
Effect of Vendor, Section Thickness, and Type of CT Image in Distinguishing Adenocarcinomas from Granulomas
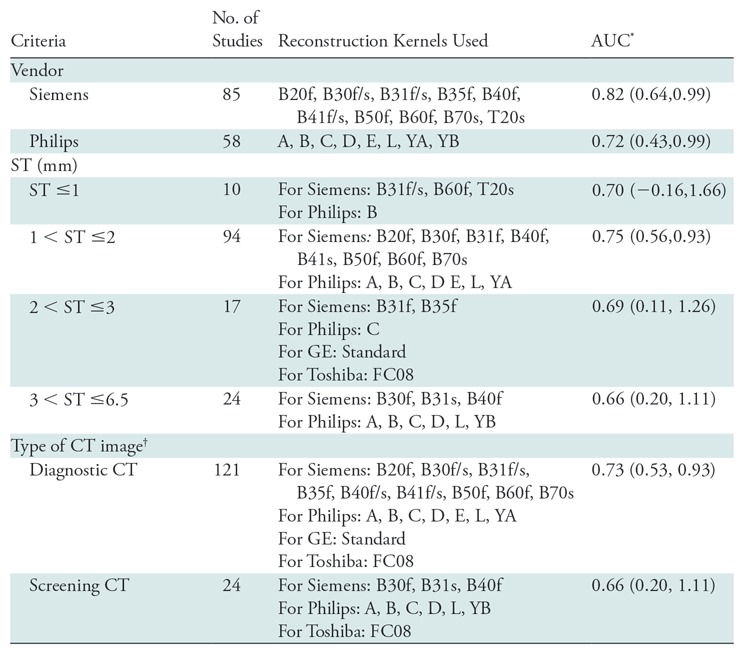
Note.—The classifier was trained on the training set (n = 145) by using intranodular and perinodular features together and tested (n = 145) on the various subsets of the test set based on the vendor, section thickness criteria, and type of CT image. Increasing section thickness (ST) was accompanied by a decrease in area under the curve (AUC) for the discrimination of benign (granulomas) from malignant (adenocarcinomas) lung nodules at noncontrast CT chest examinations, and additionally it was found that diagnostic images were more accurate in distinguishing adenocarcinomas from granulomas. Large variation in confidence intervals (CIs) can be attributed to the effect of various other image acquisition parameters (eg, reconstruction kernel and manufacturer) when controlled for one (eg, section thickness).
*Data in parentheses are 95% CIs.
†Diagnostic scans were defined as CT images with section thickness less than or equal to 3 mm and screening scans were defined as CT images with section thickness greater than 3 mm.
Discussion
In this study, we investigated the ability of radiomic features extracted from intra- and perinodular regions of lung nodules on CT images to distinguish adenocarcinomas from granulomas.
We found that in the immediate vicinity of 5 mm outside the tumor, low and middle frequencies of Gabor filters had a higher response in adenocarcinomas. In the representative hematoxylin and eosin–stained images, interface of the tumor had a “rim” of densely packed tumor-infiltrating lymphocytes and tumor-associated macrophages. At a macroscopic scale, the densely packed stromal tumor-infiltrating lymphocytes around adenocarcinomas manifest as smooth texture on CT images and potentially results in high expression of low-frequency Gabor filters. Similarly, Laws energy features detected heterogeneous patterns of spots in adenocarcinomas, potentially detecting higher presence of tumor-infiltrating lymphocytes. At the interface of granuloma and normal lung, histiocytes and macrophages formed giant cells that had elongated or spindle-shaped nuclei that were roughly parallel to each other. At a macroscopic level on CT images, this scattered appearance of giant cells could possibly explain the higher expression of midfrequency Gabor features. On evaluating the intranodular region, we found low-frequency Gabor features that were expressed higher in adenocarcinomas, potentially reflecting high nucleus-to-cytoplasm ratio. Similarly, low nucleus-to-cytoplasm ratio in granulomas might explain the more diffuse edges and blurry spotlike patterns that are captured by high-frequency Gabor features. Our findings are in consensus with Braman et al (26), who reported that the peritumoral microenvironment immediately surrounding a breast malignancy is related to disease aggressiveness and can be predictive of treatment response.
The majority of radiomic approaches used in lung cancer have focused solely on malignant lung nodule texture analysis and shape features from noncontrast CT examinations (13,21,27–30). To specifically distinguish adenocarcinoma from granulomatous, a study (13) used an intranodular radiomics-based approach with only Haralick features to obtain sensitivity of 88%. However, the data set consisted of only 55 nodules from a single site and their model was not validated on an independent set. Alilou et al (16) showed that shape-based features (such as roughness, convexity, and sphericity) were able to distinguish adenocarcinomas from granulomas with an AUC of 0.72 on an independent test set of 67 patients. Unlike previously reported methods (16,18), our feature selection method did not choose shape-based features over the intranodular and perinodular texture features, indicating that computer-extracted perinodular texture features are more predictive of malignancy than the shape attributes of any given nodule.
The majority of CNN approaches outperform the traditional radiomic-based approaches (11,12), but these algorithms are limited in their explanatory capacity of the deep features with neither a set of diagnostic rules nor an insight into the results (31). Our CNN result was comparable to the machine learning algorithm developed with intra- and perinodular features combined. However, despite the hyperparameter optimization, the results of the CNN might be affected by the training sample size.
The retrospective design of our cohort was restricted to only adenocarcinomas and granulomas and currently mimics the high possibility of a real clinical dilemma, especially in the Ohio River Valley or the upper Midwest region of the United States (32,33). Further work is needed to focus on incorporating other benign and malignant nodules into the classifier and validating it on a larger multisite data set. Multiple groups have reported the inclusion of qualitative semantic features such as nodule location, cavitation, and calcification (5,34,35). Hence, additional work is required to integrate these radiologist-crafted features to analyze their importance in our cohort. Additionally, our study extracted only two-dimensional texture features from the largest representative slice, but we plan to incorporate three-dimensional texture features. Future directions also include a more comprehensive analysis of differences in training model as a function of image acquisition parameters to determine if the intranodular and perinodular features will change with varying section thickness and reconstruction kernels.
Furthermore, our study included screening as well as diagnostic images. To deploy a computer-assisted lung cancer screening tool, we must explicitly develop a machine learning model that is trained on only screening CT images. Last, clinical translation as a cancer screening tool will require careful planning to integrate the human and machine interpretations together in decision support mode.
In conclusion, we introduced a machine learning approach that demonstrates the utility of combining texture features of a nodule and its immediate surrounding lung parenchyma at noncontrast chest CT imaging to discriminate malignant and benign nodules. Incorporation of perinodular texture features with intranodular texture improved the predictive ability of the classifier to distinguish adenocarcinomas from granulomas.
APPENDIX
SUPPLEMENTAL FIGURES
From the 2016 RSNA Annual Meeting.
Research reported in this publication was supported by the National Cancer Institute of the National Institutes of Health under award numbers U24CA199374-01, R01CA202752-01A1, R01CA208236-01A1, R01 CA216579-01A1, and R01 CA220581-01A1; the National Center for Research Resources under award number C06 RR12463-01; the U.S. Department of Defense (DOD) Prostate Cancer Idea Development Award; the DOD Lung Cancer Idea Development Award; the DOD Peer Reviewed Cancer Research Program (W81XWH-16-1-0329); the Ohio Third Frontier Technology Validation Fund; the Wallace H. Coulter Foundation Program in the Department of Biomedical Engineering; and the Clinical and Translational Science Award Program (CTSA) at Case Western Reserve University
The content is solely the responsibility of the authors and does not necessarily represent the official views of the National Institutes of Health.
Disclosures of Conflicts of Interest: N. Beig disclosed no relevant relationships. M.K. disclosed no relevant relationships. M.A. disclosed no relevant relationships. P.P. disclosed no relevant relationships. N. Braman Activities related to the present article: disclosed no relevant relationships. Activities not related to the present article: was employed by IBM Research; author and institution received payment from the National Cancer Institute of the National Institutes of Health for predoctoral training grant. Other relationships: author has patents/patents pending. M.O. disclosed no relevant relationships. S.R. disclosed no relevant relationships. K.B. disclosed no relevant relationships. P.R. disclosed no relevant relationships. J.G. disclosed no relevant relationships. C.D. disclosed no relevant relationships. R.T. disclosed no relevant relationships. M.Y. disclosed no relevant relationships. F.J. disclosed no relevant relationships. P.T. disclosed no relevant relationships. V.V. Activities related to the present article: disclosed no relevant relationships. Activities not related to the present article: is a consultant for AstraZeneca, Bristol-Myers Squibb, Foundation Medicine, Genentech, Merck, Novartis, and Takeda. Other relationships: disclosed no relevant relationships. R.G. disclosed no relevant relationships. P.L. disclosed no relevant relationships. A.M. Activities related to the present article: is member of advisory board and consultant for Inspirata; has grants/grants pending with Inspirata and Philips; institution has patents/patents pending; has received royalties from technologies licensed by Elucid Bioimaging and Inspirata from Rutgers University and Case Western Reserve University, respectively; holds stock/stock options in Elucid Bioimaging and Inspirata. Other relationships: has patents/patents pending.
Abbreviations:
- AUC
- area under the receiver operating characteristic curve
- CI
- confidence interval
- CNN
- convolution neural network
References
- 1.Dela Cruz CS, Tanoue LT, Matthay RA. Lung cancer: epidemiology, etiology, and prevention. Clin Chest Med 2011;32(4):605–644. [DOI] [PMC free article] [PubMed] [Google Scholar]
- 2.Subramanian J, Govindan R. Lung cancer in never smokers: a review. J Clin Oncol 2007;25(5):561–570. [DOI] [PubMed] [Google Scholar]
- 3.Starnes SL, Reed MF, Meyer CA, et al. Can lung cancer screening by computed tomography be effective in areas with endemic histoplasmosis? J Thorac Cardiovasc Surg 2011;141(3):688–693. [DOI] [PubMed] [Google Scholar]
- 4.Ambrosini V, Nicolini S, Caroli P, et al. PET/CT imaging in different types of lung cancer: an overview. Eur J Radiol 2012;81(5):988–1001. [DOI] [PubMed] [Google Scholar]
- 5.Gillies RJ, Kinahan PE, Hricak H. Radiomics: images are more than pictures, they are data. Radiology 2016;278(2):563–577. [DOI] [PMC free article] [PubMed] [Google Scholar]
- 6.Parmar C, Grossmann P, Bussink J, Lambin P, Aerts HJ. Machine learning methods for quantitative radiomic biomarkers. Sci Rep 2015;5(1):13087. [DOI] [PMC free article] [PubMed] [Google Scholar]
- 7.Thawani R, McLane M, Beig N, et al. Radiomics and radiogenomics in lung cancer: a review for the clinician. Lung Cancer 2018;115:34–41. [DOI] [PubMed] [Google Scholar]
- 8.Chen CH, Chang CK, Tu CY, et al. Radiomic features analysis in computed tomography images of lung nodule classification. PLoS One 2018;13(2):e0192002. [DOI] [PMC free article] [PubMed] [Google Scholar]
- 9.Hawkins S, Wang H, Liu Y, et al. Predicting malignant nodules from screening CT scans. J Thorac Oncol 2016;11(12):2120–2128 [Published correction appears in J Thorac Oncol 2018;13(2):280–281.]. [DOI] [PMC free article] [PubMed] [Google Scholar]
- 10.Siegelman SS, Zerhouni EA, Leo FP, Khouri NF, Stitik FP. CT of the solitary pulmonary nodule. AJR Am J Roentgenol 1980;135(1):1–13. [DOI] [PubMed] [Google Scholar]
- 11.Jin H, Li Z, Tong R, Lin L. A deep 3D residual CNN for false-positive reduction in pulmonary nodule detection. Med Phys 2018;45(5):2097–2107. [DOI] [PubMed] [Google Scholar]
- 12.Kang G, Liu K, Hou B, Zhang N. 3D multi-view convolutional neural networks for lung nodule classification. PLoS One 2017;12(11):e0188290. [DOI] [PMC free article] [PubMed] [Google Scholar]
- 13.Dennie C, Thornhill R, Sethi-Virmani V, et al. Role of quantitative computed tomography texture analysis in the differentiation of primary lung cancer and granulomatous nodules. Quant Imaging Med Surg 2016;6(1):6–15. [DOI] [PMC free article] [PubMed] [Google Scholar]
- 14.Dilger SK, Uthoff J, Judisch A, et al. Improved pulmonary nodule classification utilizing quantitative lung parenchyma features. J Med Imaging (Bellingham) 2015;2(4):041004. [DOI] [PMC free article] [PubMed] [Google Scholar]
- 15.Banat GA, Tretyn A, Pullamsetti SS, et al. Immune and inflammatory cell composition of human lung cancer stroma. PLoS One 2015;10(9):e0139073. [DOI] [PMC free article] [PubMed] [Google Scholar]
- 16.Alilou M, Beig N, Orooji M, et al. An integrated segmentation and shape-based classification scheme for distinguishing adenocarcinomas from granulomas on lung CT. Med Phys 2017;44(7):3556–3569. [DOI] [PMC free article] [PubMed] [Google Scholar]
- 17.Prasanna P, Tiwari P, Madabhushi A. Co-occurrence of Local Anisotropic Gradient Orientations (CoLlAGe): a new radiomics descriptor. Sci Rep 2016;6(1):37241. [DOI] [PMC free article] [PubMed] [Google Scholar]
- 18.Orooji M, Alilou M, Rakshit S, et al. Combination of computer extracted shape and texture features enables discrimination of granulomas from adenocarcinoma on chest computed tomography. J Med Imaging (Bellingham) 2018;5(2):024501. [DOI] [PMC free article] [PubMed] [Google Scholar]
- 19.Fedorov A, Beichel R, Kalpathy-Cramer J, et al. 3D slicer as an image computing platform for the Quantitative Imaging Network. Magn Reson Imaging 2012;30(9):1323–1341. [DOI] [PMC free article] [PubMed] [Google Scholar]
- 20.Yip SSF, Parmar C, Blezek D, et al. Application of the 3D slicer chest imaging platform segmentation algorithm for large lung nodule delineation. PLoS One 2017;12(6):e0178944. [DOI] [PMC free article] [PubMed] [Google Scholar]
- 21.Shen C, Liu Z, Guan M, et al. 2D and 3D CT radiomics features prognostic performance comparison in non-small cell lung cancer. Transl Oncol 2017;10(6):886–894. [DOI] [PMC free article] [PubMed] [Google Scholar]
- 22.Lecun Y, Bottou L, Bengio Y, Haffner P. Gradient-based learning applied to document recognition. Proc IEEE 1998;86(11):2278–2324. [Google Scholar]
- 23.Student. The Probable Error of a Mean. In: Kotz S, Johnson NL, eds. Breakthroughs in Statistics. Springer Series in Statistics (Perspectives in Statistics). New York, NY: Springer, 1992; 33–57. [Google Scholar]
- 24.Cortes C, Vapnik V. Support-vector networks. Mach Learn 1995;20(3):273–297. [Google Scholar]
- 25.He L, Huang Y, Ma Z, Liang C, Liang C, Liu Z. Effects of contrast-enhancement, reconstruction slice thickness and convolution kernel on the diagnostic performance of radiomics signature in solitary pulmonary nodule. Sci Rep 2016;6(1):34921. [DOI] [PMC free article] [PubMed] [Google Scholar]
- 26.Braman NM, Etesami M, Prasanna P, et al. Intratumoral and peritumoral radiomics for the pretreatment prediction of pathological complete response to neoadjuvant chemotherapy based on breast DCE-MRI. Breast Cancer Res 2017;19(1):57 [Published correction appears in Breast Cancer Res 2017;19(1):80.]. [DOI] [PMC free article] [PubMed] [Google Scholar]
- 27.Ganeshan B, Panayiotou E, Burnand K, Dizdarevic S, Miles K. Tumour heterogeneity in non-small cell lung carcinoma assessed by CT texture analysis: a potential marker of survival. Eur Radiol 2012;22(4):796–802. [DOI] [PubMed] [Google Scholar]
- 28.Coroller TP, Grossmann P, Hou Y, et al. CT-based radiomic signature predicts distant metastasis in lung adenocarcinoma. Radiother Oncol 2015;114(3):345–350. [DOI] [PMC free article] [PubMed] [Google Scholar]
- 29.Ravanelli M, Farina D, Morassi M, et al. Texture analysis of advanced non-small cell lung cancer (NSCLC) on contrast-enhanced computed tomography: prediction of the response to the first-line chemotherapy. Eur Radiol 2013;23(12):3450–3455. [DOI] [PubMed] [Google Scholar]
- 30.Zhao B, Tan Y, Tsai WY, et al. Reproducibility of radiomics for deciphering tumor phenotype with imaging. Sci Rep 2016;6(1):23428. [DOI] [PMC free article] [PubMed] [Google Scholar]
- 31.Shen D, Wu G, Suk HI. Deep learning in medical image analysis. Annu Rev Biomed Eng 2017;19(1):221–248. [DOI] [PMC free article] [PubMed] [Google Scholar]
- 32.Kibria R, Bari K, Ali SA, Barde CJ. “Ohio River valley fever” presenting as isolated granulomatous hepatitis: a case report. South Med J 2009;102(6):656–658. [DOI] [PubMed] [Google Scholar]
- 33.Deppen SA, Blume JD, Kensinger CD, et al. Accuracy of FDG-PET to diagnose lung cancer in areas with infectious lung disease: a meta-analysis. JAMA 2014;312(12):1227–1236. [DOI] [PMC free article] [PubMed] [Google Scholar]
- 34.Li Q, Kim J, Balagurunathan Y, et al. CT imaging features associated with recurrence in non-small cell lung cancer patients after stereotactic body radiotherapy. Radiat Oncol 2017;12(1):158. [DOI] [PMC free article] [PubMed] [Google Scholar]
- 35.Li Q, Balagurunathan Y, Liu Y, et al. comparison between radiological semantic features and lung-rads in predicting malignancy of screen-detected lung nodules in the National Lung Screening Trial. Clin Lung Cancer 2018;19(2):148–156.e3. [DOI] [PMC free article] [PubMed] [Google Scholar]
Associated Data
This section collects any data citations, data availability statements, or supplementary materials included in this article.