Abstract
Cardiovascular Magnetic Resonance (CMR) is a versatile tool that enables non-invasive characterization of cardiac tissue structure and function. Parametric mapping techniques have allowed unparalleled differentiation of pathophysiological differences in the myocardium such as the delineation of myocardial fibrosis, hemorrhage and edema. These methods are increasingly employed as part of a tool kit to better characterize disease states such as cardiomyopathies and coronary artery disease. Currently conventional mapping techniques require separate acquisitions for T1 and T2 mapping, the values of which may depend on specifics of the MRI system hardware, pulse sequence implementation and physiologic variables including blood pressure and heart rate. The cardiac Magnetic Resonance Fingerprinting (cMRF) technique has recently been introduced for simultaneous and reproducible measurement of T1 and T2 maps in a single scan. The potential for this technique to provide consistent tissue property values independent of variables including scanner, pulse sequence and physiology could allow an unbiased framework for the assessment of intrinsic properties of cardiac tissue including structure, perfusion and parameters such as extracellular volume (ECV) without the administration of exogenous contrast agent. This review seeks to introduce the basics of the cMRF technique, including pulse sequence design, dictionary generation, and pattern matching. The potential applications of cMRF in assessing diseases such as non-ischemic cardiomyopathy will also be briefly discussed, and ongoing areas of research described.
Keywords: MR fingerprinting, CMR, parametric mapping, T1 mapping, T2 mapping
Introduction
Cardiovascular Magnetic Resonance (CMR) is a valuable and versatile tool to characterize myocardial tissue and assess cardiac function non-invasively. Anatomical images acquired using FLASH (fast low angle shot) or SSFP (steady-state free precession) sequences are widely used to measure the chamber size, myocardial mass, and ejection fraction. Quantitative imaging can also be performed to provide T1 and T2 relaxation times that may shed light on intrinsic tissue properties. Such parametric maps have been shown to be more sensitive to a variety of pathological tissue changes than anatomical images (1–6). Changes in native myocardial T1 values for instance may reflect underlying pathological changes including infarction, inflammation and area at risk (4–6). Contrast-enhanced T1 measurements combined with native T1 mapping have been used to estimate extracellular volume fraction (ECV), which may change in the presence of diffuse fibrosis or deposition of amyloid fibrils that may be otherwise hard to detect or quantify (7–9). Myocardial T2 maps may provide information on myocardial edema (10,11) which may occur in the context of injury, infarction or inflammation (12,13). Furthermore, changes in T1 parameters in response to pharmacologic vasodilation without administration of contrast may allow non-contrast stress imaging (14).
In light of this unprecedented utility of T1 and T2 mapping for the non-invasive characterization of myocardial disease states, significant effort has been devoted to developing fast and accurate T1 and T2 mapping techniques. Most current techniques perform T1 and T2 mapping in separate scans, and the values in these maps may be dependent on field strength, pulse sequence and physiological parameters such as heart rate and blood pressure. Measuring T1 and T2 rapidly in an unbiased fashion during the same scan may provide distinct advantages compared to current approaches (15–18). Cardiac Magnetic Resonance Fingerprinting (cMRF) has recently been proposed to map multiple properties such as T1, T2, and proton density simultaneously in the heart (19). This technique is based on the general Magnetic Resonance Fingerprinting (MRF) framework, which was originally introduced to map tissue properties in the brain (20,21). cMRF has a number of features which make it advantageous over traditional T1 and T2 mapping techniques. For instance, many traditional mapping techniques require complete recovery or decay between imaging periods, and errors can arise when waiting periods are insufficient for complete relaxation (i.e. due to scan time or breath hold limitations). As cMRF does not rely on complete recovery of magnetization, it has the dual advantage of a shorter scan time as well as the potential to provide more accurate and reproducible T1 and T2 values. Second, cMRF is potentially immune to heart rate dependent bias which has been reported in cardiac T1 mapping methods such as MOLLI (22), because variations in heart rate are taken into account when extracting tissue property maps from cMRF data. Most importantly, MRF may be useful in characterizing tissue properties beyond T1 and T2, such as perfusion (23), diffusion (24), fat fraction (25), T2* (26,27), and ECV without the administration of exogenous contrast agents (28). Indeed, MRF can also be used to map system properties including B1 (29) and off-resonance (20), and this ability can be harnessed to remove the confounding effect of these system parameters on tissue parametric maps. cMRF thus has the potential to yield reproducible measurements of tissue properties independent of scanner, software and physiologic variables.
This review introduces the basic idea behind cMRF, including pulse sequence design, dictionary generation, and pattern matching. Experiments and results demonstrating the potential power of cMRF in phantoms and in vivo are described, and emerging techniques for further improving the speed, accuracy, and mapping capabilities of cMRF discussed. Finally, potential clinical applications of cMRF are briefly reviewed.
Current Approaches to Cardiac Tissue Parametric Mapping
In the heart, fast T1 mapping techniques commonly used in routine clinical exams such as MOLLI (22,30) and SASHA (31) generate T1 maps in a single breath-hold by acquiring a series of images following either an inversion or a saturation pulse (the function of which is to sensitize the signal to T1). ECG triggering is used to restrict the acquisition window to a short period, often in end diastole, to avoid artifacts due to cardiac motion. In the example of a commonly used variant of MOLLI, the so-called 5(3)3 version, an initial inversion pulse is applied, followed by the collection of five images in five separate heartbeats with different T1 weightings. The magnetization is allowed to recover in the following three heartbeats, and then a second inversion pulse is played out with image acquisition in the next three heartbeats. The result is a total of eight T1-weighted images, each at a different inversion time. The signal for each pixel over time from the series of images is then fit to an exponential function to estimate the T1 value. This fitting process is repeated for each pixel to generate a spatial map of estimated T1 values. Common T2 mapping techniques take a similar approach and use either a fast spin echo or gradient spin echo readout, or T2 preparation pulses followed by a gradient echo (bSSFP or FLASH) readout to generate images with different T2-weightings along the T2 decay curve. T2 maps are calculated by fitting the decay time courses for each pixel to an exponential function (32–34). These standard cardiac T1 and T2 mapping techniques rely on the assumption that acquired signals follow an exponential recovery (T1) or decay (T2) curve; however, incomplete longitudinal magnetization recovery due to a rapid or variable heart rate may cause deviations from the assumed exponential curve, leading to inaccuracies in the measured T1 or T2 maps (22,32). One potential solution to obtain T1 maps in the presence of heart rate variations is to model the deviation of the signal evolution from the expected exponential form using Bloch equation simulations (35); while this approach can provide improved T1 maps, the similarity of different exponential curves to one another may result in residual errors in the T1 maps. An additional drawback to conventional parametric mapping approaches is that it is challenging to generate images which are sensitive to only one tissue property a time. For instance, in T1 mapping, confounding factors including T2, off-resonance effects, and magnetization transfer (MT) can lead to errors in the resulting tissue parametric maps. Interested readers are referred to the following excellent review articles regarding the technical details and clinical applications of these methods (5,6,36,37).
In addition to mapping T1 or T2 separately, joint T1 and T2 mapping techniques have also been explored (15–18). These methods play out T1 preparation pulses (saturation or inversion) and T2 preparation pulses in either interleaved R-R intervals (15,17,18) or the same R-R interval (16) to sensitize signals to both T1 and T2 simultaneously. However, like MOLLI, most of these methods are still limited by the reliance on a simple signal model (such as an exponential form), which constrains the type of pulse sequences which can be used and introduces errors when the acquisition timing is variable (i.e. due to heart rate changes) (15,18).
MRF Basics
MRF takes a radically different approach to parametric mapping compared to the traditional methods discussed above. In MRF, a pulse sequence with variable sequence timings and/or RF strengths is used which sensitizes the signal to multiple tissue properties simultaneously. The goal of the MRF pulse sequence is to force tissues with different tissue properties, i.e. T1 and T2 values, to produce distinguishable signals. In other words, the signal time courses from different tissues should be unique due to differences in their T1 and/or T2 values.
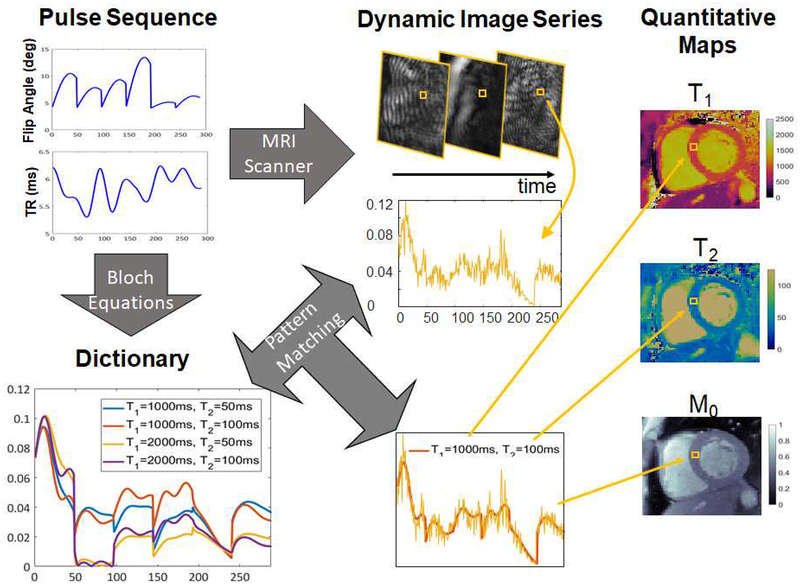
Data are first collected using a pulse sequence designed to impart unique signal time courses to tissues with different T1 and T2 values. Following data collection, the next step is to link the signal time courses for each pixel to the appropriate T1 or T2 values. In MRF, this step is often performed using a dictionary matching technique. First, a discrete set of possible T1 and T2 values is selected that covers the range of relaxation times that are typically found in vivo. For each pair of T1 and T2 values, the signal time course that would result from the application of the MRF pulse sequence is calculated using the Bloch equations (the equations which dictate the behavior of MRI signals as a function of the sequence parameters, timing, and tissue properties). Each time course is saved to make a dictionary of the possible signal evolutions that could have resulted from the applied pulse sequence. Finally, the measured signal time course for each pixel is compared to the dictionary; the T1 and T2 values used to make the dictionary entry that best fits the measured data are assigned as the T1 and T2 values for that pixel. When this process is repeated for each pixel, the results are quantitative maps showing the T1 and T2 values for each pixel (Figure 1).
Figure 1. MRF workflow.
A pulse sequence with varying acquisition settings, such as flip angles and TRs, is used to acquire a series of highly accelerated images at the MRI scanner. A dictionary is generated covering a representative set of possible signal time courses that could result given the sequence employed. The actual signal time course at each pixel obtained from the accelerated image series is matched to the dictionary to find the best fit in the dictionary. The T1 and T2 values corresponding to that best fit are used as the quantitative values for that pixel.
MRF for Cardiac Tissue Characterization
Although previous work has demonstrated the accuracy and efficiency of MRF in stationary organs such as the brain and prostate (20,21,38), the use of MRF for parametric mapping in the heart is more challenging given cardiac and respiratory motion. In order to reduce motion artifacts, data are acquired during end-diastole with ECG triggering and during a single breath-hold. Thus, unlike in conventional MRF where the pulse sequence is played out continuously, signal encoding and data acquisition are interrupted in cMRF. As a consequence of this “dead time”, the time courses of tissues with similar T1 and T2 values may be more difficult to differentiate than when using a continuous pulse sequence. To address this challenge, more preparation modules are employed in cMRF to encode T1 and T2 information as compared to the original MRF techniques used in stationary organs. Another result of the interrupted pulse sequence is that the exact timing of each cMRF sequence will change, depending on the subject’s heart rate, and thus a new cMRF dictionary with the appropriate timings must be generated following each scan. Finally, the total data collection time in a cMRF scan is limited to the length of a breath-hold, and thus the pulse sequence must enable the collection of as much signal as possible while also differentiating between different tissues.
Pulse sequence
In order to mitigate artifacts caused by respiratory and cardiac motion, the cMRF pulse sequence is designed to acquire data at end-diastole during a breath-hold. While several different cMRF variants have been employed, the longest sequence (and thus the longest breath-hold) has been limited to 16 heartbeats (19). The cMRF pulse sequences used to date employ a FISP (fast imaging with free precession) readout with no RF phase cycling, instead of the originally proposed bSSFP readout. Unlike the bSSFP readout, FISP uses an unbalanced spoiler gradient in the slice select direction, making this sequence relatively insensitive to off-resonance effects. In cMRF, data are collected in a specified window (between 120–250ms) during diastole to avoid artifacts due to cardiac motion. The number of data collection phases in a single heartbeat is designed such that the total acquisition time (TR × data collection phases) is less than this specified acquisition window. In each data collection phase, lasting one TR, one interleaf of a variable density spiral trajectory is used to acquire data. The spiral interleaf is rotated by the golden angle (111°) in each data collection phase to ensure that the aliasing artifacts from undersampling take on a noise-like appearance in the signal time course, facilitating the pattern matching step to find the correct T1 and T2 values.
The data collection for the original implementation of cMRF (19) is performed over 16 heartbeats, divided into four segments of four heartbeats each (Figure 2). In each segment, a specific pattern of magnetization preparation pulses is performed to improve the sensitivity of the sequence to T1 and T2. A non-selective inversion pulse is applied in the first heartbeat, and T2-preparation pulses with echo times of 40 ms and 80 ms are employed in the third and fourth heartbeats. No magnetization preparation is used in the second heartbeat. This 4-heartbeat pattern is repeated four times, where the inversion times used in the first heartbeat of the segments vary from 21 to 400 ms. If the subject’s heart rate is too fast for the longest inversion time to fit within one cardiac cycle, then the inversion times are shortened. Sinusoidally varying flip angles and variable TRs of 5.1 to 6.1 ms are used.
Figure 2. Diagram of the 16-heartbeat cMRF pulse sequence.
Trigger delay, preparation pulses, and acquisition window are shown for the first four heartbeats.
One advantage of the MRF framework is the extreme flexibility in pulse sequence design. As long as a pulse sequence causes different tissues to exhibit signal time courses that are distinguishable, it can be used for MRF; given the same sensitivity to confounding factors, the T1 and T2 measurements made with one sequence should be reproducible with other embodiments of MRF. Ideally, MRF signal time courses are only governed by tissue properties such as T1 and T2 in a given pulse sequence. However, changes in physiological properties which the user may not anticipate, such as heart rate or blood pressure, may influence the signal time course and act as confounding factors. Ideally, the pulse sequence should be designed to avoid sensitivity to these confounding factors or enhance it, such that it can be mapped along with the desired tissue properties. Additionally, other system errors such as imperfect slice profile and B1+ inhomogeneity, may cause the acquired signal time courses to deviate from the ideal case.
Since the original implementation of cMRF was proposed, other pulse sequence designs have been considered to accelerate the measurement of T1 and T2 in the myocardium and reduce errors due to confounding factors. Based on this work (39), it has been found that minor alterations to the timing and number of preparation pulses do not significantly impact the measurements made with cMRF. However, these pulse sequences, when used in phantom and in vivo experiments, may result in inaccurate T1 and T2 maps if the appropriate confounding factors are not taken into account (see Dictionary Generation, below). Importantly, many pulse sequences offer equivalent encoding power and insensitivity to confounding factors, and some offer supplementary benefits. For instance, in addition to the 16 heartbeat, 4-segment scheme described in the original cMRF sequence, a 15-heartbeat, 5-segment scheme has also been tested; this 5-segment schedule may be advantageous because it can be easily shortened to a 5-heartbeat scan (see below). In this 15-heartbeat, 5-segment scheme, T2-preparation pulses were employed in the third, fourth, and fifth heartbeats in each segment with echo times of 30 ms, 50 ms, and 80 ms. Data are collected with a constant TR of 5.1 ms and ramped flip angles between 4° to 25° are used. Both the 16-heartbeat sequence and the 15-heartbeat sequence show good agreement in vivo with conventional cardiac T1 and T2 measurements; however, it should be noted that there are numerous options for possible sequences besides these two examples. The optimal implementation may not be limited to a certain sequence type, and may depend on the specific application (i.e. sequences optimal for patients with arrhythmias may differ dramatically from those optimal for bradycardia).
Dictionary generation
The dictionary is a lookup table that contains a representative set of the possible signal time courses that could result from the specific pulse sequence applied. It is generated by specifying ranges for the T1 and T2 values which could appear in the tissue and using the Bloch equations to calculate the signal time course for each combination of T1 and T2.
The spacing of T1 and T2 values for which time courses are calculated determines the size of the MRF dictionary, which can grow to be quite large if the dictionary resolution is fine. Resolutions of 5~10 ms for T1 (in the range between 50 and 5000 ms) and 2~5 ms for T2 in the range between 6 and 500 ms, are used to ensure that the dictionary can be stored and accessed (19). Values of T2 longer than T1 are excluded from the dictionary because they are physically unrealistic; further exclusion of other unlikely combinations could also be performed to reduce the dictionary size, but such exclusion is not generally performed in practice. Another method to reduce the dictionary size is to compress the dictionary either along the time dimension or across the tissue property space. Low rank approximation methods such as randomized singular value decomposition and dictionary fitting methods also may significantly reduce the memory requirement for dictionary storage (40), and may be used to improve the dictionary resolution.
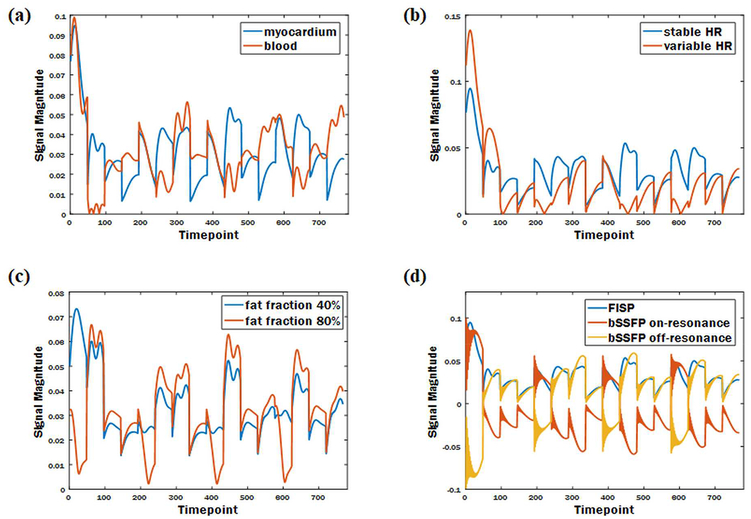
In previous MRF work in stationary organs, the dictionary is calculated once, and applied to all subsequent scans because the timing of the sequence is fixed for all subjects. However, cMRF requires a different dictionary for every scan because the timing between heartbeats can and will change for each subject and during the course of the cMRF scan. Even slight changes in heart rate, and thus slightly different pulse sequence timings, may cause the same tissue to exhibit a different signal time course. Thus, for each scan, the precise sequence timing is recorded and employed when calculating the signal time courses in the dictionary. While this calculation requires additional time and computation power after each scan, it is advantageous as cMRF may not suffer from heart rate dependence in the measurement of relaxation times, and could be used even for patients with arrhythmias. Figure 3 shows examples of signal time courses affected by heart rate, and other factors including tissue composition, fat fraction, and sequence variant.
Figure 3. Example simulated signals demonstrating how different conditions lead to unique signal time courses.
Signal time courses affected by tissue composition (a); heart rate (b); fat fraction (c); sequence variant (d).
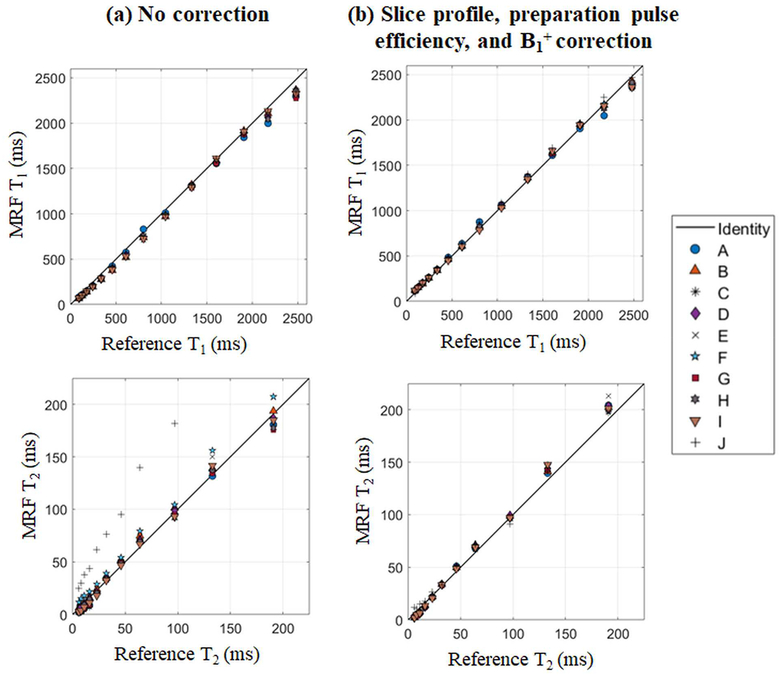
As described above, the ideal cMRF sequence is sensitive only to the tissue properties to be mapped, and insensitive to all other physiological or system properties. However, this may not be the case for all pulse sequences, and the signal time courses may be affected by additional confounding factors. In order to improve the accuracy of the maps generated using cMRF, these confounding factors can be taken into account in dictionary generation. In particular, slice profile imperfection, preparation pulse efficiency, and B1+ errors have been found to affect cMRF pulse sequences. Corrections to the dictionary which model these effects have been examined using the ISMRM/NIST MRI system phantom for several possible versions of cMRF pulse sequences (39). Measured T1 and T2 values in the phantom with the above corrections show a better agreement with the true values compared to those without corrections (Figure 4). More importantly, the consistency between different cMRF sequences in T1 and T2 measurements (especially T2) are significantly improved after applying these corrections; this result is expected and reassuring, as the T1 and T2 measured in this phantom should not depend on the specific pulse sequence used. However, the use of more accurate dictionaries comes with a price: computation time. The time required to generate the dictionary without any confounding factor corrections is approximately 12s on a standalone PC using optimized MATLAB code. The dictionary that incorporates all three corrections took approximately 60 minutes to generate on a high-performance cluster with 168 nodes. Given the fact that of the many sequences appropriate for cMRF, some are less sensitive to these confounding factors, it is recommended that a cMRF implementation which requires the fewest corrections be employed. In cases where system properties must be taken into account for accurate tissue parametric mapping, the full dictionary calculation including confounding factors can be performed.
Figure 4. cMRF measurements vs. ISMRM/NIST reference in phantom experiments.
The cMRF dictionary was simulated using (a) no corrections and (b) slice profile, preparation pulses efficiency, and B1+ corrections.
Pattern matching
Once the data have been collected and an appropriate dictionary calculated, the next step is to compare the acquired signal to the dictionary entries to find the best match. Several matching algorithms have been employed for cMRF. In the original cMRF work, a simple correlation calculation was used for matching, but recent developments have suggested that the use of sparse iterative (41,42) or low rank reconstructions (43,44) may provide better accuracy and precision or allow for shorter scan times.
In the simplest matching approach, the best match is selected by calculating the similarity between the acquired signal time course for a pixel and all the dictionary entries (calculating the correlation mathematically). Because the dictionary time courses and measured signals may be scaled differently, they are both normalized to have the same scale before computing the correlation. The dictionary entry with the highest correlation value is selected as the best match, and the T1 and T2 values used to make that dictionary entry are assigned as the T1 and T2 values for that pixel. Proton density is calculated as the scaling factor between the measured signal time course and the selected dictionary entry. Quantitative maps are generated by applying the above procedures to all pixels in the images. Direct correlation-based matching is straightforward, rapid, and relatively easy to implement (20). However, pattern matching with large dictionaries can be time-consuming. Some dictionary compression methods have been developed recently to reduce the dictionary size and speed up pattern matching process without compromising image quality (40,45). While this direct approach is easy to understand and implement, more advanced methods including low rank reconstruction algorithms, are becoming more prevalent due to their ability to provide improved maps (43,44).
cMRF in Healthy Subjects
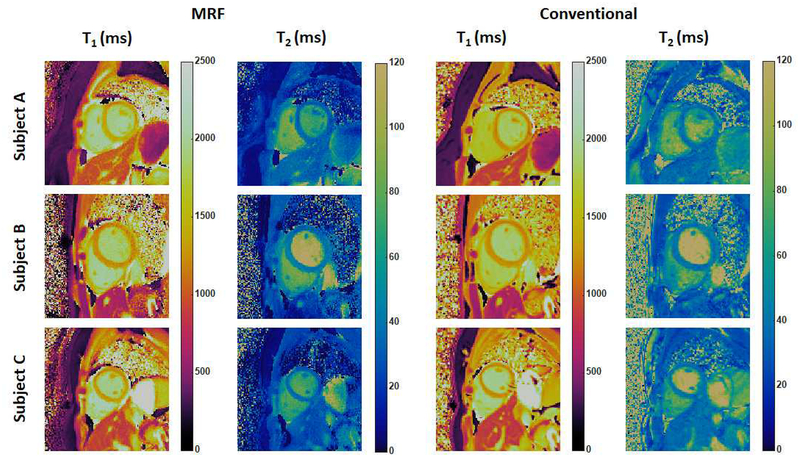
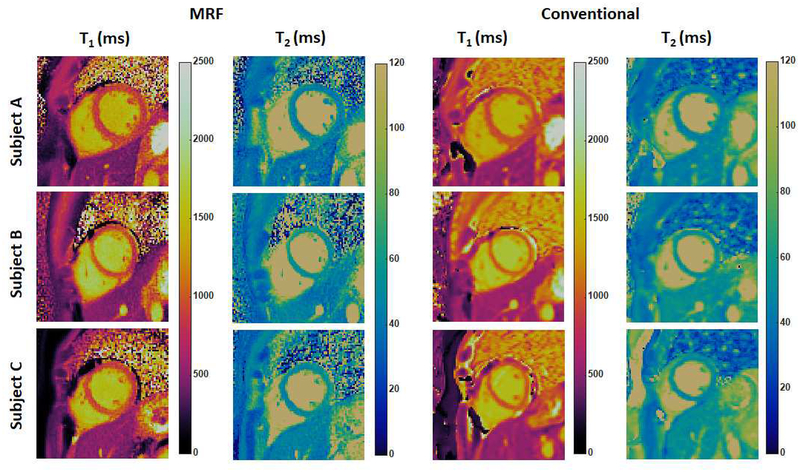
As part of the initial cMRF validation experiments in healthy subjects, T1 and T2 maps were acquired in eleven volunteers at 3T (Siemens MAGNETOM Skyra, Erlangen, Germany) using cMRF (the 16-hearbeat variant), MOLLI, and T2-prepared bSSFP. Figure 5 shows three examples of T1 and T2 maps acquired using cMRF compared with the MOLLI and bSSFP measurements (note that all T1 and T2 maps acquired using cMRF shown in this article have a spatial resolution of 1.6 × 1.6 mm2 and a slice thickness of 8 mm, and do not include corrections for confounding factors such as slice profile). The mean T1 value in the myocardium obtained by cMRF over all volunteers (1235 ms) agrees well with that measured using MOLLI (1247 ms) in this study, although both average values are slightly higher than literature MOLLI T1 measurements (1050~1150 ms) (22,46) and lower than SASHA T1 measurements reported in the literature (1487 ms) (31,47). The mean myocardial T2 value measured with cMRF (38 ms) also matched bSSFP measurements (38ms) and was comparable to previously reported values in the literature (17,48). It is important to note that the T1 and T2 maps generated in this study did not include slice profile or inversion or T2 preparation efficiency corrections, which were introduced only after the initial cMRF technique was reported, and thus the T1 values measured with cMRF in this study were likely underestimated. Additionally, relaxation times for the blood pool measured by cMRF may not be reliable, given that blood flow entering or leaving the imaging slice may result in a signal evolution different from simulations in the dictionary.
Figure 5. Representative cMRF maps in healthy subjects at 3T.
cMRF maps (collected with the 16-heartbeat pulse sequence) are compared with conventional T1 and T2 maps acquired using MOLLI and T2-prepared bSSFP sequence.
A significant challenge to clinical myocardial T1 and T2 mapping has been the lack of reproducibility in these measurements across MRI scanners. Indeed, experts agree that T1 values must be interpreted in the context of normative T1 values for the specific MRI scanner; different sequence versions, vendors, and software platforms can lead to the measurement of different T1 values (8). Because cMRF has the potential to take heart rate variations and any variable system properties into account, it is hypothesized that cMRF will allow more reproducible measurements of T1 and T2 in the heart. In order to determine the reproducibility of cMRF and potentially establish normative T1 and T2 values in the myocardium, 49 healthy subjects were recruited in an IRB-approved study at University Hospitals Cleveland Medical Center (UHCMC). The protocol involved collecting cMRF scans as well as scans from conventional T1 and T2 mapping methods (MOLLI and T2-prepared bSSFP) in three short axis slices at 1.5T (Siemens MAGNETOM Aera, Erlangen, Germany) (49). All cMRF scans were performed using the 15-heartbeat sequence within a breath-hold as described in the pulse sequence section. Figure 6 shows representative T1 and T2 maps in three healthy subjects obtained by cMRF and conventional methods. A Bland-Altman analysis shows systematic differences between cMRF and MOLLI T1 measurements as well as cMRF and T2-prepared bSSFP T2 measurements. In both cases, the cMRF measurements were lower than those derived from the standard techniques (on average ~20ms for T1 and ~5ms for T2) and the differences were statistically significant. All methods demonstrated fair to excellent repeatability in the measurements on mid-slice that was acquired twice during the scan, as well as comparable intra-reader agreement and inter-reader agreement between two independent readers. For each parametric map, image quality was evaluated on a 5-point Likert scale (1: worst visualization and most artifacts, 5: excellent). Oneway ANOVA analysis shows that cMRF maps were scored better than conventional T1 and T2 maps in all metrics by both raters, and this difference was statistically significant (p<0.05, with the exception of visibility of the RV in T2 maps). Two-alternative forced choice results also show that cMRF maps were preferred (p<0.05 in all cases). Work is underway to assess if T1 and T2 maps generated using cMRF are reproducible across MRI scanners. Research along these lines has been performed for brain and prostate MRF implementations, and excellent agreement has been found in both intra-scanner (50) and inter-scanner measurements on different continents (51).
Figure 6. Representative cMRF maps in healthy subjects at 1.5T.
cMRF maps (collected with the 15-heartbeat pulse sequence) are compared with conventional T1 and T2 maps acquired using MOLLI and T2-prepared bSSFP sequence.
Initial and Potential Applications of cMRF
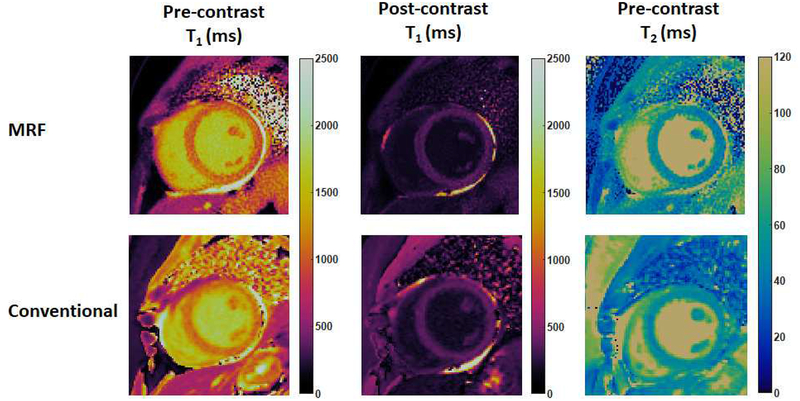
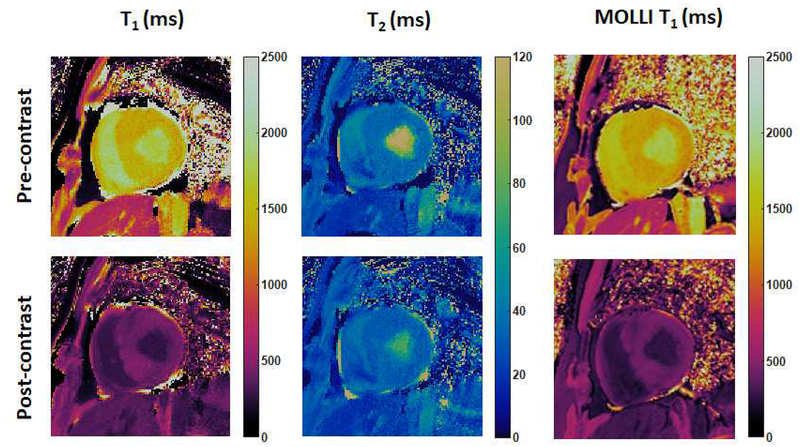
The first cMRF pilot patient study is currently ongoing and focuses on the use of cMRF for the assessment of non-ischemic cardiomyopathy. cMRF experiments were performed after written informed consent in this IRB-approved study on a 1.5T clinical scanner (Siemens MAGNETOM Aera, Erlangen, Germany) at UHCMC. Figure 7 shows an example of native T1, post-contrast T1, and native T2 maps acquired using the 15-heartbeat cMRF sequence compared with conventional T1 and T2 maps in a patient with non-ischemic dilated cardiomyopathy. Both image quality and measured relaxation times were comparable between cMRF and conventional approaches. Figure 8 shows an example of pre- and post-contrast cMRF T1 and T2 maps, and MOLLI T1 maps in a patient with asymmetrical septal hypertrophic cardiomyopathy, collected on a 3T scanner (Siemens MAGNETOM Skyra, Erlangen, Germany) at Toronto General Hospital. T1 values in the anteroseptal myocardial wall obtained by cMRF agreed well with MOLLI measurements both before (cMRF 1385 ± 69ms vs. MOLLI 1339 ± 43ms) and after (cMRF 403 ± 34ms vs. MOLLI 406 ± 28ms) contrast injection. Since T1 and T2 maps are acquired in a single breath-hold and generated from the same dataset, cMRF not only saves scan time, but also provides precise co-registration between the parametric maps, which may facilitate the diagnosis process and further evaluation using advanced processing techniques such as machine learning.
Figure 7. cMRF results in a patient with dilated cardiomyopathy at 1.5T.
cMRF maps (collected with the 15-heartbeat pulse sequence) are compared with conventional T1 and T2 maps acquired using MOLLI and T2-prepared bSSFP sequence.
Figure 8. cMRF results in a patient with hypertrophic cardiomyopathy at 3T.
cMRF maps were collected with the 15-heartbeat pulse sequence and compared with MOLLI T1 maps.
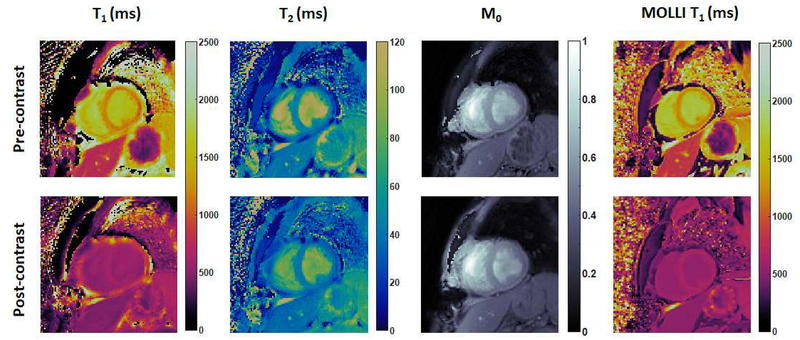
Additionally, cMRF has been applied in a small patient population of cardiac transplant recipients to characterize cardiac graft rejection non-invasively (52). Thirteen heart transplant recipients were recruited in an IRB-approved study at Lausanne University Hospital (CHUV) / University of Lausanne (UNIL). The 15-heartbeat cMRF sequence was used to acquire T1, T2 and proton density maps in addition to MOLLI T1 measurements on a 3T scanner (Siemens MAGNETOM Prisma, Erlangen, Germany). Figure 9 shows representative T1, T2, and proton density maps acquired using cMRF compared with MOLLI T1 maps in a heart transplant recipient both before and after contrast injection. Bland-Altman analysis shows good agreement between cMRF T1 measurements and T1 values obtained by MOLLI (52). This pilot study suggests the potential of cMRF for monitoring of cardiac health in a patient population such as heart transplant recipients.
Figure 9. cMRF results in heart transplant recipients at 3T.
cMRF maps were collected with the 15-heartbeat pulse sequence and compared with MOLLI T1 maps.
cMRF has a number of features which may enable its application in a variety of additional clinical contexts. Since a unique dictionary incorporating variations in heart rate is generated for each individual subject, cMRF may be suitable for evaluation of patients with arrhythmias or in generating reproducible measurements that reflect a change in intrinsic tissue properties that may occur with heart rate alterations. A distinct advantage of cMRF is the reliable measurement of tissue property values over a large range that may enable a more accurate reflection of the true spread of values in health and disease. This feature may allow depiction of subtle alterations associated with physiologic adaptations such as changes in heart rate and hemodynamics resulting from exercise or pharmacologic vasodilation, but also permit registration of changes seen with aging or early disease states such as diabetes, hypertension and heart failure (1,53,54).
Future Directions for cMRF
The ultimate goal of cMRF is to enable comprehensive and reproducible whole heart tissue parametric mapping with a rapid 3D free-breathing sequence. A number of technical advances are being explored to reach this goal.
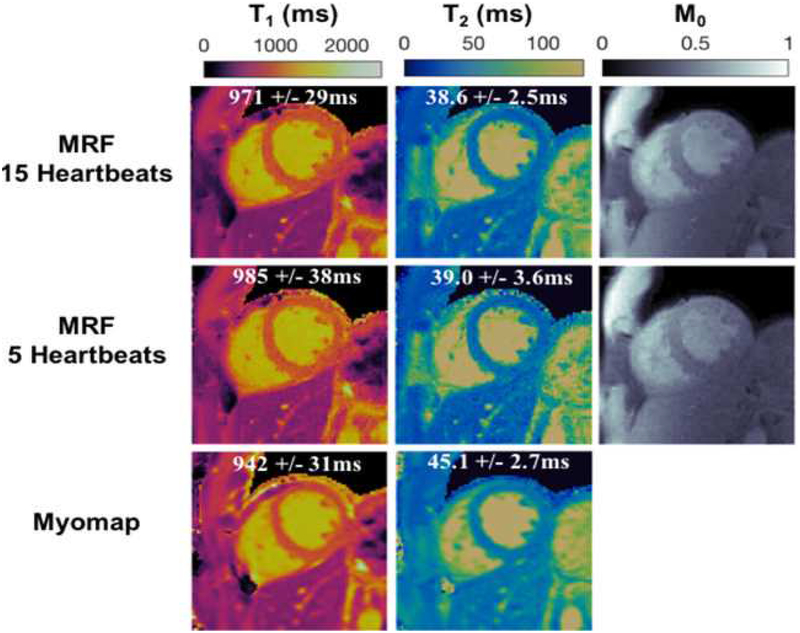
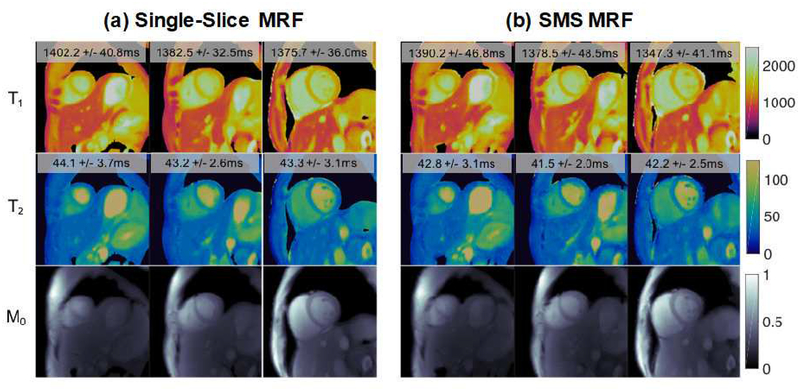
First, work is underway to increase the anatomical coverage and reduce the scan time required for cMRF. The current cMRF pulse sequence requires a 15-heartbeat breath-hold and employs an acquisition window of approximately 250ms at end-diastole to collect a single set of 2D parametric maps. The duration of breath-hold and acquisition window are appropriate for healthy volunteers but may be problematic for patients. Preliminary results have shown that it may be possible to reduce the cMRF scan time to 5 heartbeats (Figure 10) (55). Furthermore, a new version of cMRF sequence with shortened acquisition window (~150ms) is also under investigation to reduce artifacts due to cardiac motion; this approach may be especially useful when scanning patients with a high heart rate. Simultaneous multi-slice (SMS) cMRF has been developed to provide greater coverage within a single breath hold. Figure 11 shows representative T1, T2, and proton density maps from three slices collected simultaneously in a single 15-heartbeat breathhold from a healthy volunteer at 3T (Siemens MAGNETOM Skyra, Erlangen, Germany) using SMS cMRF. While SMS enables the collection of more slices, true 3D coverage is still preferable; such a 3D approach is currently being explored and may be invaluable in the assessment of T1/T2 changes over the whole heart in response to stress (vasodilator or exercise) that may allow evaluation of ischemia (14).
Figure 10. 5-heartbeat cMRF results at 1.5T.
T1, T2, and proton density (M0) maps acquired using a 15-heartbeat breath-hold (top row) cMRF sequence and a 5-heartbeat breath-hold (middle row) cMRF sequence compared with conventional T1 and T2 maps (bottom row).
Figure 11. SMS cMRF results at 3T.
Representative T1, T2, and proton density (M0) maps acquired using single-slice MRF in three separate breath-holds (a) and SMS cMRF maps collected in a single breath-hold (b). Low rank reconstruction was applied for both SMS and single-slice MRF.
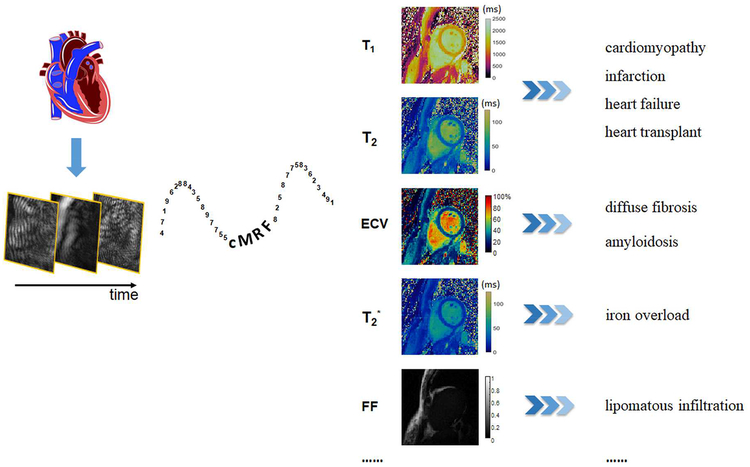
Secondly, the inclusion of additional tissue properties into the cMRF framework would enable complete tissue characterization in a single MRI scan and thus offer a full array of diagnostic information. In addition to T1 and T2, T2* and fat deposition are also valuable biomarkers for myocardial diseases. Recently, MRF pulse sequences have been developed to provide T2* maps and fat measurements in the brain (26,27) and in the heart (56). Such a cMRF pulse sequence could enable estimation of myocardial iron content and lipid deposition in addition to T1 and T2. cMRF thus has the potential to provide a diagnosis in a single scan instead of using separate scans to investigate specific disease states such as cardiomyopathies and hemochromatosis/iron overload. The inclusion of diffusion (24) and perfusion (23) may allow further disease stratification in a single simple MRI scan.
MRF may also offer a novel and fast approach to measure additional non-standard tissue properties, such as changes in water content and ECV without exogenous contrast agents. ECV is the fraction of extracellular space within a voxel of myocardium, and this measurement can be derived from native T1 and post-contrast T1 values (5). ECV has been shown to serve as a marker of diffuse myocardial fibrosis and may provide important information on the degree of interstitial expansion (36). Most conventional parametric mapping techniques, including cMRF to date, treat each voxel as homogeneous and generate one set of T1 and T2 values for each voxel. However, biological tissues contain multiple compartments, such as intracellular and extracellular space, with their own relaxation times, within one MRI voxel. A novel approach called MRF with Exchange (MRF-X) has been developed to quantify subvoxel relaxation times and relative volume fractions (similar to ECV) in a single scan (28). By incorporating the two-compartment exchange model into the Bloch equations (i.e. using the Bloch-McConnell equations instead of the Bloch equations), MRF-X may be used to measure T1 and T2 values within each compartment, the water exchange rate between the two compartments, and the volume fractions of each compartment. While early explorations of MRF-X have focused on brain specific applications, one of the most attractive applications of MRF-X is the estimation of ECV without administration of contrast agents. The large number of tissue properties that must be modeled and differentiated have slowed the progress of MRF-X in the heart for ECV mapping, but the basic ability of cMRF to capture multi-compartment information makes this a promising application for this technology.
The third goal is for cMRF to provide unbiased MRF measurements that are reproducible on all MRI scanners, regardless of institutions, vendors, and installations. Since system properties including B1 and off-resonance can also be mapped using MRF, the confounding effects of these system properties on tissue characterization could be potentially removed, leading to tissue property maps that do not differ when collected on a different MRI scanner. One open question is how to reduce the effect of MT on cMRF measurements. MT is an important factor that introduces bias in relaxation time measurements if it is not taken into account in sequence design. In inversion recovery T1 measurement methods, the MT effect is known to shorten the apparent T1 (36,57). MRF measurements of T1 and T2 values have been shown to be influenced by MT effects, and this bias caused by MT could be mitigated by incorporating a two-pool MT model into the dictionary and employing variable RF pulse durations in the acquisition (58). Note that MT effects are not accounted for in current cMRF sequences; therefore, a cMRF implementation which incorporates MT effects would be highly desirable and may yield more accurate and reproducible relaxation time measurements.
Once the appropriate confounding factors have been addressed, quantitative measurements acquired with cMRF in different places on different scanners would be comparable, and standard values of the quantitative parameters could be established across all institutions and hospitals. This aspect of cMRF is especially appealing in conjunction with the measurement of multiple tissue properties. Ideally, a database linking abnormal tissue property ranges to various disease states could be generated such that the make-up of the myocardial tissue for each patient could be characterized. In this way cMRF could fulfill the ultimate goal of quantitative MRI—complete tissue characterization in a non-invasive and cost-effective manner.
Conclusions
cMRF is a powerful tool to measure multiple tissue properties in the myocardium simultaneously and may allow seamless investigation of an array of myocardial diseases in a single scan. Optimization and improvements in pulse sequence design, confounding factor corrections, and pattern matching will enable precise unbiased measurements of T1 and T2 that are independent of current limitations in hardware and software which plague current parametric mapping approaches. Furthermore, mapping properties such as ECV, T2* and fat fraction could potentially be achieved in a single cMRF scan. Advanced techniques such as SMS cMRF, 5-heartbeat cMRF, or eventually whole-heart free-breathing 3D cMRF may significantly improve ability of physicians to evaluate the whole heart, moving closer to the ultimate goal of providing quantitative information to diagnose a variety of disease states and stratify disease severity.
Central Illustration. The potential of cMRF.
cMRF is a powerful tool to measure multiple tissue properties in the myocardium simultaneously, which may allow seamless investigation of an array of myocardial diseases.
Acknowledgements
The authors would like to thank Dr. Bernd Wintersperger and Dr. Andrew Coristine for providing cMRF data in patients, and Dr. Armando Cavallo, Dr. Shivani Pahwa, and Dr. Brendan Eck for critical review of the manuscript.
Funding sources: R01HL094557, R01DK098503, CBET 1553441, C06 RR12463–01. Disclosure of relationship with industry: our group receive financial support from Siemens Healthineers (Erlangen, Germany).
List of Abbreviations
- bSSFP
balanced steady-state free precession
- CMR
cardiovascular magnetic resonance
- cMRF
cardiac magnetic resonance fingerprinting
- ECV
extracellular volume fraction
- FISP
fast imaging with free precession
- FLASH
fast low angle shot
- MOLLI
modified Look-Locker inversion recovery
- MRF
magnetic resonance fingerprinting
- MT
magnetization transfer
- SASHA
saturation recovery single-shot acquisition
- SMS
simultaneous multi-slice
- SSFP
steady-state free precession
Footnotes
Publisher's Disclaimer: This is a PDF file of an unedited manuscript that has been accepted for publication. As a service to our customers we are providing this early version of the manuscript. The manuscript will undergo copyediting, typesetting, and review of the resulting proof before it is published in its final citable form. Please note that during the production process errors may be discovered which could affect the content, and all legal disclaimers that apply to the journal pertain.
References
- 1.Bohnen S, Radunski UK, Lund GK, Kandolf R, Stehning C, Schnackenburg B, Adam G, Blankenberg S, Muellerleile K. Performance of T1 and T2 Mapping Cardiovascular Magnetic Resonance to Detect Active Myocarditis in Patients with Recent-Onset Heart Failure. Circ Cardiovasc Imaging 2015;8. doi: 10.1161/CIRCIMAGING.114.003073. [DOI] [PubMed] [Google Scholar]
- 2.Puntmann VO, Nagel E. T1 and T2 Mapping in Nonischemic Cardiomyopathies and Agreement With Endomyocardial Biopsy. J Am Coll Cardiol 2016;68:1923–1924. doi: 10.1016/j.jacc.2016.06.075. [DOI] [PubMed] [Google Scholar]
- 3.Patel AR, Kramer CM. Role of Cardiac Magnetic Resonance in the Diagnosis and Prognosis of Nonischemic Cardiomyopathy. JACC Cardiovasc Imaging 2017;10:1180–1193. doi: 10.1016/j.jcmg.2017.08.005. [DOI] [PMC free article] [PubMed] [Google Scholar]
- 4.Burt JR, Zimmerman SL, Kamel IR, Halushka M, Bluemke DA. Myocardial T1 mapping: techniques and potential applications. Radiographics 2014;34:377–95. doi: 10.1148/rg.342125121. [DOI] [PMC free article] [PubMed] [Google Scholar]
- 5.Hamlin SA, Henry TS, Little BP, Lerakis S, Stillman AE. Mapping the Future of Cardiac MR Imaging: Case-based Review of T1 and T2 Mapping Techniques. RadioGraphics 2014;34:1594–1611. doi: 10.1148/rg.346140030. [DOI] [PubMed] [Google Scholar]
- 6.Taylor AJ, Salerno M, Dharmakumar R, Jerosch-Herold M. T1 Mapping Basic Techniques and Clinical Applications. JACC Cardiovasc Imaging 2016;9:67–81. doi: 10.1016/j.jcmg.2015.11.005. [DOI] [PubMed] [Google Scholar]
- 7.Ugander M, Oki AJ, Hsu L-Y, Kellman P, Greiser A, Aletras AH, Sibley CT, Chen MY, Bandettini WP, Arai AE. Extracellular volume imaging by magnetic resonance imaging provides insights into overt and sub-clinical myocardial pathology. Eur Heart J 2012;33:1268–78. doi: 10.1093/eurheartj/ehr481. [DOI] [PMC free article] [PubMed] [Google Scholar]
- 8.Messroghli DR, Moon JC, Ferreira VM, et al. Clinical recommendations for cardiovascular magnetic resonance mapping of T1, T2, T2* and extracellular volume: A consensus statement by the Society for Cardiovascular Magnetic Resonance (SCMR) endorsed by the European Association for Cardiovascular Imaging (EACVI). J. Cardiovasc. Magn. Reson 2017;19. doi: 10.1186/s12968-017-0389-8. [DOI] [PMC free article] [PubMed] [Google Scholar]
- 9.Martinez-Naharro A, Treibel TA, Abdel-Gadir A, et al. Magnetic Resonance in Transthyretin Cardiac Amyloidosis. J Am Coll Cardiol 2017;70:466–477. doi: 10.1016/j.jacc.2017.05.053. [DOI] [PubMed] [Google Scholar]
- 10.Verhaert D, Thavendiranathan P, Giri S, Mihai G, Rajagopalan S, Simonetti OP, Raman SV. Direct T2 quantification of myocardial edema in acute ischemic injury. JACC Cardiovasc Imaging 2011;4:269–278. doi: 10.1016/j.jcmg.2010.09.023. [DOI] [PMC free article] [PubMed] [Google Scholar]
- 11.Giri S, Chung YC, Merchant A, Mihai G, Rajagopalan S, Raman SV., Simonetti OP. T2 quantification for improved detection of myocardial edema. J Cardiovasc Magn Reson 2009;11. doi: 10.1186/1532-429X-11-56. [DOI] [PMC free article] [PubMed] [Google Scholar]
- 12.Crouser ED, Ono C, Tran T, He X, Raman SV. Improved detection of cardiac sarcoidosis using magnetic resonance with myocardial T2 mapping. Am J Respir Crit Care Med 2014;189:109–112. doi: 10.1164/rccm.201309-1668LE. [DOI] [PMC free article] [PubMed] [Google Scholar]
- 13.Thavendiranathan P, Walls M, Giri S, Verhaert D, Rajagopalan S, Moore S, Simonetti OP, Raman SV. Improved detection of myocardial involvement in acute inflammatory cardiomyopathies using T2 mapping. Circ Cardiovasc Imaging 2012;5:102–110. doi: 10.1161/CIRCIMAGING.111.967836. [DOI] [PMC free article] [PubMed] [Google Scholar]
- 14.Liu A, Wijesurendra RS, Liu JM, et al. Gadolinium-Free Cardiac MR Stress T1-Mapping to Distinguish Epicardial From Microvascular Coronary Disease. J Am Coll Cardiol 2018;71:957–968. doi: 10.1016/j.jacc.2017.11.071. [DOI] [PMC free article] [PubMed] [Google Scholar] [Retracted]
- 15.Blume U, Lockie T, Stehning C, Sinclair S, Uribe S, Razavi R, Schaeffter T. Interleaved T1and T2relaxation time mapping for cardiac applications. J Magn Reson Imaging 2009;29:480–487. doi: 10.1002/jmri.21652. [DOI] [PubMed] [Google Scholar]
- 16.Akçakaya M, Weingärtner S, Basha TA, Roujol S, Bellm S, Nezafat R. Joint myocardial T1 and T2 mapping using a combination of saturation recovery and T2-preparation. Magn Reson Med 2016;76:888–896. doi: 10.1002/mrm.25975. [DOI] [PMC free article] [PubMed] [Google Scholar]
- 17.Kvernby S, Warntjes M Jan B, Haraldsson H, Carlhäll CJ, Engvall J, Ebbers T. Simultaneous three-dimensional myocardial T1 and T2 mapping in one breath hold with 3D-QALAS. J Cardiovasc Magn Reson 2014;16:102. doi: 10.1186/s12968-014-0102-0. [DOI] [PMC free article] [PubMed] [Google Scholar]
- 18.Santini F, Kawel-Boehm N, Greiser A, Bremerich J, Bieri O. Simultaneous T1 and T2 quantification of the myocardium using cardiac balanced-SSFP inversion recovery with interleaved sampling acquisition (CABIRIA). Magn Reson Med 2015;74:365–371. doi: 10.1002/mrm.25402. [DOI] [PubMed] [Google Scholar]
- 19.Hamilton JI, Jiang Y, Chen Y, Ma D, Lo WC, Griswold M, Seiberlich N. MR fingerprinting for rapid quantification of myocardial T1, T2, and proton spin density. Magn Reson Med 2017;77:1446–1458. doi: 10.1002/mrm.26216. [DOI] [PMC free article] [PubMed] [Google Scholar]
- 20.Ma D, Gulani V, Seiberlich N, Liu K, Sunshine JL, Duerk JL, Griswold M a. Magnetic resonance fingerprinting. Nature 2013;495:187–92. doi: 10.1038/nature11971. [DOI] [PMC free article] [PubMed] [Google Scholar]
- 21.Jiang Y, Ma D, Seiberlich N, Gulani V, Griswold M a. MR fingerprinting using fast imaging with steady state precession (FISP) with spiral readout. Magn Reson Med 2015;74:1621–1631. doi: 10.1002/mrm.25559. [DOI] [PMC free article] [PubMed] [Google Scholar]
- 22.Piechnik SK, Ferreira VM, Dall’Armellina E, Cochlin LE, Greiser A, Neubauer S, Robson MD. Shortened Modified Look-Locker Inversion recovery (ShMOLLI) for clinical myocardial T1-mapping at 1.5 and 3 T within a 9 heartbeat breathhold. J Cardiovasc Magn Reson 2010;12:69. doi: 10.1186/1532-429X-12-69. [DOI] [PMC free article] [PubMed] [Google Scholar]
- 23.Wright KL, Ma D, Jiang Y, Gulani V, Griswold MA, Hernandez-Garcia L. Theoretical Framework for MR Fingerprinting with ASL: Simultaneous Quantification of CBF, Transit Time, and T1. Proc. Intl. Soc. Mag. Reson. Med 2014;22:0417. [Google Scholar]
- 24.Jiang Y, Hamilton JI, Lo W-C, Wright KL, Ma D, Coristine AJ, Seiberlich N, Gulani V, Griswold MA. Simultaneous T1, T2 and Diffusion Quantification using Multiple Contrast Prepared Magnetic Resonance Fingerprinting. Proc. Intl. Soc. Mag. Reson. Med 24th 2017;1171. [Google Scholar]
- 25.Ostenson J, Welch B. Fat Signal Fraction Determination Using MR Fingerprinting. Proc. Intl. Soc. Mag. Reson. Med 25th 2017;0134. [Google Scholar]
- 26.Han D, Hong T, Kim D. Development of magnetic resonance ngerprinting (MRF) combined with FISP and multi-echo SPGR acquisition for proton density, T1, T2, T2 * and field mapping. Proc. Intl. Soc. Mag. Reson. Med 25th 2017;3711. [Google Scholar]
- 27.Wang CY, Coppo S, Mehta BB, Seiberlich N, Yu X, Griswold MA. Magnetic Resonance Fingerprinting with Quadratic RF Phase for Simultaneous Measurement of δf, T1, T2, and T2*. Proc. Int. Soc. Magn. Reson. Med 2017:3960. [DOI] [PMC free article] [PubMed] [Google Scholar]
- 28.Hamilton JI, Griswold MA, Seiberlich N. MR Fingerprinting with chemical exchange (MRF-X) to quantify subvoxel T1 and extracellular volume fraction. J Cardiovasc Magn Reson 2015;17:W35. doi: 10.1186/1532-429X-17-S1-W35. [DOI] [Google Scholar]
- 29.Cloos MA, Knoll F, Zhao T, Block K, Bruno M, Wiggins C, Sodickson D. Multiparamatric imaging with heterogenous radiofrequency fields. Nat. Commun 2016;16:7–12445. doi: 10.1038/ncomms12445. [DOI] [PMC free article] [PubMed] [Google Scholar]
- 30.Messroghli DR, Radjenovic A, Kozerke S, Higgins DM, Sivananthan MU, Ridgway JP. Modified Look-Locker inversion recovery (MOLLI) for high-resolutionT1 mapping of the heart. Magn Reson Med 2004;52:141–146. doi: 10.1002/mrm.20110. [DOI] [PubMed] [Google Scholar]
- 31.Chow K, Flewitt JA, Green JD, Pagano JJ, Friedrich MG, Thompson RB. Saturation recovery single-shot acquisition (SASHA) for myocardial T 1 mapping. Magn Reson Med 2014;71:2082–2095. doi: 10.1002/mrm.24878. [DOI] [PubMed] [Google Scholar]
- 32.de Roquefeuil M, Vuissoz PA, Escanyé JM, Felblinger J. Effect of physiological Heart Rate variability on quantitative T2 measurement with ECG-gated Fast Spin Echo (FSE) sequence and its retrospective correction. Magn Reson Imaging 2013;31:1559–1566. doi: 10.1016/j.mri.2013.06.006. [DOI] [PubMed] [Google Scholar]
- 33.Sprinkart AM, Luetkens JA, Träber F, et al. Gradient Spin Echo (GraSE) imaging for fast myocardial T2 mapping. J Cardiovasc Magn Reson 2015;17. doi: 10.1186/s12968-015-0127-z. [DOI] [PMC free article] [PubMed] [Google Scholar]
- 34.Huang TY, Liu YJ, Stemmer A, Poncelet BP. T2 measurement of the human myocardium using a T 2-prepared transient-state trueFISP sequence. Magn Reson Med 2007;57:960–966. doi: 10.1002/mrm.21208. [DOI] [PubMed] [Google Scholar]
- 35.Gai ND, Stehning C, Nacif M, Bluemke DA. Modified Look-Locker T1 evaluation using Bloch simulations: Human and phantom validation. Magn Reson Med 2013;69:329–336. doi: 10.1002/mrm.24251. [DOI] [PMC free article] [PubMed] [Google Scholar]
- 36.Kellman P, Hansen MS. T1-mapping in the heart: accuracy and precision. J Cardiovasc Magn Reson 2014;16:1–20. doi: 10.1186/1532-429X-16-2. [DOI] [PMC free article] [PubMed] [Google Scholar]
- 37.Salerno M, Kramer CM. Advances in parametric mapping with CMR imaging. JACC Cardiovasc Imaging 2013;6:806–822. doi: 10.1016/j.jcmg.2013.05.005. [DOI] [PMC free article] [PubMed] [Google Scholar]
- 38.Chen Y, Jiang Y, Pahwa S, Ma D, Lu L, Twieg MD, Wright KL, Seiberlich N, Griswold MA, Gulani V. MR Fingerprinting for Rapid Quantitative Abdominal Imaging. Radiology 2016;279:278–286. doi: 10.1148/radiol.2016152037. [DOI] [PMC free article] [PubMed] [Google Scholar]
- 39.Hamilton JI, Jiang Y, Ma D, Lo W-C, Gulani V, Griswold M, Seiberlich N. Investigating and reducing the effects of confounding factors for robust T 1 and T 2 mapping with cardiac MR fingerprinting. Magn Reson Imaging 2018. doi: 10.1016/j.mri.2018.06.018. [DOI] [PMC free article] [PubMed] [Google Scholar]
- 40.Yang M, Ma D, Jiang Y, Hamilton J, Seiberlich N, Griswold MA, McGivney D. Low rank approximation methods for MR fingerprinting with large scale dictionaries. Magn. Reson. Med 2017;79:2392–2400. doi: 10.1002/mrm.26867. [DOI] [PMC free article] [PubMed] [Google Scholar]
- 41.Pierre EY, Ma D, Chen Y, Badve C, Griswold MA. Multiscale reconstruction for MR fingerprinting. Magn Reson Med 2016;75:2481–2492. doi: 10.1002/mrm.25776. [DOI] [PMC free article] [PubMed] [Google Scholar]
- 42.Cline CC, Chen X, Mailhe B, Wang Q, Pfeuffer J, Nittka M, Griswold MA, Speier P, Nadar MS. AIR-MRF: Accelerated iterative reconstruction for magnetic resonance fingerprinting. Magn Reson Imaging 2017;41:29–40. doi: 10.1016/j.mri.2017.07.007. [DOI] [PubMed] [Google Scholar]
- 43.Hamilton JI, Jiang Y, Chen Y, Pawha S, Lo W, Batesole J, Seiberlich N. Low Rank Compressed Sensing Reconstruction for More Precise Cardiac MRF Measurements. Proc. Intl. Soc. Mag. Reson. Med 25th 2017;0554. [Google Scholar]
- 44.Assländer J, Cloos MA, Knoll F, Sodickson DK, Hennig J, Lattanzi R. Low rank alternating direction method of multipliers reconstruction for MR fingerprinting. Magn Reson Med 2018;79:83–96. doi: 10.1002/mrm.26639. [DOI] [PMC free article] [PubMed] [Google Scholar]
- 45.McGivney DF, Pierre E, Ma D, Jiang Y, Saybasili H, Gulani V, Griswold MA. SVD compression for magnetic resonance fingerprinting in the time domain. IEEE Trans Med Imaging 2014;33:2311–2322. doi: 10.1109/TMI.2014.2337321. [DOI] [PMC free article] [PubMed] [Google Scholar]
- 46.Dabir D, Child N, Kalra A, et al. Reference values for healthy human myocardium using a T1 mapping methodology: results from the International T1 Multicenter cardiovascular magnetic resonance study. J Cardiovasc Magn Reson 2014;16:69. doi: 10.1186/s12968-014-0069-x. [DOI] [PMC free article] [PubMed] [Google Scholar]
- 47.Teixeira T, Hafyane T, Stikov N, Akdeniz C, Greiser A, Friedrich MG. Comparison of different cardiovascular magnetic resonance sequences for native myocardial T1 mapping at 3T. J Cardiovasc Magn Reson 2016:1–12. doi: 10.1186/s12968-016-0286-6. [DOI] [PMC free article] [PubMed] [Google Scholar]
- 48.Van Heeswijk RB, Feliciano H, Bongard C, Bonanno G, Coppo S, Lauriers N, Locca D, Schwitter J, Stuber M. Free-breathing 3 T magnetic resonance T2-mapping of the heart. JACC Cardiovasc Imaging 2012;5:1231–1239. doi: 10.1016/j.jcmg.2012.06.010. [DOI] [PubMed] [Google Scholar]
- 49.Pahwa S, Hamilton J, Adedigba J, et al. Simultaneous T1 and T2 mapping of the myocardium in normal volunteers using Cardiac MR Fingerprinting. Proc. Intl. Soc. Mag. Reson. Med 25 2017:2726. [Google Scholar]
- 50.Jiang Y, Ma D, Keenan KE, Stupic KF, Gulani V, Griswold MA. Repeatability of magnetic resonance fingerprinting T1 and T2 estimates assessed using the ISMRM/NIST MRI system phantom. Magn Reson Med 2017;78:1452–1457. doi: 10.1002/mrm.26509. [DOI] [PMC free article] [PubMed] [Google Scholar]
- 51.Lo WC, Jiang Y, Bittencourt LK, et al. Multicenter repeatability and reproducibility of MR Fingerprinting. Proc. Intl. Soc. Mag. Reson. Med 26th 2018;5236. [DOI] [PMC free article] [PubMed] [Google Scholar]
- 52.Coristine AJ, Hamilton JI, van Heeswijk RB, Stuber M, Seiberlich N, Roger H. Cardiac MRF in heart transplant recipients. ISMRM Work MRF 2017. [Google Scholar]
- 53.Rosmini S, Bulluck H, Captur G, et al. Myocardial native T1 and extracellular volume with healthy ageing and gender. Eur Hear J - Cardiovasc Imaging 2018. doi: 10.1093/ehjci/jey034. [DOI] [PMC free article] [PubMed] [Google Scholar]
- 54.Shang Y, Zhang X, Leng W, Chen L, Lei X, Zhang T, Greiser A, Liang Z, Wang J. Assessment of Diabetic Cardiomyopathy by Cardiovascular Magnetic Resonance T1 Mapping: Correlation with Left-Ventricular Diastolic Dysfunction and Diabetic Duration. J Diabetes Res 2017;2017. doi: 10.1155/2017/9584278. [DOI] [PMC free article] [PubMed] [Google Scholar]
- 55.Hamilton JI, Jiang Y, Ma D, Pahwa S, Chen Y, Lo W-C, Griswold MA, Seiberlich N. A Comparison of 5-Heartbeat vs. 15-Heartbeat Cardiac MR Fingerprinting Sequences in Normal Volunteers. ISMRM Work MRF 2017. [Google Scholar]
- 56.Liu Y, Hamilton J, Griswold M, Seiberlich N. Simultaneous Quantification of T1, T2, and Off-resonance Using FISP-MRF with a Rosette Trajectory and Readout Segmentation. Proc. Intl. Soc. Mag. Reson. Med 26th 2018;8246. [Google Scholar]
- 57.Robson MD, Piechnik SK, Tunnicliffe EM, Neubauer S. T1 measurements in the human myocardium: The effects of magnetization transfer on the SASHA and MOLLI sequences. Magn Reson Med 2013;70:664–670. doi: 10.1002/mrm.24867. [DOI] [PubMed] [Google Scholar]
- 58.Hilbert T, Kober T, Zhao T, Block KT, Yu Z, Thiran J-P, Krueger G, Sodickson DK, Cloos M. Mitigating the Effect of Magnetization Transfer in Magnetic Resonance Fingerprinting. Proc. Intl. Soc. Mag. Reson. Med 25th 2017:74. [DOI] [PMC free article] [PubMed] [Google Scholar]


