Abstract
Erythropoiesis-stimulating agents are generally the first line of treatment of anemia in patients with lower-risk myelodysplastic syndrome. We prospectively investigated the predictive value of somatic mutations, and biomarkers of ineffective erythropoiesis including the flow cytometry RED score, serum growth-differentiation factor-15, and hepcidin levels. Inclusion criteria were no prior treatment with erythropoiesis-stimulating agents, low- or intermediate-1-risk myelodysplastic syndrome according to the International Prognostic Scoring System, and a hemoglobin level <10 g/dL. Patients could be red blood cell transfusion-dependent or not and were given epoetin zeta 40 000 IU/week. Serum erythropoietin level, iron parameters, hepcidin, flow cytometry Ogata and RED scores, and growth-differentiation factor-15 levels were determined at baseline, and molecular analysis by next-generation sequencing was also conducted. Erythroid response (defined according to the International Working Group 2006 criteria) was assessed at week 12. Seventy patients, with a median age of 78 years, were included in the study. There were 22 patients with refractory cytopenia with multilineage dysplasia, 19 with refractory cytopenia with unilineage dysplasia, 14 with refractory anemia with ring sideroblasts, four with refractory anemia with excess blasts-1, six with chronic myelomonocytic leukemia, two with del5q-and three with unclassifiable myelodysplastic syndrome. According to the revised International Prognostic Scoring System, 13 had very low risk, 47 had low risk, nine intermediate risk and one had high-risk disease. Twenty patients were transfusion dependent. Forty-eight percent had an erythroid response and the median duration of the response was 26 months. At baseline, non-responders had significantly higher RED scores and lower hepcidin:ferritin ratios. In multivariate analysis, only a RED score >4 (P=0.05) and a hepcidin:ferritin ratio <9 (P=0.02) were statistically significantly associated with worse erythroid response. The median response duration was shorter in patients with growth-differentiation factor-15 >2000 pg/mL and a hepcidin:ferritin ratio <9 (P=0.0008 and P=0.01, respectively). In multivariate analysis, both variables were associated with shorter response duration. Erythroid response to epoetin zeta was similar to that obtained with other erythropoiesis-stimulating agents and was correlated with higher baseline hepcidin:ferritin ratio and lower RED score. ClinicalTrials.gov registration: NCT 03598582.
Introduction
Myelodysplastic syndromes (MDS) are acquired, neoplastic disorders of hematopoietic stem cells characterized by ineffective and dysplastic myeloid cell differentiation, in particular dyserythropoiesis leading to anemia in more than 80% of cases.1 The main prognostic factors in MDS, which define the risk of MDS progression to acute myeloid leukemia and patients’ survival, include the number and importance of cytopenias as well as the percentage of bone marrow blasts and the cytogenetic abnormalities. These factors are combined in a recently revised International Prognostic Scoring System (IPSS-R).2
For lower-risk MDS, essentially characterized by anemia related to ineffective erythropoiesis, first-line treatments generally include (in the absence of the 5q chromosomal deletion) erythropoiesis-stimulating agents (ESA) (mainly epoetins and darbepoetin) with or without granulocyte - colony - stimulating factors to improve anemia. Subsequent treatments include lenalidomide, hypomethylating agents, luspatercept and other investigational drugs (APG-101, imetelstat, etc.).
The response rate to ESA according to International Working Group 2006 criteria [i.e. erythroid hematologic improvement (HI-E), including red blood cell (RBC) transfusion independence or an increase of hemoglobin level >1.5 g/dL] is approximately 50% for patients with favorable prognostic factors, with a median response duration of 20 to 24 months. Our results, confirmed by other groups, suggest that this treatment does not increase the risk of transformation into acute myeloid leukemia and improves overall survival.3,4
Known prognostic factors for a favorable response to ESA in MDS patients include early stage disease, serum erythropoietin (sEPO) levels below 500 U/L and no or low requirement for RBC transfusion,5 while trilineage dysplasia may be associated with a lower response rate to ESA and/or shorter duration of response.6 We also found that a score based on IPSS-R, serum ferritin level and sEPO concentration can efficiently predict the response,7 while patients with mutations in at least three genes have a lower response rate.8 The mechanisms of primary resistance or loss of response are unknown. Relapse may be explained in only 25% to 30% of patients by a detectable progression of MDS with, as shown by worsening of cytopenias other than anemia, increasing numbers of bone marrow blasts or frank progression to acute myeloid leukemia. Biomarkers of ineffective erythropoiesis may, therefore, help to predict the response to ESA.
Over the past 20 years, new approaches in multipara-meter flow cytometry have contributed to the diagnosis of MDS by quantifying myeloblasts, hematogones and dysgranulopoiesis using the Ogata score.9–13 However, few studies have specifically addressed the late stages of erythroid differentiation.10,14 The flow cytometry RED score10 was developed as a whole bone marrow flow cytometry protocol using the nuclear dye CyTRAK orange to gate nucleated cells without lysing red blood cells. The RED score is based on the evaluation of dyserythropoiesis with CD71 and CD36 coefficient of variation values and hemoglobin levels according to gender. It ranges from 0 to 7, with a RED score ≥3 predicting MDS with a sensitivity of 77.5% and a specificity of 90%. By combining the RED and the Ogata scores, the sensitivity can reach 87.9% and the specificity 88.9%.10 Interestingly, ineffective erythropoiesis has been correlated with high levels of serum growth differentiation factor-15 (GDF-15), a member of the transforming growth factor-β superfamily that is produced by erythroid precursors at the end of the differentiation process.15,16
Upon chronic RBC transfusions, patients with lower-risk MDS may develop iron overload. A greater insight into iron homeostasis in MDS patients can be obtained by monitoring specific markers of iron metabolism including hepcidin, in correlation with ferritin and levels of transferrin saturation.
In this trial, we aimed to find biomarkers predicting response to epoetin zeta in patients with lower-risk MDS and to use these to evaluate the efficacy of a biosimilar drug to epoetin alfa in such patients.
Methods
Patients and study design
Eligibility criteria for inclusion in the study were: (i) a diagnosis of MDS according to the World Health Organization (WHO) 2008 criteria [refractory anemia (RA), refractory anemia with ring sidero blasts (RARS), refractory cytopenia with multilineage dysplasia (RCMD), refractory cytopenia with unilineage dysplasia (RCUD), refractory anemia with excess blasts-1 (RAEB-1), del 5q syndrome], or chronic myelomonocytic leukemia-1 (CMML-1) with a white blood cell count <13x109/L, (ii) low/intermediate (int)-1 risk according to the IPSS determined locally, (iii) hemoglobin <10 g/dL or RBC transfusion dependence, (iv) Eastern Cooperative Oncology Group performance status <2 and (v) sEPO level <500 IU/L. Exclusion criteria were: non-controlled hypertension, or cardiovascular disease (uncontrolled angina pectoris, heart failure), renal insufficiency, sEPO level >500 IU/L, systemic infection or chronic inflammatory disease, serum folate <2 ng/mL or vitamin B12 <200 pg/mL, and other non-MDS-related causes of anemia (e.g., hemolysis, hemorrhage, iron deficiency). All patients gave their written informed consent to biological investigations according to the recommendations of the local ethics committee (Comité de Protection des Personnes Paris V, CPP n. RCB 212-A01395-38, EUDRACT 2012-002990-7338) and the study was conducted in accordance with the Helsinki Declaration and registered in ClinicalTrials.gov as NCT03598582.
Treatment
Patients received subcutaneous epoetin zeta 40 000 IU/week for 12 weeks. Response was evaluated after 12 weeks of treatment according to International Working Group 2006 criteria. Non-responders were excluded from the study while responsive patients continued on epoetin zeta for another 52 weeks. Patients still responding at week 52 could continue treatment, based on the physician’s decision. If hemoglobin levels exceeded 12 g/dL at any time before week 12, the dose of epoetin zeta was reduced to 20 000 IU/week. After week 12, the intervals between injections were increased by 1 week if hemoglobin levels exceeded 13 g/dL. The purpose of this dose adjustment was to reach epoetin zeta doses allowing hemoglobin levels to be maintained between 11 and 12 g/dL. During the dose adjustment period, weekly blood counts were performed. No prescription of iron was allowed in this trial, in order not to perturb iron metabolism markers. Each patient had a minimal follow-up of 52 weeks.
Biological endpoints
The primary endpoint of this study was to find new biomarkers capable of predicting the response to epoetin zeta.
Bone marrow aspirates were collected from all 70 patients at inclusion and then after 12 weeks. No samples were excluded based on clinical parameters. Fresh bone marrow aspirates were sent to Cochin Hospital, Paris, for centralized flow cytometry analysis of dyserythropoiesis, using the RED score, and gene sequencing. Ogata scores were also assessed locally in the hospitals of Mulhouse, Creteil, Tours, Grenoble and Cochin. Patients were re-evaluated at week 12 by flow cytometry using both the RED and Ogata scores, assessed centrally in Cochin Hospital.10
Blood plasma was also collected for quantitative analyses of hepcidin and GDF-15. Hepcidin levels from plasma samples collected in EDTA were measured by liquid chromatography coupled to tandem mass spectrometry in Louis Mourier Hospital using the method described by Lefebvre et al.17 The results are expressed as hepcidin:ferritin (x100) ratios which represent a measure of the adequacy of hepcidin level relative to iron body stores because hepcidin levels are known to be modulated by transfusion and inflammation. All patients, except one, had C-reactive protein values <5 mg/L. GDF-15 was measured by enzyme-linked immunosorbent assay at Cochin hospital, using kits obtained from R&D Systems (Minneapolis, MN, USA).18
Genomic studies and bioinformatic analysis
Mononuclear cells from bone marrow aspirates were purified on a Ficoll gradient. Cell pellets were further processed for DNA extraction using the DNA/RNA Kit (Qiagen, Hilden, Germany). All 70 samples were screened for mutations in a panel of 26 genes (ASXL1, CBL, DNMT3A, ETV6, EZH2, FLT3, IDH1, IDH2, JAK2, KIT, KRAS, NRAS, MPL, NPM1, PHF6, PTPN11, RIT1, RUNX1, SETBP1, SF3B1, SRSF2, TET2, TP53, U2AF1, WT1 and ZRSR2) by a next-generation sequencing assay using the Ion AmpliSeq™ library kit 2 384 n. 4480442 (Life Technologies, Chicago, IL, USA). All the samples were also screened for ASXL1 (including c.1934dupG; p.G646WfsX12) and SRSF2 mutations by Sanger sequencing. JAK2, NPM1 and FLT3-ITD mutations were analyzed by real-time polymerase chain reaction and fluorescent polymerase chain reaction to confirm the next-generation sequencing data. Bioinformatic analysis was performed as previously described.19
Sample size justification and statistical analysis
The sample size was computed based on an expected treatment response rate of 50% to 60%, i.e. about 30 responders and 30 non-responders. Allowing for 10%-15% of the biological data being non-evaluable, 70 patients had to be included.
For continuous variables, values were expressed as medians and interquartile ranges (IQR) or means and compared using the Wilcoxon test. Categorical variables are reported as counts or percentages with 95% confidence intervals (95% CI) and were compared using a Fisher exact or chi-squared test. Evaluation of the erythroid response (according to International Working Group 2006 criteria) after 12 weeks of treatment, i.e. the efficacy endpoint, was considered as a binary variable (response versus non-response). The search for factors predictive of response was performed by logistic regression and results were presented as odds ratio (OR) with 95% CI. P values <0.05 were considered statistically significant. Receiving operating characteristic (ROC) curves were used to determine the best thresholds of the prognostic factors. All analyses were performed using JMP® software (version 10, SAS Institute Inc, Cary, NC, USA).
Results
Patients’ baseline characteristics
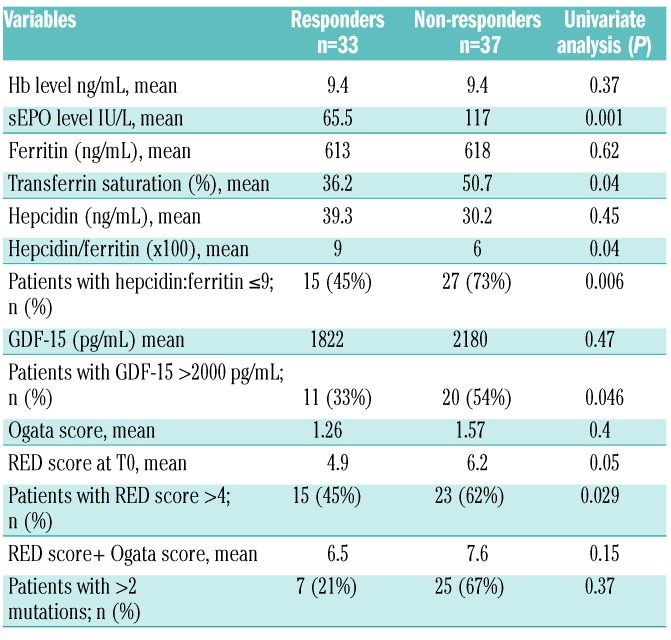
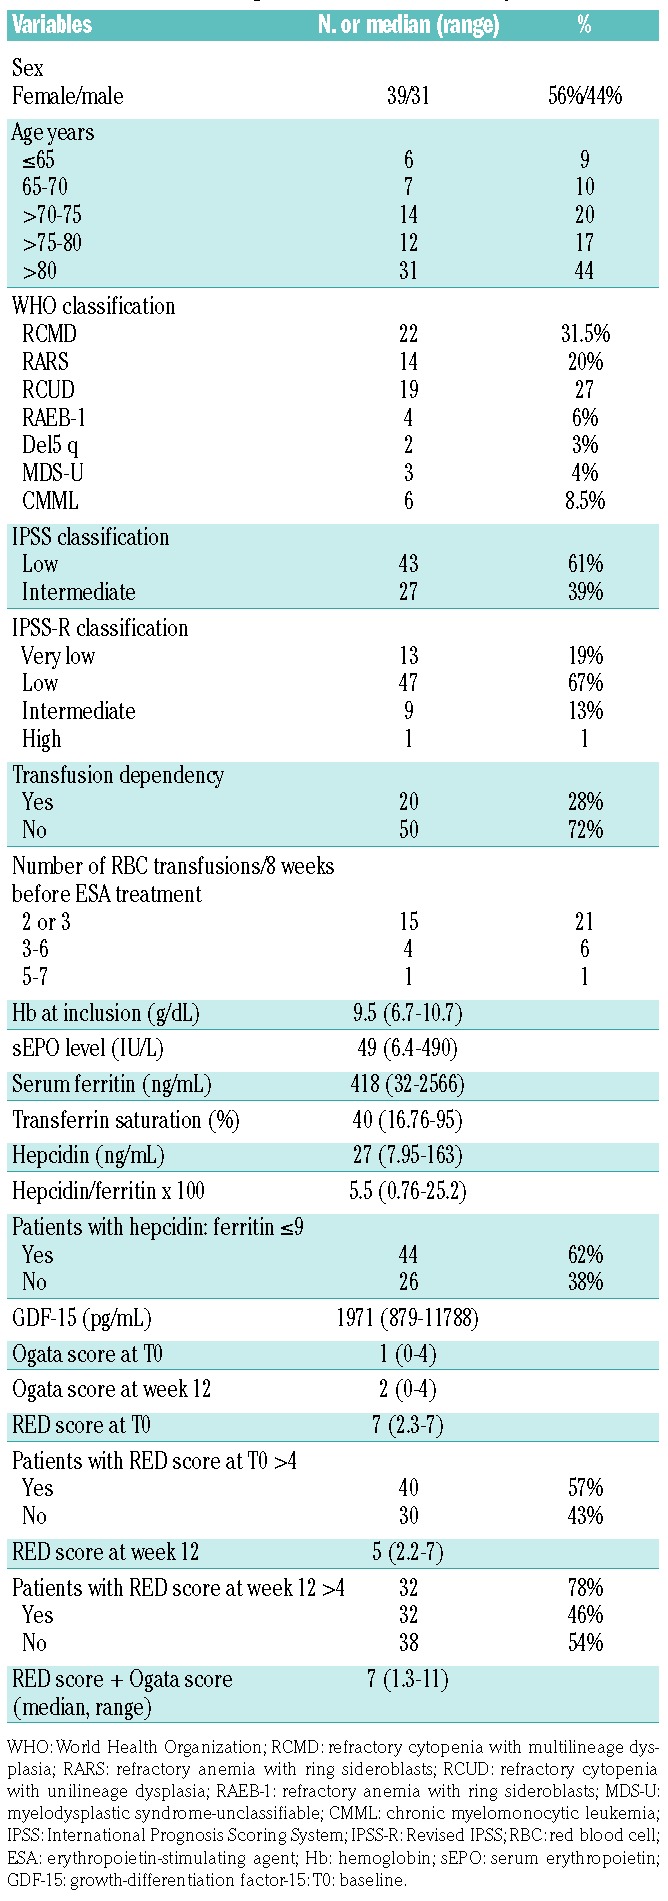
Seventy patients (31 males and 39 females) were recruited in 16 French centers between January 2013 and March 2017. Their median age was 78 years (range, 57-93 years). At inclusion, the WHO classification of the patients was the following: 22 RCMD, 19 RCUD, 14 RARS, four RAEB-1, six CMML, two del 5q-, and three MDS-unclassifiable. The IPSS classification was low in 43 (61.5%) and int-1 in 27 (38.5%) patients, whereas the IPSS-R classification was very low in 13 (18.5%), low in 47 (67%), intermediate in nine (13%) and high in one (1.4%) patient. Twenty (28%) patients were dependent on RBC transfusions (median >2 RBC transfusions/8 weeks) receiving a cumulated number of RBC concentrates ranging from 2 to 7 (median 3) (Table 1). Before treatment, next-generation sequencing was performed in 68 patients. The most frequent mutations involved SF3B1 (n=28), TET2 (n=20), ASXL1 (n=15), SRSF2 (n=9), DNMT3A (n=9), U2AF1 (n=7), IDH1/2 (n=6), and EZH2 (n=6) genes. One, two, three, four or five mutations were detected in 12, 12, 26, 10, seven and one patients, respectively, and 26% of patients had more than two mutations (Online Supplementary Figure S1).
Table 1.
Clinical and biological characteristics of the patients.
Efficacy and safety of epoetin zeta
Overall the HI-E was 47.6% (33 patients). Among the 20 transfusion-dependent patients, eight obtained HI-E (40%) (decrease of transfusion of at least 4 RBC concentrates/8 weeks or transfusion independence). The median duration of response was 26.1 months. In three, MDS progressed to acute myeloid leukemia. Twelve patients died (including 3 with acute myeloid leukemia and 1 with progression of MDS). The median overall survival was 41 months with a median follow-up of 15.5 months. No grade >2 adverse events were reported. No cases of hypertension or deep venous thrombosis were reported. No patients had a hemoglobin greater than 13g/dL.
Flow cytometry results and correlation between iron parameters
The median values of the iron parameters were: hemoglobin 9.5 g/dL (IQR 8.9-10), transferrin saturation 39% (IQR 28-56), serum ferritin 411 ng/mL (IQR 258-831) and sEPO 49 U/L (IQR 25-122). The median Ogata score was 1 (IQR 1-2) at baseline and 2 (IQR 1-2) at week 12. The median RED score was 7 (IQR 5-7) at baseline (with 90% of patients having a score ≥3), and 5 (IQR 4.75-7) at week 12 (Table 1).
The median GDF-15 concentration was 1971 pg/mL (IQR 1236-2860). GDF-15 level was lower in patients with IPSS low-risk MDS than in those with int-1 MDS and correlated with transferrin saturation (P<0.003). The median hepcidin concentration was 27 ng/mL (IQR 14-42; normal 1.3-26.4) and the median hepcidin:ferritin ratio was 5.5 (IQR 1.9-11.85).
The median GDF-15 levels were elevated particularly in patients with RARS and CMML (3163 pg/mL and 3520 pg/mL, respectively, compared to those in patients with other types of MDS (RA, RCMD, RAEB-1, Wilcoxon test P=0.02) (Online Supplementary Figure S2). The hepcidin:ferritin ratio was not correlated with WHO 2008 classification despite a tendency to a lower ratio in RARS. The hepcidin:ferritin ratio was inversely correlated with GDF-15 levels (R2=0.245, P=0.04), Online Supplementary Figure S3).
Patients with ferritin >400 ng/mL had a significantly higher mean GDF-15 level (3011 pg/mL) than patients with ferritin <400 ng/mL (mean GDF-15 level 2018 pg/mL, P=0.005). Hepcidin:ferritin ratios were correlated with the cumulative number of RBC transfusions before the trial onset: the mean number of transfusions was 2.3 in patients with a hepcidin:ferritin ratio >9 versus 5 in patients with a hepcidin:ferritin ≤9 (P=0.03). On the basis of ROC curves, we chose the threshold of 9 for hepcidin:ferritin ratio for the remaining statistical analyses (Online Supplementary Figure S4A).
Biomarkers of response to erythropoiesis-stimulating agents
Baseline age, sex, blood counts (absolute neutrophil count, platelets, hemoglobin), WHO 2008 classification, number and type of mutations, IPSS-R classification, serum ferritin, sEPO levels, Ogata score and previous RBC transfusions were not significantly associated with response (data not shown). Therefore, mutation analysis failed to identify biological markers of response to ESA.
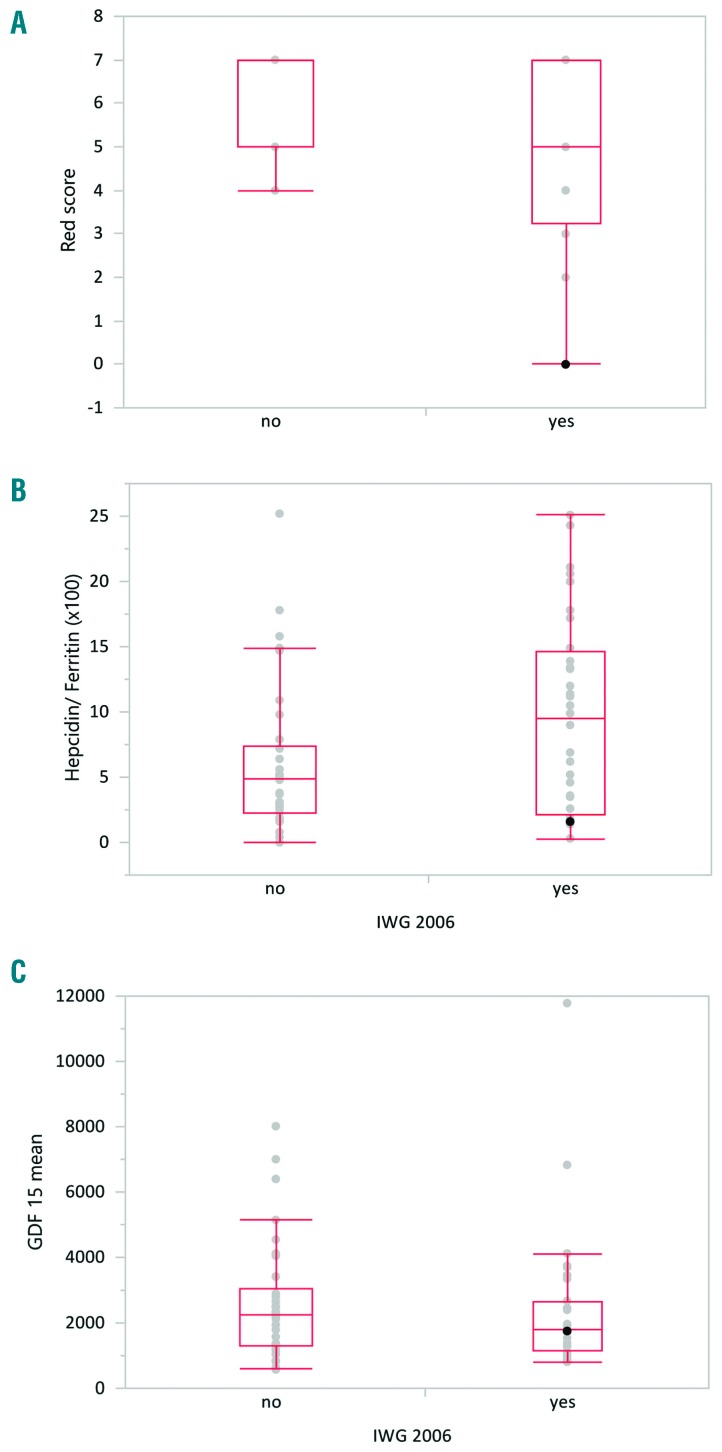
Non-responders had a significantly higher sEPO level (117.3 IU/L versus 65.5 IU/L in responders, P=0.001) (Table 2A). Non-responders had a significantly higher baseline RED score (mean 6.2 in non-responders versus 4.9 in responders, P=0.01) (Figure 1A) and lower hepcidin:ferritin ratio (mean 4.8 versus 9, P=0.04) (Figure 1B). GDF-15 levels tended to be higher in non-responders (2180 pg/mL versus 1822 pg/mL in responders; P=0.47) (Figure 1C). Using ROC curves, thresholds were subsequently defined as 4 for the RED score, 9 for hepcidin:ferritin ratio and 2000 pg/mL for GDF-15. ROC curves, sensitivity and specificity for these three parameters are presented in Online Supplementary Figure S4.
Table 2A.
Baseline biological markers associated with response to erythropoiesis-stimulating agents.
Figure 1.
Biological markers of dyserythropoiesis and correlation with response to erythropoiesis-stimulating agents. Response was defined according to the International Working Group 2006 criteria (IWG 2006) for hematologic improvement-erythroid. (A) Mean RED score before treatment for patients who did have a response (yes) or did not have a response (no). Non-responders had higher RED scores (P=0.01). (B) Mean hepcidin:ferritin ratio in patients who did or did not have a response; the hepcidin:ferritin ratio was lower in non-responders (P=0.04). (C) Mean GDF-15 level in patients who did or did not respond to erythropoietin-stimulating agent treatment (P=0.4).
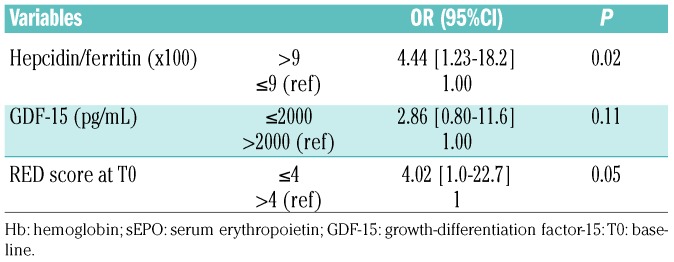
In multivariate analysis, only RED score ≤4 and hepcidin:ferritin ratio >9 were significantly associated with better HI-E (OR 4.02, 95% CI: 1.0-22.7, P=0.05, and OR 4.44, 95% CI: 1.23-18.2, P=0.02, respectively) (Table 2B). The HI-E rate was 39% in patients with a RED score >4 versus 75% in patients with a RED score ≤4.
Table 2B.
Multivariate analysis of predictors of erythroid hematologic improvement (HI-E) to erythropoiesis-stimulating agents.
Patients with a low hepcidin:ferritin ratio (≤9) had relatively higher sEPO levels than those with higher hepcidin:ferritin ratios (mean sEPO 108 versus 65 IU/L, respectively, P=0.003).
Biomarkers of duration of response to erythropoiesis-stimulating agents
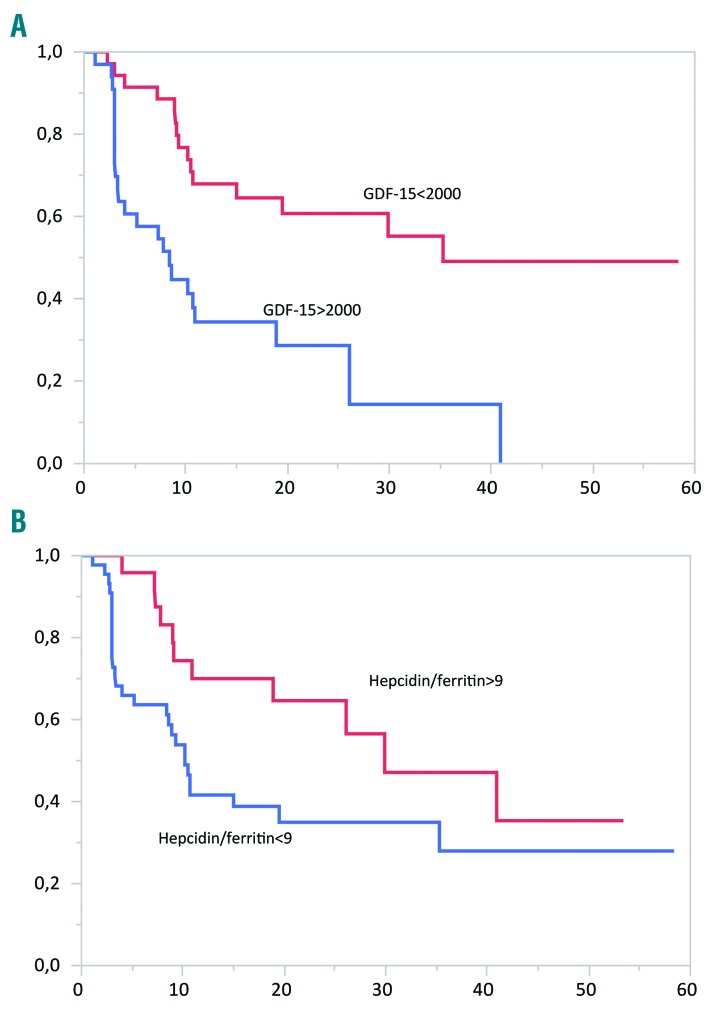
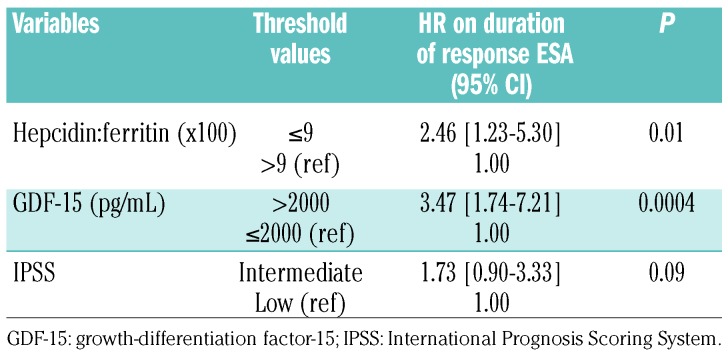
The median duration of response to epoetin zeta was 26.1 months, being 8 months in patients with GDF-15 >2000 pg/mL versus 35 months for those with GDF-15 ≤2000 pg/mL (P=0.0008) (Figure 2A). The median duration of response in patients with a hepcidin:ferritin ratio ≤9 was 10 months versus 30 months in patients with a hepcidin:ferritin ratio >9 (P=0.01) (Figure 2B). The RED score was not significantly associated with response duration (P=0.4).
Figure 2.
Duration of response to erythropoiesis-stimulating agents. Kaplan Meier curves showing duration of response (in months) according to (A) GDF-15 level (P=0.0008) and (B) hepcidin:ferritin ratio (P=0.01). Hepcidin:ferritin >9: red curve; hepcidin:ferritin ≤9: blue curve.
In multivariate analysis, taking into account GDF-15 level, hepcidin:ferritin ratio and IPSS classificaiton, only GDF-15 level >2000 pg/mL and hepcidin:ferritin ratio ≤9 predicted shorter response (Table 3).
Table 3.
Multivariate analysis of predictors of duration of response to erythropoiesis-stimulating agents.
Discussion
The findings of this study suggest that epoetin zeta is as effective as other ESA3,4 in this group of patients with lower-risk MDS with relatively favorable characteristics (only 28% of them were transfusion-dependent and their median sEPO level was relatively low), with a HI-E response rate of 47.6% and a median duration of response of 26.1 months. Safety findings were consistent with the known safety profiles of epoetin alfa and darbepoetin.20,21 The two major results of our study are that a low hepcidin:ferritin ratio and a high RED score were predictive of lower HI-E, while GDF-15 >2000 pg/mL and hepcidin:ferritin <9 could be predictive factors of shorter response duration.
To the best of our knowledge, this is the first time that iron homeostasis parameters and dyserythropoiesis have been observed to have a predictive value with regards to response to ESA.
Hepcidin, a 25-amino acid peptide, is produced mainly by hepatocytes and secreted into the plasma. This peptide lowers the amount of iron in the serum by inhibiting iron export by ferroportin, a membrane-bound cellular iron exporter present on macrophages and at the basolateral site of enterocytes, which release iron into the circulation. Hepcidin is suppressed by increased erythropoietic iron demand and is upregulated in the presence of increased iron levels or elevated body iron stores.22,23 In this study, a tendency to lower hepcidin:ferritin ratios was found in RARS patients. Theoretically, hepcidin suppression should lead to an increase of iron transport across the cell membrane and, therefore, greater delivery of iron to transferrin for the needs of increased erythropoiesis, but as MDS patients have ineffective erythropoiesis, hepcidin suppression actually results in iron overload and a potential toxicity to erythropoiesis with the Fenton reaction leading to an excess of reactive oxygen species particularly in RARS. This suggests that erythropoiesis and iron homeostasis are tightly related and that dyserythropoiesis, as measured by the RED score, influences iron equilibrium by suppressing hepcidin and increasing iron absorption.
The erythroid mediator GDF-15, produced in response to erythropoietin by erythroblasts, has been described as a potential suppressor of hepcidin expression.15 However, the correlation between GDF-15 and hepcidin levels was poor in studies in phlebotomized mice and in MDS patients.24,25 Recently, the role of GDF-15 in the regulation of hepcidin production in physiological and pathological settings has been challenged by the discovery of erythroferrone, which has been demonstrated to be the real suppressor of hepcidin.26 GDF-15 levels are elevated in thalassemia and congenital dyserythropoietic anemia, two disorders with a high degree of ineffective erythropoiesis15,16,27 and correlate with the severity of anemia. GDF-15 level is, therefore, more the reflection of erythroid precursor activity and a useful indicator of ineffective erythropoiesis.
Taken altogether, hepcidin suppression by increased erythropoietic activity appears to underlie the development of abnormal iron overload in anemia, independently of RBC transfusions and is strongly correlated with worse erythroid response to ESA.
Hepcidin, routinely available in some countries, can be measured by mass spectrometry and international laboratories are working to uniform hepcidin analysis.28,29 This assay could also be used for MDS studies. To conclude, our results could lead to the use of hepcidin measurements to predict response to ESA. Patients with a low hepcidin:ferritin ratio, high RED score and high GDF-15 level may require other treatments than ESA alone. These treatments should aim at improving the use of iron in MDS. We recently showed potential positive effects of low doses of deferasirox in MDS patients. It is postulated that this drug quenches levels of reactive oxygen species, leading to activation of nuclear factor-κB in erythroblasts, which in turns induces proliferation of these cells and possible improvement of anemia.30 An ongoing clinical trial is investing the use of low-dose deferasirox in anemic patients with lower-risk MDS who have failed to respond to treatment with ESA (ClinicalTrials.gov identifier: NCT03387475). Secondly, increasing hepcidin level could prevent further accumulation of iron and reduce iron-mediated tissue injury by redistributing iron from parenchymal tissues to macrophages where iron is less toxic. A clinical trial with an agonist of hepcidin (LJPC-410) is ongoing in patients with β-thalassemia with myocardial iron overload (ClinicalTrials.gov identifier: NCT03381833). In patients with dysregulated iron homeostasis, hepcidin agonists or low-dose deferasirox could be considered in combination with ESA.
Concerning the RED score, the data are consistent with those of other flow cytometry scores described by the European LeukemiaNet predicting a lower response to ESA or hypomethylating agents in MDS patients.31–33 Flow cytometry techniques have been recommended by international expert panels for use in the diagnosis of MDS, particularly in order to measure dyserythropoiesis objectively.14,34 A French national survey on the practical use of flow cytometry in the diagnosis of MDS showed that about 12 of the 50 French centers that routinely perform flow cytometry for the diagnosis of myeloid neoplasms use flow cytometry for the diagnosis of MDS and only four centers use the RED score (Orianne Wagner-Ballon, personal communication). However, if other larger studies confirm the usefulness of the RED score in the prediction of response to ESA, these techniques will be used more often in a practical way.
To conclude, in our series, the flow cytometry RED score and hepcidin:ferritin ratio enabled identification of patients who would not respond to ESA, and GDF-15 levels and hepcidin:ferritin ratio predicted shorter duration of response. These results warrant confirmation in larger series. In patients with MDS, other treatments aimed at restoring redox and iron homeostasis could efficiently improve the erythroid response.
Supplementary Material
Acknowledgments
This study received the support of a research grant from Hospira/Pfizer and the institutional support of Assistance Publique-Hôpitaux de Paris through the Unité de Recherche Clinique Paris Descartes Necker Cochin. The authors thank all investigators of the Groupe Francophone des Myélodysplasies (GFM) and Audrey Gauthier for technical assistance. We wish to pay tribute to Christian Rose who died recently. He was an active member of the GFM and a leader in the field of iron chelation.
Footnotes
Check the online version for the most updated information on this article, online supplements, and information on authorship & disclosures: www.haematologica.org/content/104/3/497
References
- 1.Fontenay-Roupie M, Bouscary D, Guesnu M, et al. Ineffective erythropoiesis in myelodysplastic syndromes: correlation with Fas expression but not with lack of erythropoietin receptor signal transduction. Br J Haematol. 1999;106(2):464–473. [DOI] [PubMed] [Google Scholar]
- 2.Greenberg PL, Tuechler H, Schanz J, et al. Revised International Prognostic Scoring System for myelodysplastic syndromes. Blood. 2012;120(12):2454–2465. [DOI] [PMC free article] [PubMed] [Google Scholar]
- 3.Park S, Grabar S, Kelaidi C, et al. Predictive factors of response and survival in myelodysplastic syndrome treated with erythropoietin and G-CSF: the GFM experience. Blood. 2008;111(2):574–582. [DOI] [PubMed] [Google Scholar]
- 4.Jadersten M, Montgomery SM, Dybedal I, Porwit-MacDonald A, Hellstrom-Lindberg E. Long-term outcome of treatment of anemia in MDS with erythropoietin and G-CSF. Blood. 2005;106(3):803–811. [DOI] [PubMed] [Google Scholar]
- 5.Hellstrom-Lindberg E, Gulbrandsen N, Lindberg G, et al. A validated decision model for treating the anaemia of myelodysplastic syndromes with erythropoietin + granulocyte colony-stimulating factor: significant effects on quality of life. Br J Haematol. 2003;120(6):1037–1046. [DOI] [PubMed] [Google Scholar]
- 6.Howe RB, Porwit-MacDonald A, Wanat R, Tehranchi R, Hellstrom-Lindberg E. The WHO classification of MDS does make a difference. Blood. 2004;103(9):3265–3270. [DOI] [PubMed] [Google Scholar]
- 7.Santini V, Schemenau J, Levis A, et al. Can the revised IPSS predict response to erythropoietic-stimulating agents in patients with classical IPSS low or intermediate-1 MDS? Blood. 2013;122(13):2286–2288. [DOI] [PubMed] [Google Scholar]
- 8.Kosmider O, Passet M, Santini V, et al. Are somatic mutations predictive of response to erythropoiesis stimulating agents in lower risk myelodysplastic syndromes? Haematologica. 2016;101(7):e280–283. [DOI] [PMC free article] [PubMed] [Google Scholar]
- 9.Ogata K, Nakamura K, Yokose N, et al. Clinical significance of phenotypic features of blasts in patients with myelodysplastic syndrome. Blood. 2002;100(12):3887–3896. [DOI] [PubMed] [Google Scholar]
- 10.Mathis S, Chapuis N, Debord C, et al. Flow cytometric detection of dyserythropoiesis: a sensitive and powerful diagnostic tool for myelodysplastic syndromes. Leukemia. 2013;27(10):1981–1987. [DOI] [PubMed] [Google Scholar]
- 11.Westers TM, Ireland R, Kern W, et al. Standardization of flow cytometry in myelodysplastic syndromes: a report from an international consortium and the European LeukemiaNet Working Group. Leukemia. 2012;26(7):1730–1741. [DOI] [PubMed] [Google Scholar]
- 12.Della Porta MG, Picone C, Pascutto C, et al. Multicenter validation of a reproducible flow cytometric score for the diagnosis of low-grade myelodysplastic syndromes: results of a European LeukemiaNET study. Haematologica. 2012;97(8):1209–1217. [DOI] [PMC free article] [PubMed] [Google Scholar]
- 13.Ogata K, Kishikawa Y, Satoh C, Tamura H, Dan K, Hayashi A. Diagnostic application of flow cytometric characteristics of CD34+ cells in low-grade myelodysplastic syndromes. Blood. 2006;108(3):1037–1044. [DOI] [PubMed] [Google Scholar]
- 14.Westers TM, Cremers EM, et al. Immunophenotypic analysis of erythroid dysplasia in myelodysplastic syndromes. A report from the IMDSFlow working group. Haematologica. 2017;102(2):308–319. [DOI] [PMC free article] [PubMed] [Google Scholar]
- 15.Tanno T, Bhanu NV, Oneal PA, et al. High levels of GDF15 in thalassemia suppress expression of the iron regulatory protein hepcidin. Nat Med. 2007;13(9):1096–1101. [DOI] [PubMed] [Google Scholar]
- 16.Tamary H, Shalev H, Perez-Avraham G, et al. Elevated growth differentiation factor 15 expression in patients with congenital dyserythropoietic anemia type I. Blood. 2008;112(13):5241–5244. [DOI] [PMC free article] [PubMed] [Google Scholar]
- 17.Lefebvre T, Dessendier N, Houamel D, et al. LC-MS/MS method for hepcidin-25 measurement in human and mouse serum: clinical and research implications in iron disorders. Clin Chem Lab Med. 2015;53(10): 1557–1567. [DOI] [PubMed] [Google Scholar]
- 18.Forejtnikova H, Vieillevoye M, Zermati Y, et al. Transferrin receptor 2 is a component of the erythropoietin receptor complex and is required for efficient erythropoiesis. Blood. 2010;116(24):5357–5367. [DOI] [PubMed] [Google Scholar]
- 19.Chesnais V, Arcangeli ML, Delette C, et al. Architectural and functional heterogeneity of hematopoietic stem/progenitor cells in non-del(5q) myelodysplastic syndromes. Blood. 2017;129(4):484–496. [DOI] [PubMed] [Google Scholar]
- 20.Park S, Fenaux P, Greenberg P, et al. Efficacy and safety of darbepoetin alpha in patients with myelodysplastic syndromes: a systematic review and meta-analysis. Br J Haematol. 2016;174(5):730–747. [DOI] [PMC free article] [PubMed] [Google Scholar]
- 21.Platzbecker U, Symeonidis A, Oliva EN, et al. A phase 3 randomized placebo-controlled trial of darbepoetin alfa in patients with anemia and lower-risk myelodysplastic syndromes. Leukemia. 2017;31(9):1944–1950. [DOI] [PMC free article] [PubMed] [Google Scholar]
- 22.Delaby C, Pilard N, Goncalves AS, Beaumont C, Canonne-Hergaux F. Presence of the iron exporter ferroportin at the plasma membrane of macrophages is enhanced by iron loading and down-regulated by hepcidin. Blood. 2005;106(12):3979–3984. [DOI] [PubMed] [Google Scholar]
- 23.Nemeth E, Tuttle MS, Powelson J, et al. Hepcidin regulates cellular iron efflux by binding to ferroportin and inducing its internalization. Science. 2004;306(5704):2090–2093. [DOI] [PubMed] [Google Scholar]
- 24.Casanovas G, Vujic Spasic M, Casu C, Rivella S, et al. The murine growth differentiation factor 15 is not essential for systemic iron homeostasis in phlebotomized mice. Haematologica. 2013;98(3):444–447. [DOI] [PMC free article] [PubMed] [Google Scholar]
- 25.Santini V, Girelli D, Sanna A, et al. Hepcidin levels and their determinants in different types of myelodysplastic syndromes. PLoS One. 2011;6(8):e23109. [DOI] [PMC free article] [PubMed] [Google Scholar]
- 26.Kautz L, Jung G, Du X, et al. Erythroferrone contributes to hepcidin suppression and iron overload in a mouse model of beta-thalassemia. Blood. 2015;126(17):2031–2037. [DOI] [PMC free article] [PubMed] [Google Scholar]
- 27.Ramirez JM, Schaad O, Durual S, et al. Growth differentiation factor 15 production is necessary for normal erythroid differentiation and is increased in refractory anaemia with ringsideroblasts. Br J Haematol. 2009;144(2):251–262. [DOI] [PubMed] [Google Scholar]
- 28.Lefebvre T, Lasocki S, Feneant-Thibault M, et al. Added value of hepcidin quantification for the diagnosis and follow-up of anemia-related diseases. Ann Biol Clin (Paris). 2017;75(1):9–18. [DOI] [PubMed] [Google Scholar]
- 29.van der Vorm LN, Hendriks JC, Laarakkers CM, et al. Toward worldwide hepcidin assay harmonization: identification of a commutable secondary reference material. Clin Chem. 2016;62(7):993–1001. [DOI] [PubMed] [Google Scholar]
- 30.Meunier M, Ancelet S, Lefebvre C, et al. Reactive oxygen species levels control NF-kappaB activation by low dose deferasirox in erythroid progenitors of low risk myelodysplastic syndromes. Oncotarget. 2017;8(62):105510–105524. [DOI] [PMC free article] [PubMed] [Google Scholar]
- 31.Westers TM, Alhan C, Chamuleau ME, et al. Aberrant immunophenotype of blasts in myelodysplastic syndromes is a clinically relevant biomarker in predicting response to growth factor treatment. Blood. 2010;115(9):1779–1784. [DOI] [PubMed] [Google Scholar]
- 32.Alhan C, Westers TM, Cremers EM, et al. High flow cytometric scores identify adverse prognostic subgroups within the revised International Prognostic Scoring System for myelodysplastic syndromes. Br J Haematol. 2014;167(1):100–109. [DOI] [PubMed] [Google Scholar]
- 33.Alhan C, Westers TM, van der Helm LH, et al. Absence of aberrant myeloid progenitors by flow cytometry is associated with favorable response to azacitidine in higher risk myelodysplastic syndromes. Cytometry B Clin Cytom. 2014;86(3):207–215. [DOI] [PubMed] [Google Scholar]
- 34.Valent P, Orazi A, Steensma DP, et al. Proposed minimal diagnostic criteria for myelodysplastic syndromes (MDS) and potential pre-MDS conditions. Oncotarget. 2017;8(43):73483–73500. [DOI] [PMC free article] [PubMed] [Google Scholar]
Associated Data
This section collects any data citations, data availability statements, or supplementary materials included in this article.


