

Abstract
Background:
Obese adults who free from metabolic risk factors may develop risk factors over time. Our objective was to characterize development of obesity and duration of metabolically-healthy-obese (MHO) over 30 years.
Methods:
Participants in CARDIA who developed obesity (BMI ≥ 30 kg/m2) at follow up exams 7, 10, 15, 20, 25 and 30 were analyzed. MHO was defined as obese and having 0 or 1 risk factor: ≥SBP/DBP 130/85mmHg; fasting glucose ≥100mg/dL/5.55mmol/L; fasting triglycerides (≥150 mg/dL/1.69mmol/L); and HDL-C (men <40mg/dL/1.036mmol/L, women <50mg/dL/1.295mmol/L) or on any medication(s) for these conditions. MHO duration (yrs) and obesity duration (yrs) were estimated for each subsequent time-point; and an overall cumulative duration was also calculated over available follow-up. MHO duration (%) was approximated as MHO duration ÷ obesity duration. Stable MHO was defined as 100% MHO duration over follow-up, while transient MHO was defined as <1–99%. Chi-squared tests were used to compare proportions by sex and race across obesity phenotypes. Multivariable adjusted ANCOVA adjusting for baseline BMI, age, race, sex, and was used to analyze obesity duration in all individuals who developed obesity, and also compare MHO duration (%) across race and sex in transient MHO individuals.
Results:
Of the 987 eligible participants who developed obesity, 51% were African American (AA), 56% were women. Higher percentages of AA were classified as transient MHO, and higher proportions of females were MHO (both p<0.0001). Obesity duration (yrs) was higher in transient MHO compared with stable MHO (mean difference: 6.2 ± 0.5 yrs, p<0.0001). Of those with transient MHO, African Americans (51.4 ± 1.6%) were more likely to have longer MHO duration compared to Caucasians (44.4 ± 1.9%, p=0.005).
Conclusion:
MHO status can be a transient phenotype which differs by sex and race. Future studies are needed to explore modifiable lifestyle/behavioral predictors associated with longer MHO duration.
Introduction
Obesity is a complex condition exhibiting considerable phenotypic variation. While obese adults are more likely to have multiple abnormal cardiovascular and metabolic risk factors (metabolically “unhealthy” obese) (1), obese individuals may also be metabolically “healthy” obese (MHO) and demonstrate favorable blood pressure, lipid profiles and greater insulin sensitivity (2–6).
Individuals with MHO are more likely to develop cardiometabolic abnormalities over time compared with normal weight healthy individuals (7, 8), suggesting that MHO status may be a dynamic or transient phenotype. Adults who transitioned from MHO to metabolically unhealthy obesity were more likely to be male, smokers, have a higher body mass index (BMI), and older age (9); however, the influence of race has not been investigated, despite evidence that African American adults have documented health disparities with increased vulnerability to both clustering of cardiometabolic risk factors(10) and obesity(11).
Some authors hypothesize that MHO simply reflects stratification of obesity by different levels of “exposure” where increased risk may be related to an earlier onset of obesity, severity and/or duration of obesity (12–14). Previous studies show that after a period of 6 years, 37% of MHO individuals transitioned to metabolically unhealthy obesity in a Spanish cohort (15). However, after a mean follow-up of 8 years, 48% transitioned in a white and Hispanic U.S. cohort (16), which may suggest that with longer follow-up time, there may be an increased number of individuals progressing from MHO state to metabolically unhealthy obesity. However, a major limitation in the existing literature is that all of the aforementioned studies’ participants were already obese at baseline, so the duration of both obesity and phenotypes (metabolically healthy or unhealthy) in these individuals is unknown. Finally, studies typically have a follow-up shorter than 10 years, with only a single follow-up measure, thus a life-course trajectory of these obesity phenotypes cannot be established. Therefore, a better understanding of MHO duration (i.e., length of time an individual spent in MHO state) and stability (stable or transient phenotype) is needed over the life-course (17).
To address the current limitations, the purpose of this study was to 1) quantify MHO duration and stability from development of obesity over 30 years and 2) explore possible race and/or sex differences in MHO stability. Since individuals with MHO are more likely to be female and African American (18), we hypothesize that women and African American race have longer MHO duration.
Methods
We utilized the CARDIA cohort to examine the development of obesity from baseline, and to establish MHO duration and stability over a 30 year follow-up period. CARDIA was initiated in 1985–1986 with enrollment of 5115 African American and Caucasian adults, aged 18–30 years, residing in Birmingham, AL, Chicago, IL, Minneapolis, MN, and Oakland, CA. Details of the study design, protocol and procedures have been reported elsewhere (19). Baseline enrollment at each site was balanced and stratified by sex, race/ethnicity, age group, and attained educational level. All participants signed informed consent prior to data collection and all procedures were IRB approved at each participating institution. After baseline assessment, participants were followed up with examination cycles at 2, 5, 7, 10, 15, 20, 25 and year 30 years, with 91%, 86%, 81%, 79%, 74%, 72%, 72% and 71 (n=3358), of the surviving cohort returning for examination, respectively.
Race/ethnicity was obtained from the baseline questionnaire and verified at exam 2. Age, medications, pregnancy status and lactation status were obtained through questionnaire at each exam cycle. Height and weight were measured from participants in light clothing without shoes. BMI was calculated by dividing weight in kg by height in meters squared, and obesity was defined as ≥30 kg/m2 (20). Cardiometabolic risk factors were assessed at each exam (except glucose which was not measured at exam years 2 and 5) according to standard CARDIA procedures (19). Blood pressure (BP) was measured in triplicate, after 5 minutes of rest, one minute apart, from the right arm using a Hawksley random-zero sphygmomanometer until year 15, and subsequently using an oscillometer with values calibrated to the random-zero sphygmomanometer. Participants were instructed to fast for ≥12 hours before phlebotomy. Blood was drawn into EDTA vacutainers, separated into plasma and serum, and frozen until analysis. Descriptions of the lipid/metabolic measurement and quality control have been previously reported (21). Plasma cholesterol and triglycerides were measured using enzymatic procedures (22), glucose was measured with hexokinase method, and high density lipoprotein cholesterol (HDL) after precipitation with dextrate sulfate/magnesium chloride (23).
For the current analysis, we excluded individuals who were identified as obese at baseline (BMI ≥ 30 kg/m2; n=235), and/or had bariatric surgery during follow-up (n=62). We established the following criteria for inclusion:1) individuals who developed obesity at follow-up exams during years 7, 10, 15, 20, 25, and 30; 2) had at least one follow-up visit to establish obesity and/or MHO duration; and 3) had cardiometabolic data to establish phenotype (n=989). Since follow-up exams 2 and 5 did not have glucose data collected, these examinations were excluded from this analysis. Participants with missing baseline BMI (n=2) were also excluded from the final sample. If a woman was pregnant or breastfeeding at a particular follow-up exam, that specific exam’s data for BMI and cardiometabolic data were set to missing. However, if that same woman was obese at any other timepoint, and she was not identified as pregnant and/or breastfeeding, she was included in the sample. After all of these exclusions, the final sample analyzed included n=987 participants.
MHO phenotype definition
An MHO individual was defined as an obese individual (BMI ≥30 kg/m2) (20), who was not pregnant or breastfeeding at time of exam, with 0 or 1 abnormal risk factor as determined from the following variables: Systolic blood pressure/Diastolic blood pressure ≥ 130/85 mmHg, glucose ≥100 mg/dL or 5.55 mmol/L; fasting triglycerides (≥150 mg/dL or 1.69mmol/L); and HDL-C (men <40mg/dL or 1.036mmol/L, women <50mg/dL or 1.295mmol/L), or taking medications to treat diabetes (24, 25). Metabolically unhealthy obesity was defined as obese individuals in the non-pregnant and non-lactating state with ≥ 2 risk factors. Obesity phenotype status was assessed at each follow-up exam, except years 2 and 5 when glucose data were not available.
Obesity duration
Obesity duration was calculated starting from the exam date on which obesity was first identified (after baseline assessment) and summed over the period that participant remained obese, to the last available clinical examination date. To account for the possibility that the actual development of obesity could have occurred between exam dates, and not precisely at the actual exam date, we approximated obesity duration as half of the period between the two exams where the participant was non-obese, and the subsequent exam where obesity onset was identified. If a participant who developed obesity then reverted to become non-obese during another follow-up exam, we subtracted one half of the duration between the last exam date where obesity status was identified and the subsequent exam date on which non-obesity recorded. The duration of obesity for participants who died or were lost to follow-up were censored at the last available clinical examination date which obesity was confirmed. If a person was found to be obese during one single follow-up visit (i.e., year 7), then duration was calculated as one half the duration of adjacent (before and after) exam visit dates. If a participant was found to be obese only at year 30 during the final follow-up visit, then their duration of was set to one half the duration between the year 30 and year 25 exam dates (i.e., 2.5 years). For this study, the range of obesity duration was 2.5–26.5 years.
MHO Duration
MHO duration was calculated as the time in years that a person had both obesity and healthy cardiometabolic risk status. If a person was identified as MHO at any follow-up exam, a duration could be assigned as the number of years between the initial MHO exam date and final MHO status exam date. MHO may be a dynamic status, therefore, if at a subsequent exam a person is observed to have transitioned to metabolically unhealthy obese or non-obese state, then obesity duration was estimated using the midpoint between the two adjacent exam dates. Once an obese person was identified at an exam cycle as metabolically unhealthy, MHO duration was censored at that exam date. MHO duration was defined as the sum the period over the relevant dates between which the person was classified as MHO. For this study, the minimum MHO duration was 0 years (metabolically unhealthy status throughout follow-up), and the maximum MHO duration was 26.5 years.
Since individuals could vary in obesity duration, we defined the primary outcome as a proportion of MHO duration relative to obesity duration, i.e., MHO duration (%) = 100 * [MHO duration (years) ÷ obesity duration (years)].
Metabolically unhealthy obesity was defined as a person who had 0% MHO duration. Stable MHO was defined as a person who remained MHO for the entire duration of their obesity (MHO duration = 100%). Transient MHO was defined as a person who transitioned from MHO to either non-obese or metabolically unhealthy obesity (MHO duration = 1–99.9%).
Statistical Analysis
A Chi-squared test was used to compare sex and race across obesity phenotypes (stable MHO, transient MHO, and metabolically unhealthy obesity). Multivariable adjusted analysis of covariance (ANCOVA) was used to compared obesity duration (years) between obesity phenotypes. ANCOVA models were adjusted for baseline BMI, baseline age, sex, and race.
We also computed the proportion of obese individuals who remained stable MHO through the rest of the available follow-up; we reported their total duration as stable MHO. To examine possible race and sex differences in MHO duration (%) in transient MHO individuals, multivariable adjusted ANCOVA was used adjusting for baseline age and baseline BMI and least squared means ± SE are reported. Since the race*sex interaction term in ANCOVA models did not attain statistical significance, we fitted main effects only models in which race, sex and race*sex were entered as covariates. Menopausal status was included in the original models as a covariate, but it was not significant in any of the analyses and removed from the final models.
Since many individuals had several time points where obesity and metabolic status were available, we wanted to examine MHO duration without censoring at the first occurrence of metabolically unhealthy obesity to account for the possibility that individuals may transition more than once between obesity phenotypes (ie., MHO at year 10, metabolically unhealthy obesity at year 15, MHO at year 25). Therefore, we re-calculated MHO duration as any period when an individual was MHO, regardless of their previous status (i.e., transitioning from metabolically unhealthy obesity to MHO). We conducted a sensitivity ANCOVA analysis for transient MHO individuals in which MHO duration was not censored after the first identified transition from MHO to metabolically unhealthy obesity.
All statistical analyses were performed using SAS software version 9.3 (SAS Institute, Cary, NC). A p-value <0.05 was considered statistically significant.
Results
Of the 987 eligible participations, 51% of the sample was African American and 56% were women. Table 1 displays cardiometabolic risk factors at baseline and year 30 of the total sample. Mean (±SD) age at baseline and at year 30 was 25.0 ± 3.7 years, and 55.0 ± 3.7 years, respectively. Mean BMI at baseline was 24.9 ± 2.8 kg/m2 and 34.2 ± 5.2 kg/m2 at year 30. Mean age of onset for obesity was 41.0 ± 8.9 years, and the distribution of obesity onset across age groups shows the majority of individuals having onset between 30.0–49.9 years of age.
Table 1.
Baseline and 30-year characteristics of CARDIA sample (n=987) who developed obesity during follow-up.
| N | 987 |
|---|---|
| Female n (%) | 554 (56) |
| African American n (%) | 507 (51) |
| Age (years) Baseline | 25.0 ± 3.7 |
| Year 30 | 55.0 ± 3.7 |
| Age of Obesity Onset (mean) | 41.0 ± 8.9 |
| <30 years n (%) | 101 (10) |
| 30–39.9 years n (%) | 368 (37) |
| 40–49.9 years n (%) | 309 (32) |
| ≥50 years n (%) | 209 (21) |
| BMI (kg/m2) Baseline | 24.9 ± 2.8 |
| Year 30 | 34.2 ± 5.2 |
| Change in BMI (kg/m2) | 9.4 ± 5.2 |
| Systolic BP (mmHg) Baseline | 110.2 ± 10.3 |
| Year 30 | 123.1 ± 16.4 |
| Diastolic BP (mmHg) Baseline | 67.9 ± 9.2 |
| Year 30 | 76.3 ± 10.4 |
| Glucose (mg/dL;mmol/L) Baseline | 82.0 ± 8.6; 4.55 ± 0.48 |
| Year 30 | 107.7 ± 34.1; 5.98 ± 1.89 |
| Triglycerides (mg/dL; mmol/L) Baseline | 71.5 ± 43.4; 0.81 ± 0.49 |
| Year 30 | 122.8 ± 128.9; 1.39 ± 1.46 |
| HDL-Cholesterol (mg/dL; mmol/L) Baseline | 52.6 ± 12.2; 1.36 ± 0.32 |
| Year 30 | 54.4 ± 15.8; 1.41 ± 0.41 |
| Medication Use n(%) Baseline | 5 (0.5%) |
| Year 30 | 454 (46%) |
| Obesity Duration (years) | 14.8 ± 8.0 |
| 2.5–4.9 years n (%) | 106 (10) |
| 5–9.9 years n (%) | 208 (21) |
| 10–14.9 years n (%) | 180 (18) |
| 15–19.9 years n (%) | 186 (19) |
| 20–25 years | 133 (13) |
| ≥ 25 years | 174 (18) |
| MHO duration (years) | 7.2 ± 7.5 |
| MHO duration (%) mean | 50.5 ± 42.8 |
| 0% n (%) | 324 (33) |
| 1–24.9% n (%) | 55 (5) |
| 25–49.9% n (%) | 96 (10) |
| 50–74.9% n (%) | 136 (14) |
| 75–99.9% n (%) | 35 (3) |
| 100% n (%) | 341 (35) |
unadjusted means ± SD
The number of individuals who became obese approximately tripled from n=276 (7.8%) at year 7, to n=864 (28.7%) at year 30 (Table 2). The MHO prevalence decreased from 77% at year 7 to 49% in year 30 (Table 2).
Table 2:
Prevalence of Obesity and MHO at each CARDIA exam cycle among participants who developed obesity during at least one follow-up exam over 30 years follow-up.
| Total Sample* | Obese (n) | Obesity Prevalence (%) |
MHO (n) | MHO Prevalence (%) |
|
|---|---|---|---|---|---|
| Year 0 | 4520 | 0 | 0 | 0 | 0 |
| Year 7 | 3537 | 276 | 7.8 | 213 | 77 |
| Year 10 | 3446 | 343 | 10 | 243 | 71 |
| Year 15 | 3212 | 534 | 16.6 | 341 | 64 |
| Year 20 | 3141 | 667 | 21.2 | 344 | 52 |
| Year 25 | 3096 | 790 | 25.5 | 374 | 47 |
| Year 30 | 3015 | 864 | 28.7 | 420 | 49 |
Total sample includes any individual who was not identified as obese at baseline and had complete data for BMI, and cardiometabolic risk factors (blood pressure, triglycerides, glucose and HDL-cholesterol).
Of 987 individuals who developed obesity over 30 years, 324 (33%) were identified as the metabolically unhealthy obesity phenotype (MHO duration = 0%), while 663 (67%) are identified as MHO for at least 1 follow-up visit. Of those who were identified as MHO, n=341 (52%) were classified with a stable MHO phenotype (100% MHO duration), while n= 322 (48%) have a transient MHO phenotype (unadjusted MHO duration = 49.0 ± 21.2%) (Table 3).
Table 3.
Frequencies of race and sex among obesity phenotypes in individuals who developed obesity over 30 years in CARDIA (n=987).
| Obesity Phenotype | N (% of Total Obese; % MHO) |
African American n (%)* |
Female n (%)^ |
|---|---|---|---|
| Stable MHO | 341 | 169 (50) | 231 (68) |
| (34% obese; 52% MHO) | |||
| Transient MHO | 322 | 198 (61) | 191 (60) |
| (32% obese; 48% MHO) | |||
|
Metabolically Unhealthy Obesity |
324 | 140 (43) | 132 (41) |
| (32% obese; 0% MHO) |
Stable: MHO duration = 100%; Transient: MHO duration 1–99%.
Chi squared test for comparison of obesity phenotypes by race: p<0.0001
Chi-squared test for comparison of obesity phenotypes by sex: p<0.0001
A proportion of the sample were stable MHO throughout the period of observation. For those initially obese at Year 7, 51.8% (143/276) were stable MHO for ≥10 years; 22.4% (62/276) were stable MHO for ≥20 years. Similar for individuals initially obese at Year 10, 41.4% (51/123) were stable MHO for ≥ 10 years; while 26.8% (33/123) were stable MHO for 15 years. Of individuals first identified as obese at year 15, 41.8% (76/182) were stable MHO for ≥10 years; 21.4% (39/182) were stable MHO for ≥15 years. For individuals first identified as obese at Year 20, 36.4% (55/151) were stable MHO for ≥10 years; and among first obese at Year 25, 57.8% (89/154) were stable MHO for ≥ 5 years.
Frequencies of obesity phenotypes by race and sex are presented in Table 3. African Americans were more likely to be classified as transient MHO, and less likely to be classified as metabolically unhealthy obese. Females were more likely to classified as transient MHO or stable MHO and less likely to be classified as metabolically unhealthy obese (all p<0.0001).
Transient MHO had longer multivariable adjusted obesity duration compared with stable MHO (difference: 6.2 ± 0.5 years, p<0.0001), and compared with metabolically unhealthy obese (difference: 5.2 ± 0.5 years p<0.0001), suggesting that participants who had obesity for a longer period of time are more likely to develop risk factors. There was borderline differences between obesity duration for stable MHO and metabolically unhealthy obesity phenotypes (p=0.054) (Figure 1). The change in BMI from year 30 to baseline was significantly different between all three phenotypes (p<0.03) with MHO transient having the highest change at 11.1 ± 6.0 kg/m2, MHO stable at 8.9 ± 4.4 kg/m2, and metabolically unhealthy obesity at 8.1 ± 4.4 kg/m2.
Figure 1.
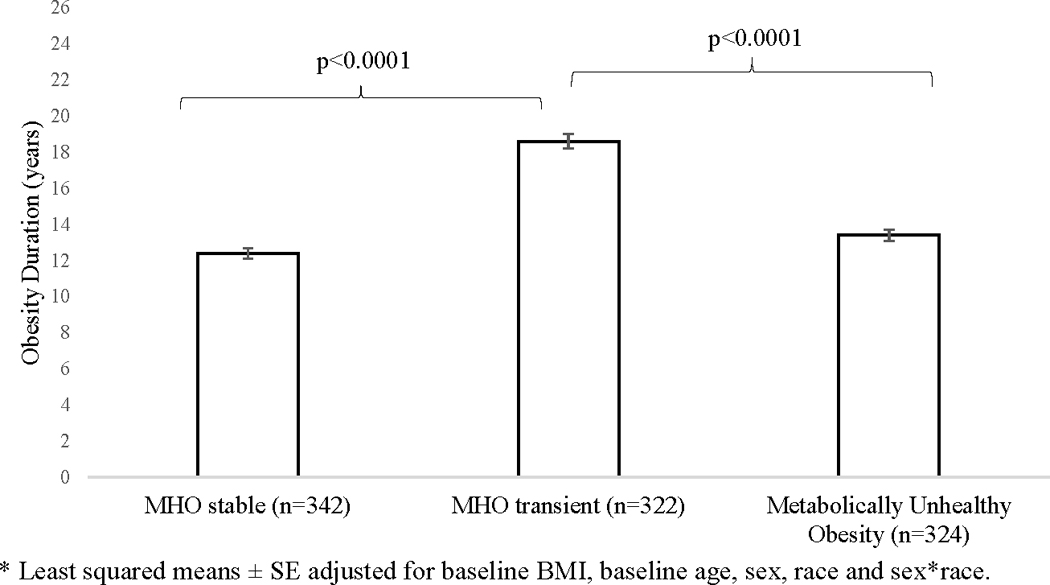
Multivariable-adjusted* obesity duration among obese CARDIA participants by obesity phenotype groups (n=987) over 30 years.
For individuals with transient MHO (n=322), prevalence of abnormal individual cardiometabolic risk factors were as follows: glucose (before transition: 46.5%, at transition: 73.3%; change: +26.7%), blood pressure (before transition: 47.2%, at transition: 65.7%; change: +18.6%), triglycerides (before transition: 37.1%, at transition: 48.7%; change: +11.6%), and HDL-cholesterol (before transition: 50.6%, at transition: 59.4%; change: +8.8%). For those with transient MHO, African Americans were more likely to have longer MHO duration (51.4 ± 1.6%) compared with Caucasian individuals (44.4 ± 1.9%, p=0.005), with no significant differences between men and women (p=0.98) (Figure 2).
Figure 2.
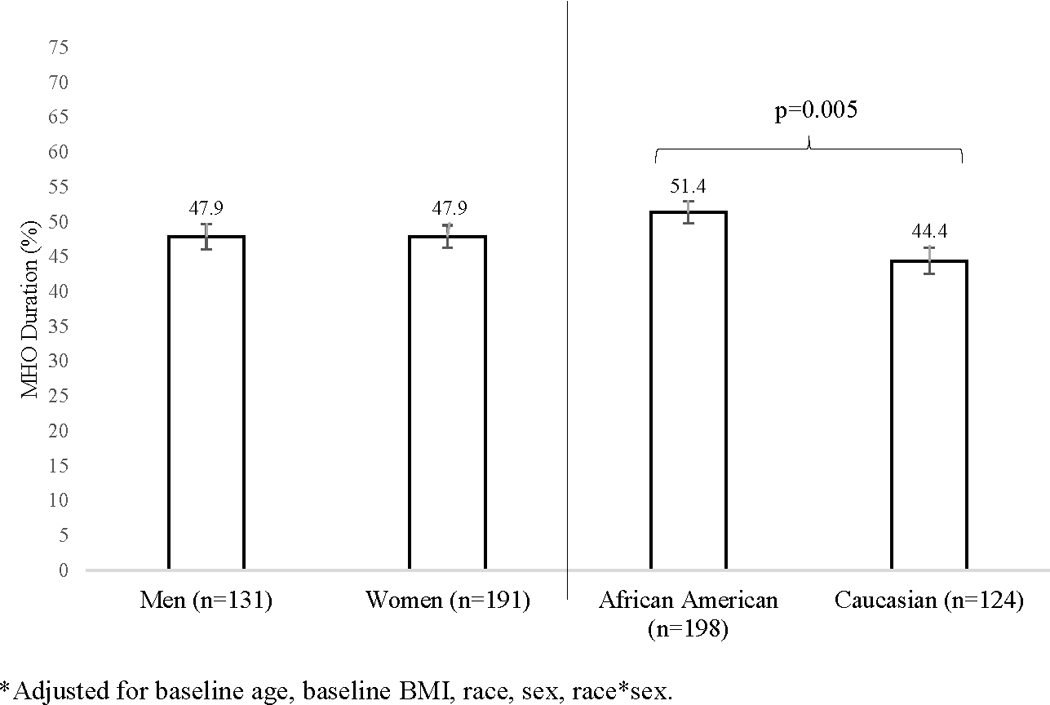
Sex and race comparisons for MHO duration* (%) among CARDIA participants with transient MHO (n=322).
The sensitivity analysis (in which MHO duration was not censored after 1st transition to metabolically unhealthy obesity) showed consistent race results in individuals with transient MHO: African Americans had longer MHO duration compared to Caucasians. However, significant sex difference were seen: women had longer MHO duration compared to men (53.0 ± 1.4% vs 48.3 ± 1.5%, p=0.03).
Discussion
We quantified MHO duration and stability using a unique dataset, with repeat exam cycles spanning over 30 years. MHO individuals may represent a transient phenotype where approximately 2/3 of young adults who became obese were identified as MHO for at least 1 follow-up visit. Approximately half of these adults transitioned from MHO to metabolically unhealthy obesity. Those who transitioned from MHO to metabolically unhealthy obesity also had longer obesity duration and were more likely to be African American. While many individuals who began as MHO did transition to metabolically unhealthy obesity over time, the proportion of people who were stable MHO for ≥10 years (36–52%) or even ≥15 years was not negligible (21–27%).
Several previous studies provided evidence that MHO is a transient phenotype (9, 15, 16, 26, 27). Only two other studies followed participants with multiple phenotype assessments for more than 10 years (26, 28). Bell et al., found that after 20 years, approximately one half of MHO were stable, which is consistent with our current findings. Eckel et al., found that a large proportion of metabolically healthy women from the Nurses’ Health Study converted to an unhealthy phenotype over 30 years across all BMI categories, which was also associated with an increased cardiovascular disease risk (28). Zamrazilova et al., found that adolescents with the MHO phenotype had earlier onset and shorter duration of obesity, however, defining both onset and duration of obesity with regards to MHO stability are to date, not available for adults (12). We also found that the transient MHO phenotype displayed a longer obesity duration, indicating that the longer a person is obese, the more likely they are to transition from metabolically healthy to unhealthy.
Our research shows that women are more likely to have the MHO phenotype (stable and transient); while men were more likely to be metabolically unhealthy obese. Previous studies had findings similar to ours and have shown that individuals with MHO were more likely to be female (7, 9) and those who transition to metabolically unhealthy obesity were more likely to be male (9, 27). However, previous scientific literature on MHO stability in men versus women included only a single follow-up assessment. Our study findings are unique since we quantified the development and onset of obesity and examined the transition between men and women over multiple time points spanning over 30 years of follow-up. When we censored MHO duration to the first transition to metabolically unhealthy obesity in our original analysis, we found no statistically significant differences between men and women. However, when we allowed any period of MHO to occur over the course of obesity (uncensored sensitivity analysis), women had significantly longer duration of MHO (%), indicating a longer MHO duration (years) over the same period of obesity. This sensitivity analysis suggests that women may transition bi-directionally in and out of MHO multiple times over the course of their obesity status, whereas men transition uni-directionally from MHO to metabolically unhealthy.
Current research that examines stability or transition of MHO were mostly conducted in populations of European descent (7, 15, 26, 27) or Asian descent (8, 9). One study compared Mexican Americans versus non-Hispanic whites found no significantly different transition of MHO to metabolically unhealthy obesity by ethnicity (16). However, prior to our investigation, no other studies have examined MHO duration in a cohort that includes African Americans. African American individuals is of particular importance due to their documented health disparities and increased vulnerability to both cardiometabolic risk factor clustering (10) and obesity (11), however, research also reveals African Americans are more likely to be MHO (18). Our analyses showed that higher proportions of African Americans have transient MHO (vs. stable MHO), and that African Americans with transient MHO have longer MHO durations compared to Caucasians. Further studies are needed to replicate our findings, as well as understand how transient MHO and MHO duration relates to specific disease outcomes in diverse populations including men and women, as well as multiple race/ethnicities.
A standard MHO definition does not currently exist, and as many as 15 different definitions have been used to date (29), which makes findings and conclusions difficult to interpret, compare and contrast across studies (30). Although we selected our definition based on recommendations to include practical and clinically relevant measures for lipids and blood pressure that were measured in CARDIA throughout 30 years (5, 31), our approach had noteworthy limitations. As previously mentioned, glucose data were unavailable at years 2 and 5, and thus, we were not able to identify phenotypes at these exam cycles. In addition, data were collected approximately every 3–5 years, and thus we elected to estimate the transition of obesity and/or MHO as halfway duration between time points. Since the obesity onset could “occur” at any follow-up exam, there was variability in MHO and obesity duration. To account for this heterogeneity, our primary outcome of interest (MHO duration) was expressed as a relative fraction of obesity duration. Finally, we did not account for duration of metabolic health status when the person was not also obese, thus, unhealthy metabolic health could precede obesity status. However, our focus for this current paper was to define stability of obesity phenotypes and we were able to account for the development of obesity and duration and stability within obesity phenotype.
Despite these limitations, the CARDIA cohort is well suited for this investigation for several reasons. The data set reflects a richly characterized biracial cohort initiated in 1985 just as the obesity epidemic in the U.S. began (32) As shown in this current study, approximately 14% of participants were identified as obese at year 7, and by year 30, approximately 40% were obese. (33). We were able to follow non-obese individuals every 3–5 years over 30 years to examine the development of obesity phenotypes and utilize multiple exam cycles to explore the phenotype trajectory. Finally, the length of follow-up has been identified as a critical aspect when examining future disease risk for population subgroups (34) and recommendations are to have ≥10 year time lag to see the effect of cardiometabolic risk on health (35), thus, CARDIA’s 30 years of follow-up is an ideal dataset to describe MHO duration and stability.
In conclusion, we were able to quantify and define MHO duration and stability over 30 years. MHO can be a temporary or transient phenotype and future research should account for MHO duration or “exposure”. Future research is needed to explore how MHO duration relates to chronic disease outcomes such as CVD and diabetes morbidity and mortality, as well as explore possible predictors for longer MHO duration and/or stability such as parity and/or modifiable lifestyle behaviors such as physical activity and dietary intake.
Acknowledgement:
The Coronary Artery Risk Development in Young Adults Study (CARDIA) is conducted and supported by the National Heart, Lung, and Blood Institute (NHLBI) in collaboration with the University of Alabama at Birmingham (HHSN268201300025C & HHSN268201300026C), Northwestern University (HHSN268201300027C), University of Minnesota (HHSN268201300028C), Kaiser Foundation Research Institute (HHSN268201300029C), and Johns Hopkins University School of Medicine (HHSN268200900041C). CARDIA is also partially supported by the Intramural Research Program of the National Institute on Aging (NIA) and an intra-agency agreement between NIA and NHLBI (AG0005). This manuscript has been reviewed by CARDIA for scientific content.
Footnotes
Conflicts of Interest
No authors have any conflict of interests to report.
References
- 1.Park YW, Zhu S, Palaniappan L, Heshka S, Carnethon MR, Heymsfield SB. The metabolic syndrome: prevalence and associated risk factor findings in the US population from the Third National Health and Nutrition Examination Survey, 1988–1994. ArchInternMed 2003;163(4):427–36. [DOI] [PMC free article] [PubMed] [Google Scholar]
- 2.Brochu M, Tchernof A, Dionne IJ, Sites CK, Eltabbakh GH, Sims EA, et al. What are the physical characteristics associated with a normal metabolic profile despite a high level of obesity in postmenopausal women? J Clin Endocrinol Metab 2001;86(3):1020–5. [DOI] [PubMed] [Google Scholar]
- 3.Karelis AD, St-Pierre DH, Conus F, Rabasa-Lhoret R, Poehlman ET. Metabolic and body composition factors in subgroups of obesity: what do we know? J Clin Endocrinol Metab 2004;89(6):2569–75. [DOI] [PubMed] [Google Scholar]
- 4.Sims EA. Are there persons who are obese, but metabolically healthy? Metabolism 2001;50(12):1499–504. [DOI] [PubMed] [Google Scholar]
- 5.Karelis AD, Brochu M, Rabasa-Lhoret R. Can we identify metabolically healthy but obese individuals (MHO)? Diabetes & metabolism 2004;30(6):569–72. [DOI] [PubMed] [Google Scholar]
- 6.Marini MA, Succurro E, Frontoni S, Hribal ML, Andreozzi F, Lauro R, et al. Metabolically healthy but obese women have an intermediate cardiovascular risk profile between healthy nonobese women and obese insulin-resistant women. Diabetes Care 2007;30(8):2145–7. [DOI] [PubMed] [Google Scholar]
- 7.Appleton SL, Seaborn CJ, Visvanathan R, Hill CL, Gill TK, Taylor AW, et al. Diabetes and cardiovascular disease outcomes in the metabolically healthy obese phenotype: a cohort study. Diabetes Care 2013;36(8):2388–94. [DOI] [PMC free article] [PubMed] [Google Scholar]
- 8.Chang Y, Ryu S, Suh BS, Yun KE, Kim CW, Cho SI. Impact of BMI on the incidence of metabolic abnormalities in metabolically healthy men. Int J Obes (Lond) 2012;36(9):1187–94. [DOI] [PubMed] [Google Scholar]
- 9.Heianza Y, Kato K, Kodama S, Suzuki A, Tanaka S, Hanyu O, et al. Stability and changes in metabolically healthy overweight or obesity and risk of future diabetes: Niigata wellness study. Obesity (Silver Spring) 2014;22(11):2420–5. [DOI] [PubMed] [Google Scholar]
- 10.Roger VL, Go AS, Lloyd-Jones DM, Benjamin EJ, Berry JD, Borden WB, et al. Heart disease and stroke statistics−−2012 update: a report from the American Heart Association. Circulation 2012;125(1):e2–e220. [DOI] [PMC free article] [PubMed] [Google Scholar]
- 11.Ogden CL, Carroll MD, Curtin LR, McDowell MA, Tabak CJ, Flegal KM. Prevalence of overweight and obesity in the United States, 1999–2004. JAMA 2006;295(13):1549–55. [DOI] [PubMed] [Google Scholar]
- 12.Zamrazilova H, Weiss R, Hainer V, Aldhoon-Hainerova I. Cardiometabolic Health in Obese Adolescents Is Related to Length of Obesity Exposure: A Pilot Study. J Clin Endocrinol Metab 2016;101(8):3088–95. [DOI] [PubMed] [Google Scholar]
- 13.McEvoy JW, Blaha MJ, Nasir K. “Metabolically benign” obesity: a wolf in sheep’s clothing. Atherosclerosis 2011;217(1):74–6. [DOI] [PubMed] [Google Scholar]
- 14.Janssen I, Katzmarzyk PT, Ross R. Duration of overweight and metabolic health risk in American men and women. Ann Epidemiol 2004;14(8):585–91. [DOI] [PubMed] [Google Scholar]
- 15.Soriguer F, Gutierrez-Repiso C, Rubio-Martin E, Garcia-Fuentes E, Almaraz MC, Colomo N, et al. Metabolically healthy but obese, a matter of time? Findings from the prospective Pizarra study. J Clin Endocrinol Metab 2013;98(6):2318–25. [DOI] [PubMed] [Google Scholar]
- 16.Achilike I, Hazuda HP, Fowler SP, Aung K, Lorenzo C. Predicting the development of the metabolically healthy obese phenotype. Int J Obes (Lond) 2014. [DOI] [PMC free article] [PubMed] [Google Scholar]
- 17.Karelis AD. To be obese--does it matter if you are metabolically healthy? Nat Rev Endocrinol 2011;7(12):699–700. [DOI] [PubMed] [Google Scholar]
- 18.Wildman RP, Muntner P, Reynolds K, McGinn AP, Rajpathak S, Wylie-Rosett J, et al. The obese without cardiometabolic risk factor clustering and the normal weight with cardiometabolic risk factor clustering: prevalence and correlates of 2 phenotypes among the US population (NHANES 1999–2004). Arch Intern Med 2008;168(15):1617–24. [DOI] [PubMed] [Google Scholar]
- 19.Friedman GD, Cutter GR, Donahue RP, Hughes GH, Hulley SB, Jacobs DR, Jr., et al. CARDIA: study design, recruitment, and some characteristics of the examined subjects. Journal of clinical epidemiology 1988;41(11):1105–16. [DOI] [PubMed] [Google Scholar]
- 20.Executive summary of the clinical guidelines on the identification, evaluation, and treatment of overweight and obesity in adults. ArchInternMed 1998;158(17):1855–67. [DOI] [PubMed] [Google Scholar]
- 21.Donahue RP, Jacobs DR Jr., Sidney S, Wagenknecht LE, Albers JJ, Hulley SB Distribution of lipoproteins and apolipoproteins in young adults The CARDIA Study. Arteriosclerosis 1989;9(5):656–64. [DOI] [PubMed] [Google Scholar]
- 22.Warnick GR. Enzymatic methods for quantification of lipoprotein lipids. Methods Enzymol 1986;129:101–23. [DOI] [PubMed] [Google Scholar]
- 23.Warnick GR, Benderson J, Albers JJ. Dextran sulfate-Mg2+ precipitation procedure for quantitation of high-density-lipoprotein cholesterol. Clin Chem 1982;28(6):1379–88. [PubMed] [Google Scholar]
- 24.Executive Summary of The Third Report of The National Cholesterol Education Program (NCEP) Expert Panel on Detection, Evaluation, And Treatment of High Blood Cholesterol In Adults (Adult Treatment Panel III). JAMA 2001;285(19):2486–97. [DOI] [PubMed] [Google Scholar]
- 25.Alberti KG, Eckel RH, Grundy SM, Zimmet PZ, Cleeman JI, Donato KA, et al. Harmonizing the Metabolic Syndrome. A Joint Interim Statement of the International Diabetes Federation Task Force on Epidemiology and Prevention; National Heart, Lung, and Blood Institute; American Heart Association; World Heart Federation; International Atherosclerosis Society; and International Association for the Study of Obesity. Circulation 2009:1640–5. [DOI] [PubMed] [Google Scholar]
- 26.Bell JA, Hamer M, Sabia S, Singh-Manoux A, Batty GD, Kiviamki M The Natural Course of Healthy Obesity Over 20 Years. Journal of the American College of Cardiology 2015;65(1):101–9. [DOI] [PubMed] [Google Scholar]
- 27.Schroder H, Ramos R, Baena-Diez JM, Mendez MA, Canal DJ, Fito M, et al. Determinants of the transition from a cardiometabolic normal to abnormal overweight/obese phenotype in a Spanish population. Eur J Nutr 2014;53(6):1345–53. [DOI] [PubMed] [Google Scholar]
- 28.Eckel N, Li Y, Kuxhaus O, Stefan N, Hu FB, Schulze MB. Transition from metabolic healthy to unhealthy phenotypes and association with cardiovascular disease risk across BMI categories in 90 257 women (the Nurses’ Health Study): 30 year follow-up from a prospective cohort study. Lancet Diabetes Endocrinol 2018. [DOI] [PubMed] [Google Scholar]
- 29.Primeau V, Coderre L, Karelis AD, Brochu M, Lavoie ME, Messier V, et al. Characterizing the profile of obese patients who are metabolically healthy. Int J Obes (Lond) 2011;35(7):971–81. [DOI] [PubMed] [Google Scholar]
- 30.Plourde G, Karelis AD. Current issues in the identification and treatment of metabolically healthy but obese individuals. Nutr Metab Cardiovasc Dis 2014;24(5):455–9. [DOI] [PubMed] [Google Scholar]
- 31.Stefan N, Haring HU, Hu FB, Schulze MB. Metabolically healthy obesity: epidemiology, mechanisms, and clinical implications. Lancet Diabetes Endocrinol 2013;1(2):152–62. [DOI] [PubMed] [Google Scholar]
- 32.Flegal KM, Carroll MD, Kuczmarski RJ, Johnson CL. Overweight and obesity in the United States: prevalence and trends, 1960–1994. Int J Obes Relat Metab Disord 1998;22(1):39–47. [DOI] [PubMed] [Google Scholar]
- 33.Reis JP, Loria CM, Lewis CE, Powell-Wiley TM, Wei GS, Carr JJ, et al. Association between duration of overall and abdominal obesity beginning in young adulthood and coronary artery calcification in middle age. JAMA 2013;310(3):280–8. [DOI] [PMC free article] [PubMed] [Google Scholar]
- 34.Kramer CK, Zinman B, Retnakaran R. Are metabolically healthy overweight and obesity benign conditions?: A systematic review and meta-analysis. Ann Intern Med 2013;159(11):758–69. [DOI] [PubMed] [Google Scholar]
- 35.Sundstrom J, Riserus U, Byberg L, Zethelius B, Lithell H, Lind L. Clinical value of the metabolic syndrome for long term prediction of total and cardiovascular mortality: prospective, population based cohort study. BMJ 2006;332(7546):878–82. [DOI] [PMC free article] [PubMed] [Google Scholar]