

There is a pressing need for drug development for gonorrhea. Here we describe a pharmacokinetic (PK)/pharmacodynamic (PD) analysis of extended-spectrum cephalosporins (ESC) against drug-susceptible and drug-resistant gonococcal strains in a murine genital tract infection model.
KEYWORDS: antibiotic resistance, cefixime, ceftriaxone, clearance, gonorrhea, mouse model, pharmacokinetics
ABSTRACT
There is a pressing need for drug development for gonorrhea. Here we describe a pharmacokinetic (PK)/pharmacodynamic (PD) analysis of extended-spectrum cephalosporins (ESC) against drug-susceptible and drug-resistant gonococcal strains in a murine genital tract infection model. The PK determined in uninfected mice displayed a clear dose-response in plasma levels following single doses of ceftriaxone (CRO) (intraperitoneal) or cefixime (CFM) (oral). The observed doses required for efficacy against ESC-susceptible (ESCs) strain FA1090 were 5 mg/kg of body weight (CRO) and 12 mg/kg (CFM); these doses had estimated therapeutic times (the time that the free drug concentration remains above the MIC [fTMIC]) of 24 h and 37 h, respectively. No single dose of CRO or CFM was effective against ESC-resistant (ESCr) strain H041. However, fractionation (three times a day every 8 h [TIDq8h]) of a 120-mg/kg dose of CRO resulted in estimated therapeutic times in the range of 23 h and cleared H041 infection in a majority (90%) of mice, comparable to the findings for gentamicin. In contrast, multiple CFM doses of 120 or 300 mg/kg administered TIDq8h cleared infection in ≤50% of mice, with the therapeutic times estimated from single-dose PK data being 13 and 27 h, respectively. This study reveals a clear relationship between plasma ESC levels and bacterial clearance rates in the gonorrhea mouse model. The PK/PD relationships observed in mice reflected those observed in humans, with in vivo efficacy against an ESCs strain requiring doses that yielded an fTMIC in excess of 20 to 24 h. PK data also accurately predicted the failure of single doses of ESCs against an ESCr strain and were useful in designing effective dosing regimens.
TEXT
The ability to effectively treat gonorrheal infections is currently of global concern due to decreasing susceptibility to the extended-spectrum cephalosporins (ESCs) in Neisseria gonorrhoeae and the emergence of ESC-resistant (ESCr) strains (1). An estimated 78 million gonococcal (GC) infections occur each year (2), and control measures are limited to safe-sex counseling and the identification and treatment of infected individuals and their sexual contacts. Most infections are uncomplicated urogenital tract infections; rectal and pharyngeal infections are also common. Ascending cervical infections occur in 18% to 20% of women, and pelvic inflammatory disease and associated complications, including infertility, are responsible for the major morbidity and mortality associated with gonorrhea (3). Maternal gonorrhea can lead to adverse pregnancy outcomes, including premature rupture of membranes, ectopic pregnancy, low birth weight (4, 5), and ophthalmia neonatorum, which can cause blindness (6, 7). Gonorrhea is also a proven cofactor in HIV transmission, and targeted treatment of sexually transmitted diseases can reduce HIV infection rates within a community (8, 9).
Antibiotic resistance evolves quickly in the gonococcus and has led to diminishing treatment options, the need for large resistance surveillance programs, and the frequent revision of treatment guidelines. The loss of fluoroquinolones as a recommended first-line treatment for gonorrhea in 2007 in the United States (10) and the oral ESC cefixime (CFM) in 2012 in the United States left ceftriaxone (CRO) as the only remaining monotherapy for gonorrhea. Dual therapy with high-dose ceftriaxone and azithromycin is now recommended for the empirical treatment of uncomplicated gonococcal infections to slow the emergence of resistant strains (11–13). This strategy is threatened, however, by decreasing ESC and azithromycin susceptibility globally (1) and the isolation of CRO-resistant (CROr) strains (14–16) and strains with high-level azithromycin resistance (17, 18). The possibility of untreatable gonorrhea was recently illustrated by the first reported dual treatment failure (19) and the isolation of high-level azithromycin-resistant N. gonorrhoeae strains with reduced CRO susceptibility that were also resistant to penicillin, tetracycline, and ciprofloxacin in Hawaii (20). In 2018, the first gonococcal strain with ceftriaxone resistance combined with high-level azithromycin resistance was reported from England (21), followed by two similar cases in Australia (22). In anticipation of a need for alternative therapies, gentamicin (GEN) or gemifloxacin combined with azithromycin was shown to be effective against urogenital and pharyngeal infections (23), and three new antimicrobials have been tested in phase II or III clinical trials (12, 24). Research on novel anti-infectives for gonorrhea has also increased, and in 2016, ideal and acceptable target product profiles for gonorrhea treatment were proposed by the Global Antibiotic Research and Development Partnership (GARDP) to stimulate drug development for gonorrhea (24).
Preclinical testing of candidate compounds for safety and efficacy in animal models is a valuable step in the development of new anti-infectives. While host restrictions challenge the capacity of nonhuman primate models to fully mimic gonococcal infection in humans, estradiol-treated mice can be experimentally infected with N. gonorrhoeae, and several aspects of murine infection mimic natural gonococcal infection in humans (25, 26). This model has also been a useful tool in the development of antibiotics (27, 28), vaginal microbicides (29, 30), and candidate vaccines and immunotherapeutics against gonorrhea (31–35). To further develop the gonorrhea mouse model for predicting antibiotic efficacy in humans, it is important that pharmacokinetic (PK)/pharmacodynamic (PD) relationships be established for known antibiotics that link drug exposures to bacterial clearance of susceptible and resistant N. gonorrhoeae strains. Here we determined the PK of CRO and CFM in mice and correlated estimated plasma drug levels with the minimum dose of antibiotic needed to clear infection with the ESC-susceptible (ESCs) laboratory strain FA1090. We also utilized predictions from the PK data to develop dosing regimens for the multidrug-resistant N. gonorrhoeae strain H041 (ESCr).
RESULTS
PK analysis of CRO and CFM in estradiol-treated mice.
Pharmacokinetic (PK) and in vivo efficacy studies were conducted in BALB/c mice treated with 17β-estradiol and antibiotics per a well-established protocol for promoting experimental gonococcal infection in mice (25) (Fig. 1A). For PK studies, uninfected mice were given a single intraperitoneal (i.p.) dose of CRO administered at 5 concentrations ranging from 0.06 to 120 mg/kg of body weight 4 days after estradiol treatment, which is the time point that corresponds to the second day of infection in the in vivo efficacy studies. A clear dose-response in plasma CRO levels was observed in samples collected over a 24-h period (Fig. 2A). Measured plasma drug levels were adjusted for protein binding for CRO in mouse plasma (60% bound [36]), and the resultant simulated PK profiles estimated that free plasma CRO levels for all doses exceeded the MIC of ESCs strain FA1090 (0.0075 µg/ml) (Fig. 2B, solid black line), with the lowest dose (0.06 mg/kg) being above the MIC for ∼4 h. In contrast, only 3 of the single doses of CRO tested were predicted to yield free plasma levels that exceed the MIC for ESCr strain H041 (2 µg/ml) (Fig. 2B, dotted line).
FIG 1.
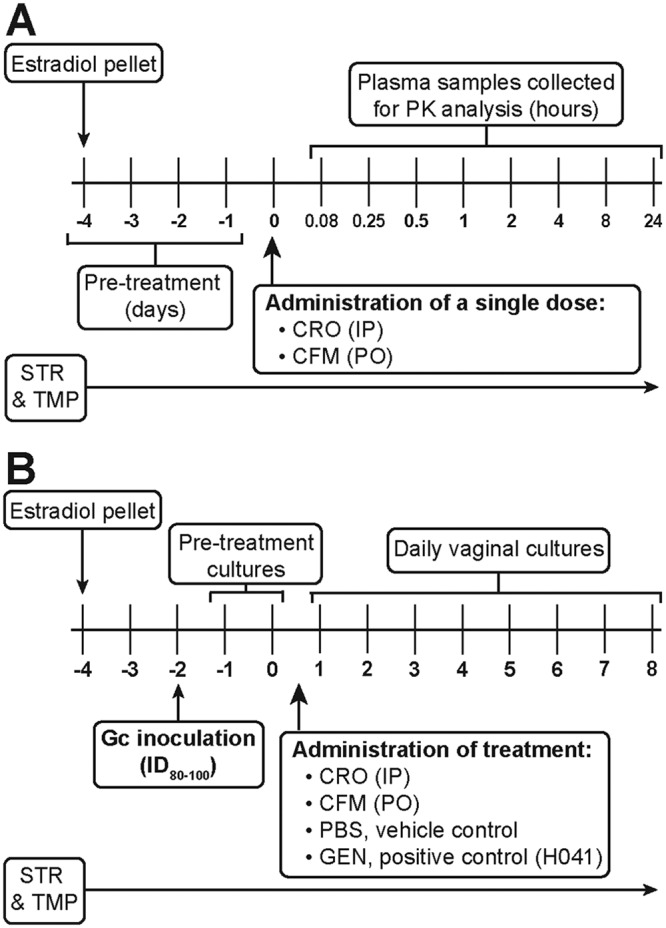
Timelines for blood collection and in vivo efficacy testing of ESCs in the gonorrhea mouse model. Female BALB/c mice received a 17β-estradiol pellet implanted subcutaneously 4 days prior to administration of test and control antibiotics or PBS. Streptomycin (STR) and trimethoprim (TMP) were administered for the duration of the experiments. (A) For PK studies, plasma samples were collected from uninfected mice on day 0 at 0.08, 0.25, 0.5, 1, 2, 4, 8, and 24 h posttreatment (n = 4 mice/dose/time point). (B) For in vivo efficacy studies, mice were inoculated vaginally 2 days following implantation of a pellet with the lowest dose of N. gonorrhoeae that infects 80% to 100% of mice for at least 10 days (ID80–100). Vaginal swab specimens were cultured for 2 days (days −1 and 0) after bacterial inoculation to confirm infection. Decreasing doses of CRO or CFM were administered following collection of specimens for culture on day 0; PBS was administered as a negative control in all experiments, and GEN (i.p., 48 mg/kg, 5 doses, QD) was administered as a positive control for H041 infections. The colonization load was quantitated for 8 days posttreatment by daily culture of vaginal swab specimens. Gc, gonococcus.
FIG 2.

Pharmacokinetic analysis of ESCs in the gonorrhea mouse model. (A and C) The concentrations of free CRO (A) or CFM (C) in plasma samples collected from uninfected mice after a single dose of test antibiotic are shown as the raw data (dots) overlaid with the predicted values (lines) for each dose over a 24-h period. Each data point represents the mean concentration for 4 mice per dose. Modeling of each antibiotic dose was determined from analysis of the plasma drug levels using Phoenix WinNonlin software. Plasma concentrations were adjusted to account for plasma protein binding for CRO (60% bound) and CFM (72.5% bound). (B and D) Simulated PK profiles of the free serum concentration for all single doses of CRO (B) or CFM (D). The MICs of the ESCs strain FA1090 are indicated (solid black line) for CRO (0.0075 µg/ml) and CFM (0.0075 µg/ml). The MICs of the ESCr strain H041 are also indicated (dotted line) for CRO (2 µg/ml) and CFM (8 µg/ml) for comparison. MICs were determined by agar dilution (52).
PK analysis was also performed on K3EDTA plasma samples collected after oral (p.o.) administration of single doses of CFM ranging from 0.19 to 120 mg/kg (Fig. 2C). Plasma CFM levels were adjusted based on protein binding for CFM in mouse plasma (72.5% bound [37]), and simulated PK profiles estimated that all doses between 0.19 and 60 mg/kg yielded free plasma concentrations in excess of the CFM MIC against strain FA1090 (0.0075 µg/ml) (Fig. 2D, solid black line). None of the CFM doses resulted in plasma levels above the MIC for strain H041 (8 µg/ml) (Fig. 2D, dotted line). Simulated PK profiles for the free plasma concentrations of CRO and CFM were used to estimate parameters commonly used for antibacterial PK/PD, including the time that the concentration remains above the MIC, the area under the curve (AUC)/MIC, and the maximum concentration in plasma (Cmax)/MIC, for all doses tested against both gonococcal strains in the in vivo efficacy studies (see Tables S1 and S2 in the supplemental material). The studies reported herein do not provide sufficient data to power a full analysis and confirmation of the PK/PD parameter that best correlates with efficacy. However, based on previous studies of cephalosporin antibiotics, it is expected that efficacy for these drugs best correlates with the therapeutic time that the free drug concentration remains above the MIC (fTMIC) (38). Therefore, this parameter was used for comparison with efficacy observed in the N. gonorrhoeae infection model described below.
Determination of in vivo efficacy for CRO and CFM against strain FA1090 (ESCs) and calculation of the corresponding therapeutic times from PK analysis.
For all in vivo efficacy testing experiments, estradiol-treated mice were inoculated vaginally with N. gonorrhoeae strain FA1090 (ESCs) or H041 (ESCr), and infection was allowed to progress for 2 days before treatment. Infection was monitored over 8 consecutive days following treatment by quantitative culture of vaginal swab specimens (Fig. 1B). To test the efficacy of CRO against strain FA1090, mice received a single i.p. injection of CRO at doses ranging from 0.06 to 30 mg/kg on day 0. Clearance of bacteria occurred within 48 h posttreatment in 100% of mice that received the three highest doses of CRO (5, 15, and 30 mg/kg) (Fig. 3A and B). A significant reduction in the percentage of infected mice treated with 1.5 mg/kg and 0.25 mg/kg of CRO was observed over time compared to that for mice treated with phosphate-buffered saline (PBS); however, neither dose was 100% effective, with only 25% and 60% of mice having cleared the infection at 48 h posttreatment, respectively. The activity of the lowest dose of CRO tested (0.06 mg/kg) was comparable to that of PBS. All doses showed a significant reduction in the bacterial burden recovered over 8 days compared to that achieved with PBS (Fig. 3C). Comparison of the number of gonococci recovered at 48 h posttreatment with the number recovered on the morning prior to treatment for each individual mouse showed a significant reduction, expressed as the fold change, for mice treated with 1.5 to 30 mg/kg (Fig. 3D), which were also the groups that showed the least variability in colonization load (Fig. 3C), further indicating that these doses are where CRO shows a real effect. We did not observe any significant clearance following this time point for any dose tested and therefore defined the in vivo target effect or breakpoint as the lowest dose of CRO that was 100% efficacious at 48 h posttreatment, which was 5 mg/kg. This dose corresponds to a predicted therapeutic time (fTMIC) of 23.6 h, based on the simulated PK profiles (Fig. 3E).
FIG 3.

A single 5-mg/kg dose of CRO showed 100% efficacy against an ESCs strain and produced a therapeutic time of 23.6 h. (A) Percentage of mice infected with FA1090 following administration of a single dose (arrow) of CRO, given at concentrations of 30 to 0.06 mg/kg or PBS over 8 days posttreatment (n = 8 to 10 mice/dose/experiment). Changes in the percentage of mice colonized were analyzed with a Kaplan-Meier survival curve and a log-rank (Mantel-Cox) test; P was <0.02 when CRO doses ranging from 30 to 0.25 mg/kg were compared to the PBS control. Results represent those from four combined independent experiments (total n = 9 to 35 mice/dose total). (B) Percentage of mice that cleared infection within 48 h posttreatment with each dose of CRO. (C) Vaginal swab specimens were quantitatively cultured to determine the bacterial burden (number of CFU per milliliter) before (day 0) and following (arrow) administration of CRO. The mean bacterial burden is shown for each treatment group; error bars indicate the standard error of the mean (SEM). The limit of detection was 20 CFU/ml (dotted line). Differences in the mean number of CFU per milliliter recovered over the course of infection were determined by repeated-measures two-way analysis of variance (ANOVA) with Bonferroni’s post hoc analysis comparing the treatment groups to the PBS control group (P < 0.005 for all doses of CRO tested). (D) Fold change in the number of CFU per milliliter between pretreatment cultures (day 0) and cultures of specimens collected 48 h after CRO administration for each individual mouse. The dotted line represents no change, and solid lines indicate the median fold change for each treatment group. Significance was calculated using a Kruskal-Wallis test with Dunn’s multiple comparisons to compare CRO treatment groups to the PBS control (*, P < 0.0001). (E) The predicted therapeutic time (fTMIC) that the free serum concentration of CRO remained above the MIC of FA1090 (0.0075 µg/ml) is shown for each dose of CRO.
The in vivo efficacy of CFM against FA1090 was tested similarly, except that CFM was delivered by oral gavage at doses ranging from 0.19 to 60 mg/kg (Fig. 4). By 48 h posttreatment, all mice that received either the 12- or 60-mg/kg dose cleared the infection. Seventy-one percent of mice given the next lowest dose (3 mg/kg) cleared the infection at this time point (Fig. 4A and B). Mice that received 0.19 or 0.75 mg/kg of CFM showed a significant reduction in the percentage of mice colonized over 8 days compared to that for mice treated with PBS, but bacterial clearance at 48 h was ≤50%. A significant reduction in the bacterial burden occurred following treatment with CFM doses ranging from 0.75 to 60 mg/kg compared to that following treatment with PBS (Fig. 4C); this decreased bioburden was also observed in these treatment groups when comparing the fold change in the number of gonococci recovered pretreatment versus the number recovered at 48 h posttreatment in individual mice (Fig. 4D). Treatment with 0.19 mg/kg of CFM was comparable to treatment with PBS alone for both the percentage of mice infected (Fig. 4A) and the average bacterial burden recovered (Fig. 4C). The in vivo breakpoint of CFM against strain FA1090 was 12 mg/kg of CFM, which corresponds to a predicted fTMIC of 38.6 h, based on the PK data generated in this model (Fig. 4E).
FIG 4.

A single 12-mg/kg dose of CFM showed 100% efficacy against an ESCs strain and produced a therapeutic time of 36.8 h. (A) Percentage of mice infected with FA1090 following administration of a single dose (arrow) of CFM, given at concentrations of 60 to 0.19 mg/kg, or PBS over 8 days posttreatment (n = 9 to 12 mice/dose/experiment). Changes in the percentage of mice colonized were analyzed with a Kaplan-Meier survival curve and a log-rank (Mantel-Cox) test; P was ≤0.0003 when CFM doses ranging from 60 to 0.75 mg/kg were compared to the PBS control. Results represent those from two combined independent experiments (n = 9 to 22 mice/dose total). (B) Percentage of mice that cleared infection within 48 h posttreatment with each dose of CFM that was administered. (C) Vaginal swab specimens were collected daily and quantitatively cultured to determine the bacterial burden (number of CFU per milliliter) before (day 0) and following (arrow) administration of CFM. The mean bacterial burden is shown for each treatment group; error bars indicate the SEM. The limit of detection was 20 CFU/ml (bottom dotted line). Differences in the mean number of CFU per milliliter recovered over the course of infection were determined by repeated-measures two-way ANOVA with Bonferroni’s post hoc analysis comparing the treatment groups to the PBS control group (P < 0.0001 for CFM doses ranging from 60 to 0.75 mg/kg). (D) Fold change in the number of CFU per milliliter between pretreatment cultures (day 0) and cultures of specimens collected 48 h after CFM administration for each individual mouse. The dotted line represents no change, and solid lines indicate the median fold change of each treatment group. Significance was calculated using a Kruskal-Wallis test with Dunn’s multiple comparisons to compare CFM treatment groups to the PBS control group (*, P ≤ 0.02; **, P < 0.0001). (E) The predicted therapeutic time that the free serum concentration of CFM remained above the MIC of FA1090 (0.0075 µg/ml) (fTMIC) is shown for each dose of CFM administered.
Use of estimated therapeutic times to predict successful CRO treatment regimens against an ESCr strain.
N. gonorrhoeae strains H041 and F89 are ESCr strains that were originally isolated from the pharynx and urethra, respectively, following CRO treatment failures (16, 39). Streptomycin (STR)-resistant (STRr) derivatives of each strain were constructed to generate the required phenotype for testing in the mouse model; these strains, H041(STRr) and F89(STRr), are referred to as H041 and F89 throughout this article for brevity. Prior to in vivo efficacy testing, we determined the infectious dose for these strains by inoculating mice vaginally with 10-fold increasing doses of either strain ranging from 102 to 106 CFU. Both strains were infectious (Fig. S1); however, strain H041 maintained infection in a higher percentage of mice over time, with a dose of 104 CFU resulting in the highest percentage of mice (86%) being colonized for 12 days (Fig. S1A) and having the most robust bacterial burden (Fig. S1B). Strain H041 at 104 CFU was selected for subsequent studies to provide the statistical power needed to evaluate antibiotic efficacy in a reasonable number of mice. In preparation for in vivo efficacy testing, gentamicin (GEN) was tested as a positive control for H041 infections. A clear dose-response was observed, and a dosing regimen of 5 daily i.p. doses of 48 mg/kg, which cleared H041 infection in 89% of mice within 4 days after the first injection, was chosen for future studies (Fig. S2B).
To guide the design of the in vivo efficacy experiments for H041, PK profiles for single or multiple doses of 120 mg/kg of CRO were simulated based on the plasma levels measured from single-dose PK experiments in uninfected mice (Fig. 5A). Using the CRO MIC against H041 of 2 µg/ml, determined by agar dilution, the predicted therapeutic times for a single dose (once a day [QD]) of 60 or 120 mg/kg of CRO were 4.6 h and 7.2 h, respectively (Fig. 5B). Simulations of multiple doses and administration frequencies (QD every 24 h [QDq24h], twice a day [BID] every 12 h [BIDq12h], three times a day [TID] every 8 h [TIDq8h]) suggested that only 120 mg/kg given TIDq8h resulted in predicted free plasma CRO levels that exceeded the H041 MIC for >20 h, which was the fTMIC associated with the in vivo breakpoint of CRO against strain FA1090. Several experiments were conducted to test these dosing regimens for CRO against H041 in the mouse infection model, and the in vivo efficacy data were consistent with the results expected based on the predicted therapeutic times (Fig. 5C). In each experiment, the negative control, PBS, resulted in no clearance of infection after 48 h, and the positive control, GEN, resulted in 37% clearance (average from two experiments) at this time point (Fig. 5C). Fractionating the doses of CRO to reach a cumulative dose of 60 mg/kg (20 mg/kg TID, 30 mg/kg BID, 60 mg/kg QD) or 120 mg/kg (60 mg/kg BID, 120 mg/kg QD) yielded predicted therapeutic times of <20 h (Fig. 5B) and resulted in a minimal clearance of H041 infection, with only 10% to 30% of mice being culture negative within 48 h (Fig. 5C). In contrast, there was a significant clearance rate within 48 h compared to that achieved with PBS in mice that received 120 mg/kg BID (50%) or 60 mg/kg TID (40%), and the 120-mg/kg TID treatment cleared the infection in a majority (90%) of mice by this time point and was more effective than GEN (Fig. 5C).
FIG 5.

Multiple doses of CRO with a therapeutic time of 22.9 h were able to eradicate an ESCr strain. (A) Simulated PK profiles of CRO available in the plasma of uninfected mice after administration of a 120-mg/kg dose delivered once (QD), twice (BID), or three times (TID) over a 24-h period. The MIC of CRO for H041 is indicated (black dotted line, 2 µg/ml). (B) The predicted therapeutic time that the free serum concentration of CRO remained above the MIC is shown for each dosing regimen. (C) Percentage of mice that cleared infection within 48 h posttreatment with each dosing regimen. Doses are arranged as decreasing therapeutic time. (D) Percentage of mice infected with H041 following i.p. administration of 120 mg/kg CRO (arrow) given QD, BID, or TID (over 24 h) over 8 days posttreatment (n = 8 to 10 mice per dose/experiment). GEN treatment was used as a positive control (n = 19), and PBS was used as a negative control (n = 19). For fractionated doses, the arrow indicates the time point at which the first dose was given. Results represent those from two combined independent experiments (n = 10 to 19 mice/dose total). The arrow indicates the time point at which the first dose was given. Changes in the percentage of mice colonized were analyzed with a Kaplan-Meier survival curve and a log-rank (Mantel-Cox) test (P ≤ 0.005 for 120 mg/kg CRO given BID or TID versus PBS). Significance was also calculated by comparing treatment groups to the GEN positive-control group, with TID treatment being more effective than GEN (P = 0.006) and QD treatment being less effective than GEN (P ≤ 0.001). (E) Vaginal swab specimens were collected daily and quantitatively cultured to determine the bacterial burden (number of CFU per milliliter) before (day 0) and following (arrow) CRO administration. The mean bacterial burden is shown for each treatment group; error bars indicate the SEM. The limit of detection was 20 CFU/ml (bottom dotted line). Differences in the mean number of CFU per milliliter recovered over the course of infection were determined by repeated-measures two-way ANOVA with Bonferroni’s post hoc analysis comparing treatment groups to the PBS control group (P ≤ 0.001 for GEN and 120 mg/kg for CRO TID and BID regimens). Changes in the recoverable bacterial burden over the course of the experiment were also compared to those achieved with GEN (P = 0.002 for 120 mg/kg CRO QD). (F) Fold change in number of CFU per milliliter between pretreatment cultures (day 0) and cultures of specimens collected 48 h after CRO administration for each individual mouse. The CRO dosing regimens are indicated on the x axis, and treatment groups are organized from the highest (left) to the lowest (right) therapeutic time. The dotted line represents no change, and solid lines indicate the median fold change for each treatment group. Significance was calculated using the Kruskal-Wallis test with Dunn’s multiple comparisons to compare CRO treatment groups to the PBS control group (*, P ≤ 0.01; **, P ≤ 0.0002).
H041 clearance rates over 8 days posttreatment for one, two, and three doses of 120 mg/kg CRO showed that the TID regimen (360-mg/kg cumulative dose) resulted in 90% clearance of infection within 48 h after treatment initiation and 100% clearance within 72 h. This regimen was significantly more effective than the GEN (P = 0.0006) and PBS (P < 0.0001) control regimens (Fig. 5D). The number of gonococci recovered over time from mice given 120 mg/kg CRO BID was also significantly lower than that recovered from mice given PBS but comparable to that recovered from mice given GEN treatment (Fig. 5E and F). We conclude that the TID 120-mg/kg CRO regimen is effective against H041 in vivo and that this result is consistent with the predicted therapeutic times for this regimen being greater than 24 h.
CFM was not effective against the ESCr strain, and the therapeutic time that was reached for the ESCs strain was not obtained.
PK profiles for single or multiple doses of CFM were also simulated (Fig. 6A), based on the plasma levels measured from single-dose PK experiments in uninfected mice, to guide the design of experiments for in vivo efficacy against H041. In an attempt to achieve adequate free concentrations in plasma above the elevated MIC (8 µg/ml), doses of CFM up to 300 mg/kg administered as QD, BID, or TID regimens (Fig. 6A) were simulated to estimate the therapeutic times against H041 (Fig. 6B). A single dose of 120 mg/kg and fractionation of a 120-mg/kg dose of CFM (administered as 40 mg/kg TID and 60 mg/kg BID) did not result in estimated free plasma levels above the MIC of H041. As predicted from simulated therapeutic times, none of these treatment regimens significantly cleared the infection within 48 h in a majority of mice (Fig. 6C). The results of experiments using 300 mg/kg (QD, BID, TID) showed a significant difference from those of experiments using PBS (Fig. 6D), but 300 mg/kg also did not clear the infection by 48 h in a majority of mice (Fig. 6C). The highest dose, 300 mg/kg CFM TID, cleared the infection in 50% of mice by 48 h and was comparable to that of the GEN control treatment (Fig. 6D).
FIG 6.

No CFM treatment regimen was 100% efficacious against an ESCr strain. (A) Simulated PK profiles of CFM available in the plasma of uninfected mice after administration of a 300-mg/kg dose delivered once (QD), twice (BID, 12 h apart), or three times (TID, 8 h apart) over a 48-h period of time. The MIC of CFM for H041 is indicated (black dotted line, 8 µg/ml). (B) The predicted therapeutic time that the free serum concentration of CFM remained above the MIC is shown for each concentration (and dosing regimen) of CFM tested. (C) Percentage of mice that cleared infection within 48 h posttreatment with each concentration and dosing regimen of CFM that was administered. Doses are arranged as decreasing therapeutic time. (D) Percentage of mice that were infected with H041 following p.o. administration of 300 mg/kg CFM (arrow) as QD, BID, or TID dosing regimens (given over 24 h) and from which specimens were cultured for 8 days posttreatment (n = 9 to 10 mice per dose/experiment). GEN treatment was used as a positive control (n = 19), and PBS was used as a negative control (n = 24); results represent those from two combined independent experiments. The arrow indicates the time point at which the first dose was given. Changes in the percentage of mice colonized were analyzed with a Kaplan-Meier survival curve and a log-rank (Mantel-Cox) test; P was ≤0.008 when all 3 dosing regimens of 300 mg/kg CFM (and GEN) were compared to the PBS control; however, GEN was significantly more effective than any of the CFM dosing regimens (P ≤ 0.005). (E) Vaginal swab specimens were quantitatively cultured to determine the bacterial burden (number of CFU per milliliter) on the day before (day 0) and following (arrow) administration of CRO. The mean bacterial burden is shown for each treatment group; error bars indicate the SEM. The limit of detection was 20 CFU/ml (bottom dotted line). Differences in the mean number of CFU per milliliter recovered over the course of infection were determined by repeated-measures two-way ANOVA with Bonferroni’s post hoc analysis comparing treatment groups to the PBS control group (P ≤ 0.01 for the TID treatment regimen of 300 mg/kg CFM and GEN). Changes in the recoverable bacterial burden over the course of the experiment were comparable to those achieved with GEN for all regimens except the 300-mg/kg BID treatment regimen, which was less effective (P = 0.03). (F) Fold change in the number of CFU per milliliter between pretreatment cultures (day 0) and cultures of specimens collected 48 h after CRO administration for each individual mouse. The concentration of CFM and the dosing regimen are indicated on the x axis; treatment groups are organized from the highest (left) to the lowest (right) therapeutic time. The dotted line represents no change, and solid lines indicate the median fold change for each treatment group. Significance was calculated using a Kruskal-Wallis test with Dunn’s multiple comparisons to compare CFM treatment groups to the PBS control group (*, P ≤ 0.0002).
The bacterial burden in mice given 300 mg/kg CFM TID was also significantly reduced compared to that in mice given PBS and was comparable to that in mice given GEN treatment (Fig. 6E). None of the CFM treatment regimens had an effect on the bacterial burden, as measured by the fold change in the number of gonococci recovered in pretreatment cultures and cultures of specimens taken at 48 h posttreatment compared to that achieved with PBS treatment (Fig. 6F). In summary, the highest dose of CFM tested (300 mg/kg TID) showed the greatest efficacy and reached a therapeutic time of 27 h, but complete clearance was not obtained. In comparison, the in vivo effect target of CFM against the susceptible strain FA1090 corresponded to a longer therapeutic time of 36.8 h.
DISCUSSION
The goal of this study was to provide a PK/PD analysis in a well-characterized female mouse genital tract infection model of approved drugs, CRO and CFM, against susceptible and resistant N. gonorrhoeae strains by comparing the therapeutic times derived from PK studies with the in vivo efficacy of these antibiotics. Both CRO and CFM showed a clear dose-response against the ESCs strain FA1090, and the in vivo effect target for these antibiotics, defined as 100% clearance within 48 h posttreatment, corresponded to an fTMIC of 23.6 and 36.8 h, respectively. These values are consistent with current treatment recommendations for ESCs strains in humans; therapeutic times in humans are estimated to be ≥24 h for current CRO regimens (250 mg; 3 mg/kg) for strains with a CRO MIC of ≤0.125 µg/ml and >22 h for CFM regimens (400 mg; 5 mg/kg) for strains with an MIC of ≤0.06 µg/ml. Furthermore, an CRO treatment regimen effective against the ESCr strain H041 was identified using PK modeling and simulations to select doses estimated to achieve therapeutic times above the elevated MIC. The in vivo effect target for CRO against H041 was 120 mg/kg given TID. Such frequent and high doses of CRO are not practical in the clinic (40), and currently, high-dose CRO (500 to 1,000 mg) plus azithromycin (2 g), spectinomycin (2 g) plus azithromycin (2 g), or GEN (240 mg) with azithromycin (2 g) is recommended for infections with ESCr N. gonorrhoeae.
Historically, penicillin doses that maintain plasma concentrations at 4 times the in vitro MIC for 8 to 10 h were correlated with successful treatment of uncomplicated urogenital gonorrhea in humans (41). This same therapeutic window was used as a guideline following the rise of tetracycline resistance in the 1980s and 1990s, when examining new antibiotic treatment regimens against gonorrhea (42). This recommendation was revisited by Chisholm and colleagues in response to the MIC creep for CFM and CRO against N. gonorrhoeae (40). Simulated PK analysis and consideration of contemporary clinical trial experience in Japan (43) were used to estimate the therapeutic times (fTMIC) for currently approved dosing regimens for CRO or CFM against a range of MICs. These studies indicated that therapeutic times of 20 to 24 h for the free drug concentration above the MIC are required for an optimal clinical response and, notably, that these exposures are not achieved against increasingly more prevalent drug-resistant strains of N. gonorrhoeae (40).
Longer therapeutic times were needed for CFM than for CRO to clear both FA1090 and H041 infection in mice. A single 12-mg/kg dose of CFM, which corresponds to a therapeutic time of 36.8 h, was the in vivo effect target for mice infected with an ESCs strain. Attempts to identify an in vivo effect target for CFM against the ESCr strain H041 were unsuccessful. The MIC of CFM against H041 is impressively high, and none of the dosing regimens tested achieved plasma CFM levels above the CFM MIC against H041 for greater than 29 h, even with the 300-mg/kg dose given TID. The CDC guidance for treatment with CFM for uncomplicated gonococcal infection in humans was a monotherapy of 400 mg administered orally. This was followed by a dual therapy of CFM (400 mg) and azithromycin in 2010. However, with the emergence of ESCr strains, such as H041, oral ESCs were no longer recommended for use beginning in 2012.
The mouse model used here is a useful surrogate model of cervicovaginal infection. While the effectiveness of antibiotics against urethral infections may differ from that against cervical infections, rectal and especially pharyngeal infections, which are also common, are, in general, more refractory to treatment. Experimental infection of male subjects could be used to study the effectiveness of therapeutics against urethral infection (44), but currently, there are no animal models of gonococcal urethral, pharyngeal, or rectal infections. Whether results from the model used here are predictive of bacterial clearance kinetics in the urethra or other mucosal sites is not known. As with any human-specific pathogen, the impact of host restrictions on the results, which include restrictions in adherence and invasion receptors, iron-binding glycoproteins, and regulatory proteins of complement activation, should also be considered when interpreting data from this model (25).
In conclusion, we found a clear relationship between plasma drug levels and bacterial clearance rates in the gonorrhea mouse model. The PK/PD response observed in mice reflected that observed in humans, with in vivo effect targets for an ESCs strain corresponding to doses that yielded fTMIC values of greater than 20 to 24 h, which is consistent with clinical data showing that a therapeutic time of >20 h is optimal for complete eradication of an uncomplicated gonococcal urogenital tract infection (40, 43). PK data also accurately predicted the failure of single high doses of CRO or CFM against an ESCr strain and were useful in designing effective dosing strategies, albeit requiring plasma concentrations of drug not likely achievable in the clinic. Moving forward, these data should be useful in designing efficacy trials for adjunctive therapies that could be used to increase the susceptibility of N. gonorrhoeae to ESCs or other antibiotics that use fTMIC as a predictor of treatment success. ESCs differ from other classes of antibiotics (such as fluoroquinolones) which use the AUC as the PK/PD driver; studies are under way to further refine the female mouse model for predicting the efficacy of antibiotics that use AUC to predict drug efficacy.
MATERIALS AND METHODS
Bacterial strains and culture conditions.
N. gonorrhoeae strains FA1090, H041, and F89 were used in this study. FA1090 (PorB1b) is a naturally streptomycin-resistant (STRr), serum-resistant strain originally isolated from a woman with a disseminated gonococcal infection (45). Strain FA1090 has been used extensively in both the experimental urethritis model in male volunteers and the female mouse model of infection (25, 26, 44, 46–48). Strains H041 (PorB1b) and F89 (PorB1b) are multidrug-resistant strains that are resistant to ESCs and that were isolated from the pharynx of a female in Kyoto, Japan, and a male urethral infection in Quimper, France, respectively (16, 39). H041 and F89 were made STRr for use in the mouse model via transformation and electroporation (49), respectively, followed by allelic replacement with the rpsL sequence from FA1090, which confers STR resistance (50). These STRr derivatives are referred to as H041 and F89 in this report for brevity. All bacteria were propagated on GC agar (BD Biosciences) supplemented with Kellogg's supplement and 12 μM Fe(NO3)3 under 7% CO2 at 37°C. GC agar containing vancomycin, colistin, nystatin, trimethoprim, and streptomycin (GC-VCNTS agar) was used to isolate gonococci from mice as described previously (51).
In vivo efficacy testing in the female mouse model.
Female BALB/c mice (NCI BALB/c strain; 6 to 7 weeks old; Charles River Laboratories) in the diestrus or anestrus stages of the estrous cycle were implanted with a 5-mg, 21-day-slow-release 17β-estradiol pellet (Innovative Research of America) and treated with antibiotics to promote long-term gonococcal infection per a standard infection protocol (25). Antibiotics were administered to suppress the overgrowth of the commensal flora that occurs under estradiol treatment and were STR (24 mg/ml; Sigma), administered via intraperitoneal (i.p.) injection twice daily on days −4 through −1, and trimethoprim (TMP; MP Biologicals), given in the drinking water (0.4 g/liter) through day −1. Both TMP and STR (5 g/liter) were provided in the drinking water from day 0 through the remainder of the study period. Mice were inoculated vaginally with 20 µl of a PBS suspension containing 106 CFU of FA1090 or 104 CFU of H041 bacteria on day −2, each of which is the lowest dose of N. gonorrhoeae that infects 80% to 100% of mice for at least 10 days (ID80–100) for each strain. Following collection of specimens for culture on day 0, CRO (0.2 ml, i.p.) and CFM (0.1 ml, orally [p.o.]) were administered to mice infected with FA1090 as a single dose. Mice infected with H041 received either one (QD), two (BID every 12 h), or three (TID every 8 h) doses of CRO or CFM over a 24-h period. GEN was administered to mice infected with H041 via i.p. injection (0.2 ml) for 5 doses, given 24 h apart. PBS was the negative control used for both FA1090 and H041 infection and was administered via the same route as the antibiotic being tested. Pre- and posttreatment cultures were performed by collecting vaginal mucus from all mice with a moistened sterile Puritan rayon swab (Fisher Scientific) and suspending the swab contents in 1 ml of GC broth (GCB). Undiluted and diluted (1:10 for FA1090, 1:100 for H041) samples were cultured for N. gonorrhoeae on GC-VCNTS agar using an Autoplater 4000 spiral plating system (Spiral Biotech). Heart infusion agar (HIA) was inoculated with a portion of the swab to screen for potentially inhibitory commensal bacteria (i.e., Pseudomonas aeruginosa, Proteus spp., or other members of the Enterobacteriaceae family) that might confound clearance data; none was isolated in this study. The infection was monitored by culture of vaginal swab specimens for 8 days following treatment. Mice were considered to have cleared the infection when cultures of vaginal swab specimens were negative (no CFU were recovered) for three or more consecutive days. The limit of detection was 20 CFU/ml; this value was used in the data analysis for mice from which no gonococci were recovered.
Pharmacokinetic analysis of plasma samples.
The same antibiotic and estrogen treatment protocol was followed for plasma sample collection from uninfected female BALB/c mice for pharmacokinetic analysis (SRI International, Menlo Park, CA). Following the administration of a single dose of CRO (i.p.) or CFM (p.o.) on day 0, venous blood samples were collected at 0.08, 0.25, 0.5, 1, 2, 4, 8, and 24 h postdose from the retro-orbital sinus of mice under isoflurane anesthesia and placed into tubes containing K3EDTA. Blood was collected from each mouse at two time points (n = 4 mice/time point), and samples were processed to plasma and then stored frozen at ≤−70°C until analysis by liquid chromatography-tandem mass spectrometry (LC-MS/MS).
CRO and CFM plasma concentrations were determined by liquid chromatography with tandem mass spectrometry (LC-MS/MS). Briefly, for CRO, LC-MS/MS was performed using a QTrap 5500 LC-MS/MS system (AB Sciex, Framingham, MA) in multiple-reaction-monitoring mode (MRM) and a Luna C18(2) (Phenomenex, Torrance, CA) 50- by 2-mm, 5-μm-particle-size column, using gradient elution with 0.1% formic acid in water and 0.1% formic acid in acetonitrile as the mobile phase. CRO was extracted from plasma samples using plasma protein precipitation with acetonitrile, and [13C-2H3]CRO was included as an internal standard. CRO concentrations were obtained by monitoring the MS-MS transition m/z 555.1 → m/z 396.1. The assay was linear over a range of 2 to 1,000 ng/ml (r2 = 0.9996). For quality control (QC) samples prepared with CRO at 5, 450, and 950 ng/ml in mouse plasma, the assay accuracy (as a percentage of the nominal value) ranged from 95.6% to 101% and the precision (percent coefficient of variation) ranged from 1.96% to 7.77%. For CFM, LC-MS/MS was performed using a 4000 QTrap LC-MS/MS system (AB Sciex, Framingham, MA) in MRM and a Synergi Polar-RP 80-Å (Phenomenex, Torrance, CA) 50- by 2-mm, 4-μm-particle-size column, using gradient elution with 0.5% formic acid in water and acetonitrile as the mobile phase. CFM was extracted from plasma samples using plasma protein precipitation with acetonitrile, and [13C3,15N2]CFM was included as an internal standard. CFM concentrations were obtained by monitoring the MS-MS transition m/z 453.945 → m/z 285.100. The assay was linear over a range of 4.5 to 7,000 ng/ml (r2 = 0.9991). For QC samples prepared with CFM at 13.4, 894, and 6,705 ng/ml in mouse plasma, the assay accuracy ranged from 96.2% to 110% and the precision ranged from 7.03% to 9.96%.
PK parameters were determined from single-dose data for each dose level by compartmental analysis (Phoenix WinNonlin [v.6.3] software; Certara, St. Louis, MO), with model selection being based on visual inspection of the fit and the correlation between the observed and calculated concentrations by Akaike’s information criterion. Plasma exposures, including those from multiple-dose administrations, were simulated using WinNonlin software with mean PK parameters across the doses tested, and simulated concentrations were verified to correspond with observed data, as possible. Plasma exposures increased almost linearly with increments in dose, based on the values of Cmax and the AUC for the range of time points measured. Exposures estimated from multiple doses were based on simulations using PK from single doses and therefore had more potential for error, particularly for the higher doses, where changes in bioavailability and/or clearance might impact exposures. To reflect free drug (i.e., unbound, microbiologically active drug), plasma concentration data were corrected for protein binding in mouse plasma (60% for CRO and 72.5% for CFM [36, 37]). Although the plasma protein binding data were obtained using plasma from uninfected mice, the localized vaginal gonococcal infection is not expected to dramatically impact the free drug levels or the PK. The MICs of CRO and CFM against both strains used for the PK analysis were based on agar dilution assays, performed as recommended by the CDC (52) and by using concentrations of 4, 3.5, 3, 2.5, 2, 1.5, and 1 mg/liter for CRO and 16, 14, 12, 10, 8, 6, and 4 mg/liter for CFX. All MIC assays were conducted in triplicate.
Preparation of test antibiotics.
Mice were weighed on day 0 prior to antibiotic administration, and the average weight for each treatment group was used to calculate the concentration of CRO, CFM, and GEN in the stock solutions needed to get the desired concentration (in milligrams per kilogram) per 200-μl (CRO, GEN) or 100-μl (CFM) dose. Ceftriaxone disodium salt hemi(heptahydrate) (CRO) and gentamicin sulfate (GEN) were prepared in sterile endotoxin-free distilled H2O (Teknova) and delivered by i.p. injection. Cefixime trihydrate (CFM) was prepared in sterile endotoxin-free PBS, pH 6.0 (Teknova), and 0.1 M NaHCO3 (1:10) and administered via oral gavage (with a 20-gauge 38-mm needle; Instech Laboratories). All antibiotics were from Sigma.
Infectious dose studies.
The ID80–100 of H041 and F89 was determined by inoculating estradiol-treated female mice given STR and TMP per the protocol described above with decreasing doses of bacteria suspended in PBS (102 to 106 CFU per mouse). Quantitative culture of vaginal swab specimens was performed for 12 days postinoculation.
Statistical analyses of efficacy data.
Differences in the duration of colonization were assessed using a Kaplan-Meier survivorship curve and the log-rank (Mantel-Cox) test. Differences in colonization load were assessed by a repeated-measures two-way analysis of variance (ANOVA) using Bonferroni’s post hoc analysis for multiple pairwise comparisons. Differences in the fold change in the number of gonococci recovered from pretreatment cultures and cultures collected 48 h after treatment were analyzed using a Kruskal-Wallis test with Dunn’s multiple comparisons to compare CRO treatment groups to the PBS-treated control group. All analyses were performed with GraphPad Prism (v.7.01) software.
Animal use assurances.
At the study endpoint, mice were euthanized using compressed CO2 gas in a CO2 gas chamber in the Laboratory Animal Medicine Facility. All animal experiments were conducted at the Uniformed Services University of the Health Sciences (USUHS), a facility fully accredited by the Association for the Assessment and Accreditation of Laboratory Animal Care, under a protocol that was approved by the USUHS Institutional Animal Care and Use Committee in accordance with all applicable federal regulations governing the protection of animals in research.
Supplementary Material
ACKNOWLEDGMENTS
This work was funded by an interagency agreement (AAI14024) between the National Institute of Allergy and Infectious Diseases (NIAID), part of the National Institutes of Health, and the Uniformed Services University of the Health Sciences (USUHS). PK studies in uninfected mice were supported by NIAID’s suite of preclinical services (contract no. HHSN2722011000221).
We declare no conflict of interest with this work.
The opinions and assertions expressed herein are those of the authors and do not necessarily reflect the official policy or position of the Uniformed Services University of the Health Sciences or the U.S. Department of Defense.
Footnotes
Supplemental material for this article may be found at https://doi.org/10.1128/AAC.01644-18.
REFERENCES
- 1.Wi T, Lahra MM, Ndowa F, Bala M, Dillon JR, Ramon-Pardo P, Eremin SR, Bolan G, Unemo M. 2017. Antimicrobial resistance in Neisseria gonorrhoeae: global surveillance and a call for international collaborative action. PLoS Med 14:e1002344. doi: 10.1371/journal.pmed.1002344. [DOI] [PMC free article] [PubMed] [Google Scholar]
- 2.Newman L, Rowley J, Vander Hoorn S, Wijesooriya NS, Unemo M, Low N, Stevens G, Gottlieb S, Kiarie J, Temmerman M. 2015. Global estimates of the prevalence and incidence of four curable sexually transmitted infections in 2012 based on systematic review and global reporting. PLoS One 10:e0143304. doi: 10.1371/journal.pone.0143304. [DOI] [PMC free article] [PubMed] [Google Scholar]
- 3.Hook EW, Handsfield HH. 1999. Gonococcal infections in the adult, p 451–466. In Holmes KK, Sparling PF, Mardh PA, Lemon S, Stamm W, Piot P, Wasserheit JM (ed), Sexually transmitted diseases, 3rd ed McGraw-Hill, New York, NY. [Google Scholar]
- 4.Heumann CL, Quilter LA, Eastment MC, Heffron R, Hawes SE. 2017. Adverse birth outcomes and maternal Neisseria gonorrhoeae infection: a population-based cohort study in Washington State. Sex Transm Dis 44:266–271. doi: 10.1097/OLQ.0000000000000592. [DOI] [PMC free article] [PubMed] [Google Scholar]
- 5.Borges-Costa J, Matos C, Pereira F. 2012. Sexually transmitted infections in pregnant adolescents: prevalence and association with maternal and foetal morbidity. J Eur Acad Dermatol Venereol 26:972–975. doi: 10.1111/j.1468-3083.2011.04194.x. [DOI] [PubMed] [Google Scholar]
- 6.Palafox SKV, Jasper S, Tauber AD, Foster SC. 2011. Ophthalmia neonatorum. J Clin Exp Ophthalmol 2:5. [Google Scholar]
- 7.Khauv P, Turner P, Soeng C, Soeng S, Moore CE, Bousfield R, Stoesser N, Emary K, Thanh DP, Baker S, Hang VT, van Doorn HR, Day NP, Parry CM. 2014. Ophthalmic infections in children presenting to Angkor Hospital for Children, Siem Reap, Cambodia. BMC Res Notes 7:784. doi: 10.1186/1756-0500-7-784. [DOI] [PMC free article] [PubMed] [Google Scholar]
- 8.Cohen MS. 2012. Classical sexually transmitted diseases drive the spread of HIV-1: back to the future. J Infect Dis 206:1–2. doi: 10.1093/infdis/jis303. [DOI] [PubMed] [Google Scholar]
- 9.Mlisana K, Naicker N, Werner L, Roberts L, van Loggerenberg F, Baxter C, Passmore JA, Grobler AC, Sturm AW, Williamson C, Ronacher K, Walzl G, Abdool Karim SS. 2012. Symptomatic vaginal discharge is a poor predictor of sexually transmitted infections and genital tract inflammation in high-risk women in South Africa. J Infect Dis 206:6–14. doi: 10.1093/infdis/jis298. [DOI] [PMC free article] [PubMed] [Google Scholar]
- 10.CDC. 2017. Update to CDC's sexually transmitted diseases treatment guidelines, 2006: fluoroquinolones no longer recommended for treatment of gonococcal infections. Morb Mortal Wkly Rep 56:332–336. [PubMed] [Google Scholar]
- 11.Bignell C, Unemo M, European STI Guidelines Editorial Board. 2013. 2012 European guideline on the diagnosis and treatment of gonorrhoea in adults. Int J STD AIDS 24:85–92. doi: 10.1177/0956462412472837. [DOI] [PubMed] [Google Scholar]
- 12.Unemo M, Bradshaw CS, Hocking JS, de Vries HJC, Francis SC, Mabey D, Marrazzo JM, Sonder GJB, Schwebke JR, Hoornenborg E, Peeling RW, Philip SS, Low N, Fairley CK. 2017. Sexually transmitted infections: challenges ahead. Lancet Infect Dis 17:e235–e279. doi: 10.1016/S1473-3099(17)30310-9. [DOI] [PubMed] [Google Scholar]
- 13.Workowski KA, Bolan GA, Centers for Disease Control and Prevention. 2015. Sexually transmitted diseases treatment guidelines, 2015. MMWR Recommend Rep 64(RR-03):1–137. [PMC free article] [PubMed] [Google Scholar]
- 14.de Curraize C, Kumanski S, Micaelo M, Fournet N, La Ruche G, Meunier F, Amarsy R, Jacquier H, Cambau E, Goubard A, Bercot B. 2016. Ceftriaxone-resistant Neisseria gonorrhoeae isolates (2010 to 2014) in France characterized by using whole-genome sequencing. Antimicrob Agents Chemother 60:6962–6964. doi: 10.1128/AAC.01568-16. [DOI] [PMC free article] [PubMed] [Google Scholar]
- 15.Gianecini R, Oviedo C, Stafforini G, Galarza P. 2016. Neisseria gonorrhoeae resistant to ceftriaxone and cefixime, Argentina. Emerg Infect Dis 22:1139–1141. doi: 10.3201/eid2206.152091. [DOI] [PMC free article] [PubMed] [Google Scholar]
- 16.Ohnishi M, Golparian D, Shimuta K, Saika T, Hoshina S, Iwasaku K, Nakayama S, Kitawaki J, Unemo M. 2011. Is Neisseria gonorrhoeae initiating a future era of untreatable gonorrhea?: detailed characterization of the first strain with high-level resistance to ceftriaxone. Antimicrob Agents Chemother 55:3538–3545. doi: 10.1128/AAC.00325-11. [DOI] [PMC free article] [PubMed] [Google Scholar]
- 17.Brunner A, Nemes-Nikodem E, Jeney C, Szabo D, Marschalko M, Karpati S, Ostorhazi E. 2016. Emerging azithromycin-resistance among the Neisseria gonorrhoeae strains isolated in Hungary. Ann Clin Microbiol Antimicrob 15:53. doi: 10.1186/s12941-016-0166-9. [DOI] [PMC free article] [PubMed] [Google Scholar]
- 18.Chisholm SA, Wilson J, Alexander S, Tripodo F, Al-Shahib A, Schaefer U, Lythgow K, Fifer H. 2016. An outbreak of high-level azithromycin resistant Neisseria gonorrhoeae in England. Sex Transm Infect 92:365–367. doi: 10.1136/sextrans-2015-052312. [DOI] [PubMed] [Google Scholar]
- 19.Public Health England. 2018. Update on investigation of UK case of Neisseria gonorrhoeae with high-level resistance to azithromycin and resistance to ceftriaxone acquired abroad. PHE Publications, London, United Kingdom. [Google Scholar]
- 20.Katz AR, Komeya AY, Kirkcaldy RD, Whelen AC, Soge OO, Papp JR, Kersh EN, Wasserman GM, O’Connor NP, O’Brien PS, Sato DT, Maningas EV, Kunimoto GY, Tomas JE. 2017. Cluster of Neisseria gonorrhoeae isolates with high-level azithromycin resistance and decreased ceftriaxone susceptibility, Hawaii, 2016. Clin Infect Dis 65:918–923. doi: 10.1093/cid/cix485. [DOI] [PMC free article] [PubMed] [Google Scholar]
- 21.Eyre DW, Sanderson ND, Lord E, Regisford-Reimmer N, Chau K, Barker L, Morgan M, Newnham R, Golparian D, Unemo M, Crook DW, Peto TE, Hughes G, Cole MJ, Fifer H, Edwards A, Andersson MI. 2018. Gonorrhoea treatment failure caused by a Neisseria gonorrhoeae strain with combined ceftriaxone and high-level azithromycin resistance, England, February 2018. Euro Surveill 23(27):pii=1800323 10.2807/1560-7917.ES.2018.23.27.1800323. [DOI] [PMC free article] [PubMed] [Google Scholar]
- 22.Whiley DM, Jennison A, Pearson J, Lahra MM. 2018. Genetic characterisation of Neisseria gonorrhoeae resistant to both ceftriaxone and azithromycin. Lancet Infect Dis 18:717–718. doi: 10.1016/S1473-3099(18)30340-2. [DOI] [PubMed] [Google Scholar]
- 23.Kirkcaldy RD, Weinstock HS, Moore PC, Philip SS, Wiesenfeld HC, Papp JR, Kerndt PR, Johnson S, Ghanem KG, Hook EW III.. 2014. The efficacy and safety of gentamicin plus azithromycin and gemifloxacin plus azithromycin as treatment of uncomplicated gonorrhea. Clin Infect Dis 59:1083–1091. doi: 10.1093/cid/ciu521. [DOI] [PMC free article] [PubMed] [Google Scholar]
- 24.Alirol E, Wi TE, Bala M, Bazzo ML, Chen XS, Deal C, Dillon JR, Kularatne R, Heim J, Hooft van Huijsduijnen R, Hook EW, Lahra MM, Lewis DA, Ndowa F, Shafer WM, Tayler L, Workowski K, Unemo M, Balasegaram M. 2017. Multidrug-resistant gonorrhea: a research and development roadmap to discover new medicines. PLoS Med 14:e1002366. doi: 10.1371/journal.pmed.1002366. [DOI] [PMC free article] [PubMed] [Google Scholar]
- 25.Jerse AE, Wu H, Packiam M, Vonck RA, Begum AA, Garvin LE. 2011. Estradiol-treated female mice as surrogate hosts for Neisseria gonorrhoeae genital tract infections. Front Microbiol 2:107. doi: 10.3389/fmicb.2011.00107. [DOI] [PMC free article] [PubMed] [Google Scholar]
- 26.Hobbs MM, Anderson JE, Balthazar JT, Kandler JL, Carlson RW, Ganguly J, Begum AA, Duncan JA, Lin JT, Sparling PF, Jerse AE, Shafer WM. 2013. Lipid A's structure mediates Neisseria gonorrhoeae fitness during experimental infection of mice and men. mBio 4:e00892-13. doi: 10.1128/mBio.00892-13. [DOI] [PMC free article] [PubMed] [Google Scholar]
- 27.Butler MM, Waidyarachchi SL, Connolly KL, Jerse AE, Chai W, Lee RE, Kohlhoff SA, Shinabarger DL, Bowlin TL. 2018. Aminomethyl spectinomycins as therapeutics for drug-resistant gonorrhea and chlamydia coinfections. Antimicrob Agents Chemother 62:e00325-18. doi: 10.1128/AAC.00325-18. [DOI] [PMC free article] [PubMed] [Google Scholar]
- 28.Schmitt DM, Connolly KL, Jerse AE, Detrick MS, Horzempa J. 2016. Antibacterial activity of resazurin-based compounds against Neisseria gonorrhoeae in vitro and in vivo. Int J Antimicrob Agents 48:367–372. doi: 10.1016/j.ijantimicag.2016.06.009. [DOI] [PMC free article] [PubMed] [Google Scholar]
- 29.Spencer SE, Valentin-Bon IE, Whaley K, Jerse AE. 2004. Inhibition of Neisseria gonorrhoeae genital tract infection by leading-candidate topical microbicides in a mouse model. J Infect Dis 189:410–419. doi: 10.1086/381125. [DOI] [PubMed] [Google Scholar]
- 30.Zeitlin L, Hoen TE, Achilles SL, Hegarty TA, Jerse AE, Kreider JW, Olmsted SS, Whaley KJ, Cone RA, Moench TR. 2001. Tests of Buffergel for contraception and prevention of sexually transmitted diseases in animal models. Sex Transm Dis 28:417–423. [DOI] [PubMed] [Google Scholar]
- 31.Gulati S, Zheng B, Reed GW, Su X, Cox AD, St Michael F, Stupak J, Lewis LA, Ram S, Rice PA. 2013. Immunization against a saccharide epitope accelerates clearance of experimental gonococcal infection. PLoS Pathog 9:e1003559. doi: 10.1371/journal.ppat.1003559. [DOI] [PMC free article] [PubMed] [Google Scholar]
- 32.Liu Y, Hammer LA, Liu W, Hobbs MM, Zielke RA, Sikora AE, Jerse AE, Egilmez NK, Russell MW. 2017. Experimental vaccine induces Th1-driven immune responses and resistance to Neisseria gonorrhoeae infection in a murine model. Mucosal Immunol 10:1594–1608. doi: 10.1038/mi.2017.11. [DOI] [PMC free article] [PubMed] [Google Scholar]
- 33.Shaughnessy J, Gulati S, Agarwal S, Unemo M, Ohnishi M, Su XH, Monks BG, Visintin A, Madico G, Lewis LA, Golenbock DT, Reed GW, Rice PA, Ram S. 2016. A novel factor H-Fc chimeric immunotherapeutic molecule against Neisseria gonorrhoeae. J Immunol 196:1732–1740. doi: 10.4049/jimmunol.1500292. [DOI] [PMC free article] [PubMed] [Google Scholar]
- 34.Zhu W, Chen CJ, Thomas CE, Anderson JE, Jerse AE, Sparling PF. 2011. Vaccines for gonorrhea: can we rise to the challenge? Front Microbiol 2:124. doi: 10.3389/fmicb.2011.00124. [DOI] [PMC free article] [PubMed] [Google Scholar]
- 35.Plante M, Jerse A, Hamel J, Couture F, Rioux CR, Brodeur BR, Martin D. 2000. Intranasal immunization with gonococcal outer membrane preparations reduces the duration of vaginal colonization of mice by Neisseria gonorrhoeae. J Infect Dis 182:848–855. doi: 10.1086/315801. [DOI] [PubMed] [Google Scholar]
- 36.van Ogtrop ML, Mattie H, Guiot HF, van Strijen E, Hazekamp-van Dokkum AM, van Furth R. 1990. Comparative study of the effects of four cephalosporins against Escherichia coli in vitro and in vivo. Antimicrob Agents Chemother 34:1932–1937. [DOI] [PMC free article] [PubMed] [Google Scholar]
- 37.Sakamoto H, Hirose T, Nakamoto S, Hatano K, Shibayama F, Kikuchi H, Mine Y, Kuwahara S. 1988. Pharmacokinetics of FK482, a new orally active cephalosporin, in animals. J Antibiot (Tokyo) 41:1896–1905. [DOI] [PubMed] [Google Scholar]
- 38.Craig WA. 1995. Interrelationship between pharmacokinetics and pharmacodynamics in determining dosage regimens for broad-spectrum cephalosporins. Diagn Microbiol Infect Dis 22:89–96. [DOI] [PubMed] [Google Scholar]
- 39.Unemo M, Golparian D, Nicholas R, Ohnishi M, Gallay A, Sednaoui P. 2012. High-level cefixime- and ceftriaxone-resistant Neisseria gonorrhoeae in France: novel penA mosaic allele in a successful international clone causes treatment failure. Antimicrob Agents Chemother 56:1273–1280. doi: 10.1128/AAC.05760-11. [DOI] [PMC free article] [PubMed] [Google Scholar]
- 40.Chisholm SA, Mouton JW, Lewis DA, Nichols T, Ison CA, Livermore DM. 2010. Cephalosporin MIC creep among gonococci: time for a pharmacodynamic rethink? J Antimicrob Chemother 65:2141–2148. doi: 10.1093/jac/dkq289. [DOI] [PubMed] [Google Scholar]
- 41.Jaffe HW, Schroeter AL, Reynolds GH, Zaidi AA, Martin JE Jr, Thayer JD. 1979. Pharmacokinetic determinants of penicillin cure of gonococcal urethritis. Antimicrob Agents Chemother 15:587–591. doi: 10.1128/AAC.15.4.587. [DOI] [PMC free article] [PubMed] [Google Scholar]
- 42.Moran JS, Levine WC. 1995. Drugs of choice for the treatment of uncomplicated gonococcal infections. Clin Infect Dis 20(Suppl 1):S47–S65. [DOI] [PubMed] [Google Scholar]
- 43.Deguchi T, Yasuda M, Yokoi S, Ishida K, Ito M, Ishihara S, Minamidate K, Harada Y, Tei K, Kojima K, Tamaki M, Maeda S. 2003. Treatment of uncomplicated gonococcal urethritis by double-dosing of 200 mg cefixime at a 6-h interval. J Infect Chemother 9:35–39. doi: 10.1007/s10156-002-0204-8. [DOI] [PubMed] [Google Scholar]
- 44.Hobbs MM, Sparling PF, Cohen MS, Shafer WM, Deal CD, Jerse AE. 2011. Experimental gonococcal infection in male volunteers: cumulative experience with Neisseria gonorrhoeae strains FA1090 and MS11mkC. Front Microbiol 2:123. doi: 10.3389/fmicb.2011.00123. [DOI] [PMC free article] [PubMed] [Google Scholar]
- 45.Cohen MS, Cannon JG, Jerse AE, Charniga LM, Isbey SF, Whicker LG. 1994. Human experimentation with Neisseria gonorrhoeae: rationale, methods, and implications for the biology of infection and vaccine development. J Infect Dis 169:532–537. [DOI] [PubMed] [Google Scholar]
- 46.Cohen MS, Cannon JG. 1999. Human experimentation with Neisseria gonorrhoeae: progress and goals. J Infect Dis 179:S375–S379. doi: 10.1086/513847. [DOI] [PubMed] [Google Scholar]
- 47.Packiam M, Yedery RD, Begum AA, Carlson RW, Ganguly J, Sempowski GD, Ventevogel MS, Shafer WM, Jerse AE. 2014. Phosphoethanolamine decoration of Neisseria gonorrhoeae lipid A plays a dual immunostimulatory and protective role during experimental genital tract infection. Infect Immun 82:2170–2179. doi: 10.1128/IAI.01504-14. [DOI] [PMC free article] [PubMed] [Google Scholar]
- 48.Packiam M, Wu H, Veit SJ, Mavrogiorgos N, Jerse AE, Ingalls RR. 2012. Protective role of Toll-like receptor 4 in experimental gonococcal infection of female mice. Mucosal Immunol 5:19–29. doi: 10.1038/mi.2011.38. [DOI] [PMC free article] [PubMed] [Google Scholar]
- 49.Genco CA, Chen CY, Arko RJ, Kapczynski DR, Morse SA. 1991. Isolation and characterization of a mutant of Neisseria gonorrhoeae that is defective in the uptake of iron from transferrin and haemoglobin and is avirulent in mouse subcutaneous chambers. J Gen Microbiol 137:1313–1321. doi: 10.1099/00221287-137-6-1313. [DOI] [PubMed] [Google Scholar]
- 50.Dillard JP. 2011. Genetic manipulation of Neisseria gonorrhoeae. Curr Protoc Microbiol Chapter 4:Unit4A.2. doi: 10.1002/9780471729259.mc04a02s23. [DOI] [PMC free article] [PubMed] [Google Scholar]
- 51.Jerse AE. 1999. Experimental gonococcal genital tract infection and opacity protein expression in estradiol-treated mice. Infect Immun 67:5699–5708. [DOI] [PMC free article] [PubMed] [Google Scholar]
- 52.National Center for Health Statistics, CDC. 2013. Agar dilution antimicrobial susceptibility testing. http://www.cdc.gov/std/Gonorrhea/lab/agar.htm.
Associated Data
This section collects any data citations, data availability statements, or supplementary materials included in this article.