

Abstract
The zoonotic pathogen Brucella abortus is part of the Rhizobiales, which are alpha‐proteobacteria displaying unipolar growth. Here, we show that this bacterium exhibits heterogeneity in its outer membrane composition, with clusters of rough lipopolysaccharide co‐localizing with the essential outer membrane porin Omp2b, which is proposed to allow facilitated diffusion of solutes through the porin. We also show that the major outer membrane protein Omp25 and peptidoglycan are incorporated at the new pole and the division site, the expected growth sites. Interestingly, lipopolysaccharide is also inserted at the same growth sites. The absence of long‐range diffusion of main components of the outer membrane could explain the apparent immobility of the Omp2b clusters, as well as unipolar and mid‐cell localizations of newly incorporated outer membrane proteins and lipopolysaccharide. Unipolar growth and limited mobility of surface structures also suggest that new surface variants could arise in a few generations without the need of diluting pre‐existing surface antigens.
Keywords: Brucella, lipopolysaccharide, outer membrane, unipolar growth
Subject Categories: Membrane & Intracellular Transport; Microbiology, Virology & Host Pathogen Interaction
Introduction
Cellular envelope growth is an essential feature of all organisms in order to increase in size and to divide afterward in order to generate daughter cells. Bacteria display different modes of growth. The model organism Escherichia coli incorporates new material dispersed along the sidewalls of the cell during elongation, typical for lateral growth (Burman et al, 1983; Woldringh et al, 1987; Wientjes & Nanninga, 1989; de Pedro et al, 1997). The old poles are thus composed of old envelope material, whereas the rest of the cell is a mixture of old and new inserted material. In contrast, bacteria belonging to the order Rhizobiales are characterized by unipolar growth (Brown et al, 2012), in which the insertion of new outer membrane (OM) material during elongation takes place at one pole, namely the new pole. This leads to an asymmetric distribution of cell wall material after division, where one daughter cell is comprised mostly, if not exclusively, of new material and the pre‐existing cell, the mother cell, retains the old envelope components.
Brucella abortus is an α‐proteobacterium and one of the etiological agents of brucellosis, a worldwide spread zoonosis infecting domestic and wildlife cattles (Moreno & Moriyón, 2006). Together with the other tested Rhizobiales, e.g., Agrobacterium tumefaciens, Sinorhizobium meliloti and Ochrobactrum anthropi, labeling with Texas Red‐X succinimidyl ester (TRSE) revealed the new pole and the constriction site as proposed growth sites during elongation and division, respectively (Brown et al, 2012). TRSE is covalently binding to reactive amines accessible on the bacterial surface.
The OM of Gram‐negative bacteria is an asymmetric bilayer with phospholipids on the inner leaflet and lipopolysaccharide (LPS) on the outer leaflet (Beveridge, 1999). This structure acts classically as a permeability barrier (Nikaido & Vaara, 1985) and is among other things involved in the interactions between pathogens and their hosts. LPS is composed of lipid A, linked to the core, to which the O‐chain, also called O‐polysaccharide, is attached. The LPS of Brucella differs from the classical LPS of E. coli (as reviewed in Lapaque et al, 2005). For instance, the lipid A of Brucella LPS contains longer acyl chains (Lapaque et al, 2005) and the core is a branched structure (Conde‐Alvarez et al, 2012). Moreover, the LPS of Brucella has only a low endotoxic activity (see review; Lapaque et al, 2005; Cardoso et al, 2006) compared to E. coli LPS.
In general, the most variable part of LPS is the O‐chain, which in Brucella is an unbranched homopolymer of N‐formyl‐perosamine (Moreno & Moriyón, 2006). If the O‐chain is attached to the LPS core, it is classified as smooth LPS (S‐LPS). The more relevant zoonotic species, B. abortus, Brucella melitensis and Brucella suis, have a smooth phenotype (Moreno & Moriyón, 2006). Based on investigations of LPS extractions of several smooth Brucella strains on SDS–PAGE, the length of the O‐chain can highly vary inside a single population and between species (Dubray & Limet, 1987; Bowden et al, 1995). In contrast, if the O‐chain is missing and LPS is only made of lipid A and core, it is named rough LPS (R‐LPS). The naturally occurring rough species identified so far, Brucella ovis and Brucella canis, have a reduced virulence to their specific hosts (Moreno & Moriyón, 2006). Dissociation from S‐LPS to R‐LPS was reported to occur in culture and during infection in Brucella (Turse et al, 2011).
Besides LPS, the OM is also composed of outer membrane proteins (Omps). It was estimated that they cover around 25% of the bacterial surface in E. coli (Amro et al, 2000). Recently, it was shown that Omps of E. coli is organized in Omps clusters, which are homogeneously distributed over the cell (Rassam et al, 2015). These Omps clusters are only moving due to the insertion of new Omp islands pushing pre‐existing islands to the cell poles, highlighting the low mobility of Omps in the OM (Rassam et al, 2015). In B. abortus, there are two major Omps identified, Omp25 and Omp2b (Dubray & Bezard, 1980), which are both exposed at the cell surface. The function of the non‐essential Omp25 is not identified yet, whereas the essential porin Omp2b forms trimers in the OM and is proposed to be involved in nutrient uptake (Douglas et al, 1984; Mobasheri et al, 1997).
In the present study, the surface of the OM of B. abortus was analyzed using immunofluorescence (IF), flow cytometry, and atomic force microscopy (AFM) allowing the characterization of the topography of the cell surface at the nanoscale level. These analyses reveal heterogeneity in the OM, in which clusters of Omp2b co‐localize with R‐LPS. Moreover, insertion sites of Omp25, peptidoglycan (PG) and LPS are found to be located to the new pole and to the division site. Interestingly, Omp25 and Omp2b, and LPS do not diffuse from their primary insertion sites, showing the absence of long‐range diffusion of these major components of the B. abortus OM. This characteristic has consequences for the generation of daughter cells with a different surface antigen.
Results
The OM of Brucella abortus is heterogeneous
In order to investigate the structure of the OM of the smooth B. abortus 544 wild‐type (WT) strain (Moreno & Moriyón, 2006), the presence of S‐LPS and R‐LPS on the bacterial surface was investigated by IF and flow cytometry. The specificities of the monoclonal antibodies (mAbs) were checked (Appendix Fig S1) and were consistent with previous data (Cloeckaert et al, 1992a, 1993). The mAb specific for R‐LPS recognizes the lateral branch of the core (Gil‐Ramirez et al, 2014) in the absence of the O‐chain; thus, the characteristic higher molecular weight bands of S‐LPS are not detected in Western blot (Appendix Fig S1A). Co‐localization of S‐LPS and R‐LPS by IF showed strikingly different localization patterns. S‐LPS was homogeneously distributed, whereas R‐LPS showed a heterogeneous distribution along the cell (n = 477 bacteria) (Figs 1A and EV1). Localization of R‐LPS can differ from full labeling to partial or patchy labeling. Nevertheless, both LPS types are co‐localizing with S‐LPS present in R‐LPS clusters.
Figure 1. Heterogeneity of the OM of the smooth B. abortus wild‐type strain.
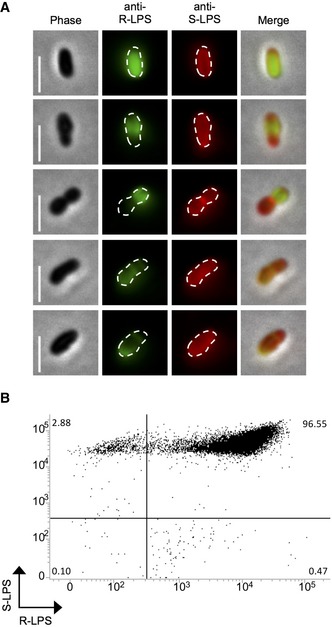
- Localization of R‐LPS (green) and S‐LPS (red) in exponential phase bacteria. Scale bars: 2 μm.
- Distribution of R‐LPS and S‐LPS in exponential phase culture analyzed by flow cytometry (one representative example among three biological replicates, n = 20,000 events). Numbers in each corner correspond to % of relative frequencies.
Figure EV1. Distribution of R‐LPS and S‐LPS along the bacterial surface.
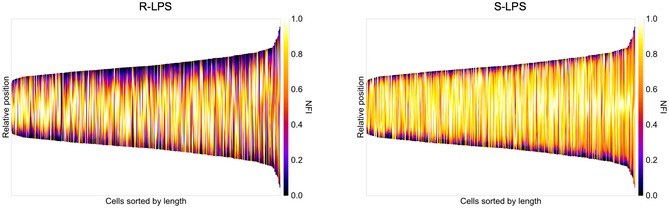
Co‐localization of R‐LPS and S‐LPS by IF and demographic representation of fluorescence intensities. Bacteria are sorted according to their cell length. NFI: normalized fluorescence intensity. n = 477 bacteria (three biological replicates).
The high diversity in the proportion of R‐LPS on the bacterial surface could also be detected by flow cytometry using bacteria labeled with mAbs specific for S‐LPS and R‐LPS (Fig 1B). Indeed, the fluorescence intensity corresponding to R‐LPS presented a wider distribution in comparison to the S‐LPS fluorescence (Coefficient of variation CVR‐LPS = 75.8 ± 13.8% (mean ± SD) and CVS‐LPS = 46.8 ± 4.5% (mean ± SD), n = 3 independent experiments, 20,000 events each). This was consistent with a higher variability in the R‐LPS distribution among the bacterial cells. In general, 97.4 ± 1.1% (mean ± SD, n = 3 independent experiments, 20,000 events each) of the population in an exponential growth phase could be classified as containing a mix of S‐LPS and R‐LPS under this condition. Only 2.2 ± 0.9% (mean ± SD) were exclusively smooth and 0.2 ± 0.3% (mean ± SD) were exclusively rough in exponential growth phase.
The presence of R‐LPS molecules on the bacterial surface could also be associated with an increase in surface roughness, thus leading to an irregular surface due to the co‐localization of R‐LPS and S‐LPS (Fig 2). This phenomenon can be measured by AFM coupled to fluorescence microscopy. Thanks to the ability of AFM to perform high‐resolution imaging, it is possible using this technology to get access to quantifiable surface structure information such as roughness (Formosa et al, 2012). The average roughness (Ra) was measured on bacteria labeled with the mAb specifically recognizing R‐LPS. Areas enriched in R‐LPS in the WT strain (R‐LPS+ area), identified by fluorescence microscopy, displayed a more irregular surface and therefore a higher Ra (Figs 2A and B, and EV2A). This is consistent with a high abundance of short R‐LPS (without O‐chain) mixed with long S‐LPS (with O‐chain) in the same area. Their roughness (Ra = 7.4 ± 3.2 nm (mean ± SD), n = 13 bacteria) appears systematically higher than for the unlabeled areas (R‐LPS− area, Ra = 4.5 ± 1.6 nm (mean ± SD), n = 13 bacteria), without detectable R‐LPS by IF (Fig 2A and B). A higher amount of R‐LPS molecules in the WT increased the Ra by about 1.6‐fold. As a positive control, the rough mutant strain B. abortus Δgmd, lacking the GDP‐mannose dehydratase Gmd involved in the LPS O‐chain biosynthesis (Godfroid et al, 2000) and thus having only R‐LPS, was used (Appendix Figs S1 and S2). Similar to the WT cells, two areas were analyzed per bacterium (Fig 2A and B) and both, area 1 and area 2, showed a low roughness [Fig 2B, Ra area 1 = 2.8 ± 0.8 nm (mean ± SD), Ra area 2 = 3.4 ± 1 nm (mean ± SD), n = 7 bacteria]. These low Ra values are consistent with a homogeneous R‐LPS layer on the mutant strain (Ratio of roughness close to 1, Fig EV2A). Moreover, unlabeled WT and Δgmd cells were analyzed revealing similar differences of roughness between the two areas in the WT and minor differences in unlabeled Δgmd cells (Fig EV2B–D). This indicates that labeling with the mAb does not strongly affect the measured Ra values.
Figure 2. Differences in surface structure of the OM investigated by AFM.
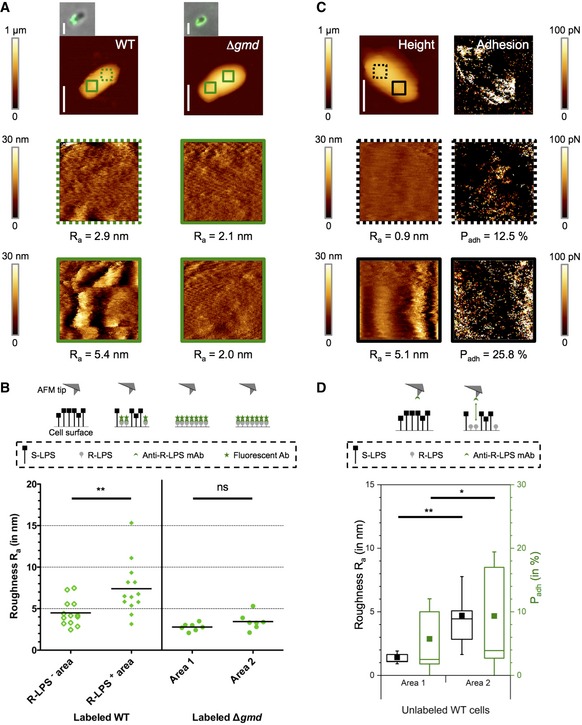
- Roughness measurements on R‐LPS labeled (green) WT and Δgmd cells. AFM images of whole bacteria and of the separated areas (colored squares in first images, 0.4 × 0.4 μm2) are shown. The arithmetic roughness Ra is indicated below each area. Scale bars: 1 μm.
- Quantitative roughness measurement of R‐LPS labeled WT and Δgmd cells. The areas with the lower roughness (more regular surfaces) of Δgmd cells were assigned as areas 1. mAb: monoclonal antibody. Ab: antibody. n WT = 13 bacteria. n Δgmd = 7 bacteria. Differences were statistically analyzed by t‐test. **P < 0.01. ns: not significant.
- Detection of forces between AFM tip functionalized with mAb against R‐LPS and unlabeled WT cells. Height image and the corresponding adhesion image are shown on top and zooms of depicted areas (black squares, 0.4 × 0.4 μm2) below. The arithmetic roughness Ra and percentage of adhesion Padh are indicated below each area. Scale bar: 1 μm.
- Correlation between roughness and detection of R‐LPS on unlabeled WT cells. The areas with the lower roughness (more regular surfaces) were assigned as areas 1. The boxplot represents the mean values (squares), the median (horizontal line), the 25 and 75% quartiles (box limits) and the standard deviations (whiskers). n = 9 bacteria. Error bars: SD. Statistical differences were analyzed by t‐test. **P < 0.01. *P < 0.05.
Figure EV2. Analysis of surface structure by AFM.
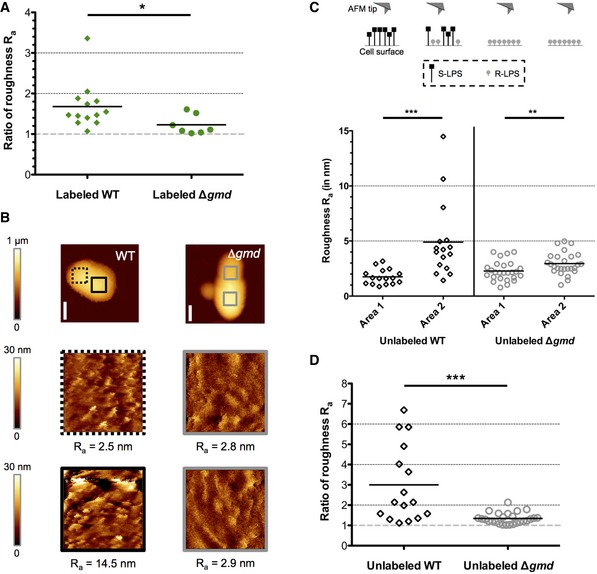
- Ratio of roughness from Fig 2B. between R‐LPS+ and R‐LPS− areas of the WT (n = 13 bacteria) and between area 2 (higher roughness, irregular surface) and area 1 (lower roughness, regular surface) of Δgmd (n = 7 bacteria), respectively. Gray dashed line shows ratio = 1 corresponding to homogeneity in surface structure. Statistical analysis (t‐test and Mann–Whitney U‐test) showed significance of *P < 0.05.
- Roughness measurement of unlabeled WT and Δgmd cells. AFM images of whole bacteria and of the separated areas (colored squares in first images) are shown. The arithmetic roughness Ra is indicated below each area. Scale bars: 500 nm.
- Quantitative roughness measurement of unlabeled WT and Δgmd cells. The areas with the lower roughness (more regular surfaces) were assigned as areas 1. n WT = 16 bacteria. n Δgmd = 26 bacteria. Differences were statistically analyzed by t‐test. ***P < 0.001. **P < 0.01.
- Ratio of roughness from (B) between area 2 (higher roughness, irregular surface) and area 1 (lower roughness, regular surface) of WT (n = 16 bacteria) and Δgmd (n = 26 bacteria), respectively. Gray dashed line shows ratio = 1 corresponding to homogeneity in surface structure. Statistical analysis (t‐test and Mann–Whitney U‐test) showed significance of ***P < 0.001.
In addition, multiparametric imaging that offers the possibility to image the surface structure while mapping their adhesive properties at high‐spatial resolution (Chopinet et al, 2013), was performed on unlabeled WT cells with AFM tips functionalized with the anti‐R‐LPS mAb (see Materials and Methods for details). Using this advanced AFM mode, it is then possible to directly link adhesive events with the presence of R‐LPS on the cell surface and quantify them as the percentage of adhesion, Padh (Fig 2C and D). On each cell, the areas with the lower Ra indicating a more regular surface structure were assigned area 1 (Ra area1 = 1.4 ± 0.5 nm (mean ± SD), n = 9 bacteria), whereas the areas with the higher Ra and thus a more irregular surface were determined as area 2 (Ra area2 = 4.7 ± 3.1 nm (mean ± SD), n = 9 bacteria), respectively. We observed that this distinction was correlated with a statistically significant difference in Padh, with the irregular surface area (area 2) showing a higher Padh than the uniform area (area 1) (P < 0.05). This result is consistent with an increased roughness in presence of R‐LPS clusters in the heterogeneous surface structure.
Clusters of R‐LPS are co‐localizing with the essential Omp2b
Given the heterogeneous localization of R‐LPS on the B. abortus cell surface (Fig 1A), we were interested in investigating the localization of other OM components. Interestingly, one of the major Omp, the essential porin Omp2b (Douglas et al, 1984), also displayed a heterogeneous distribution when localized with mAb (A68/15B06/C08) directed against Omp2b (Paquet et al, 2001) by IF (Fig 3A). Similar to the R‐LPS distribution, there was also a high diversity of distributions ranging from full to partial or patchy localization. This was also found in the rough strain Δgmd, suggesting that the patchy labeling is not an artifact due to the steric hindrance of mAb binding to Omp2b by S‐LPS. Labeling with another mAb (A68/25G05/A05) also directed against Omp2b (Cloeckaert et al, 1990) showed the same heterogeneity in localization. We thus wondered whether Omp2b and R‐LPS could be co‐localized. We observed that it was indeed the case, as they displayed co‐localization patterns in double labeling IF experiments (Fig 3A). When analyzing the Pearson correlation coefficient (PCC) r between Omp2b and R‐LPS fluorescence signals, 71.9% (318/442 bacteria) of an exponential phase culture showed a PCC r significantly higher than 0 (P < 0.01) and therefore a positive linear correlation. Analysis of the fluorescence intensities at each pixel indicated that the number of pixels that are positive for the two labelings is threefold more abundant than expect by chance (i.e., under the null hypothesis of independent labelings), which is statistically significant (χ2 = 10,729, P < 10−10, 1 degree of freedom).
Figure 3. Co‐localization of R‐LPS and the essential porin Omp2b.
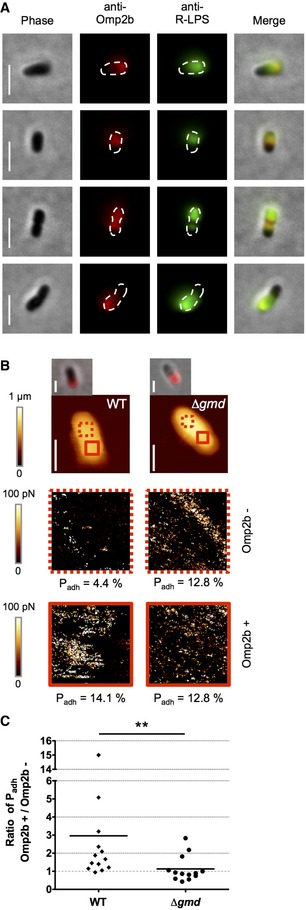
- Co‐localization of Omp2b (red) and R‐LPS (green) in exponential phase bacteria. Scale bars: 2 μm.
- Co‐detection of Omp2b (red) and R‐LPS by AFM. R‐LPS was detected using AFM tips functionalized with mAb against R‐LPS. AFM images of whole bacteria and of the separated areas (red squares in first images, 0.4 × 0.4 μm2) are shown. The percentages of adhesion Padh are indicated below each area. Scale bars: 1 μm.
- Adhesion ratio between the Omp2b positive area compared to the Omp2b negative area. Gray dashed line shows ratio = 1 corresponding to homogeneity in surface structure. n WT = 13 bacteria, n Δgmd = 13 bacteria. Statistical analysis with Mann–Whitney U‐test showed **P < 0.01.
The co‐localization of R‐LPS and Omp2b was also investigated by AFM. Omp2b was detected by IF in order to determine Omp2b positive (Omp2b+) and negative (Omp2b−) areas on individual cells. The AFM tip was functionalized with the mAb directed against R‐LPS (Cloeckaert et al, 1993) and the interaction between the tip and the cell surface was measured (Fig 3B). On the WT cells, the Padh value, correlating to the detection of R‐LPS, was higher in Omp2b+ areas (Padh = 15.4 ± 7.0% (mean ± SD), n = 13 bacteria) compared to Omp2b− areas (Padh=8.7 ± 5.3% (mean ± SD), n = 13 bacteria) (Appendix Fig S3 for a comprehensive summary), with a ratio Omp2b+/Omp2b− of 3.0 ± 3.8 (mean ± SD, n = 13 bacteria, Fig 3C). This is consistent with the enrichment of R‐LPS in the Omp2b+ areas. As a positive control, the mutant strain Δgmd expressing only R‐LPS was imaged with the same tip. A Padh ratio Omp2b+/Omp2b− close to 1 (1.1 ± 0.7 (mean ± SD), n = 13 bacteria) was obtained (Fig 3C), as expected for a homogeneous cell surface composed of only R‐LPS. This result further corroborates a co‐localization of Omp2b and R‐LPS clusters on WT cells.
Unipolar insertion of Omp25 and absence of long‐range diffusion of Omps
It is known that in the order Rhizobiales, labeling of bacteria with TRSE and follow up of subsequent growth in the absence of the dye indicates that new OM components are incorporated at the new pole and at the constriction site (Brown et al, 2012). However, the nature of the OM compounds labeled with TRSE is unknown, and the incorporation of specific components has never been investigated to our knowledge.
During the analysis of the localization of OM components by IF, Omp25, one of the major Omp of B. abortus (Dubray & Bezard, 1980), was found to have a homogenous distribution [83.7 ± 8.2% (mean ± SD), n = 479 bacteria, five biological replicates] on the cell surface (Fig 4A, panel 0 h), suggesting that it is continuously produced during the cell cycle like previously reported (Francis et al, 2017). The specificity of the anti‐Omp25 mAb (Cloeckaert et al, 1990) was additionally confirmed by IF and Western blot with the deletion strain B. abortus Δomp25 (Appendix Fig S4). The mAb directed against Omp25 can therefore be used to monitor the incorporation of Omp25 in the OM by labeling the pool of pre‐existing Omp25 followed by a period of growth incorporating new Omp25, which are unlabeled (the antibody was removed before growth was resumed). TRSE‐labeled bacteria were labeled by IF with the mAb directed against Omp25. Initially, Omp25 was homogenously distributed on the bacterial surface (Fig 4A, panel 0 h). Bacteria labeled with TRSE and anti‐Omp25 mAb were further grown in the absence of both labelings, generating an envelope that is not labeled with Texas Red at the new pole for most of the cells, at the constriction site and new pole or rarely at the constriction site only (Fig 4A and B). Interestingly, these TRSE‐negative regions mapped with areas negative for the Omp25 labeling [PCC r = 0.88 ± 0.03 (mean ± SD), n = 279 bacteria]. Newly incorporated, and therefore unlabeled, Omp25 was mostly incorporated at the new pole [79.8 ± 6.5% (mean ± SD), n = 279 bacteria] and/or at the constriction site under these experimental conditions (Fig 4C). The labeling with TRSE had no severe impact on incorporation of new Omp25 (Fig 4A, second panel 2 h) suggesting that TRSE‐negative areas indeed comprise newly incorporated, unlabeled Omp25. In this experiment, the proportion of bacteria displaying a homogeneous distribution of Omp25 was 67.1 ± 7.9% (mean ± SD, n = 660 bacteria, three biological replicates) and was slightly decreased in comparison with the previous experiment (Fig 4A, panel 0 h). This could be explained by a later phase in culture (2 h of additional growth in Fig 4A, second panel 2 h). The co‐existence of Omp25‐positive and Omp25‐negative areas on the same bacterium showed that this protein does not exhibit long‐range diffusion on the bacterial surface. Moreover, the heterogeneously distributed Omp2b was also not moving into the TRSE‐negative areas in IF experiments (Figs 4D and EV3). This could be statistically confirmed by analyzing the distribution of Omp25‐ and Omp2b‐positive pixels in areas positive and negative for TRSE, showing that Omp25 and Omp2b do not co‐localize with TRSE‐negative zones (Fig 4E, P < 0.001).
Figure 4. Unipolar insertion of Omp25 and low mobility of Omp25 and Omp2b.
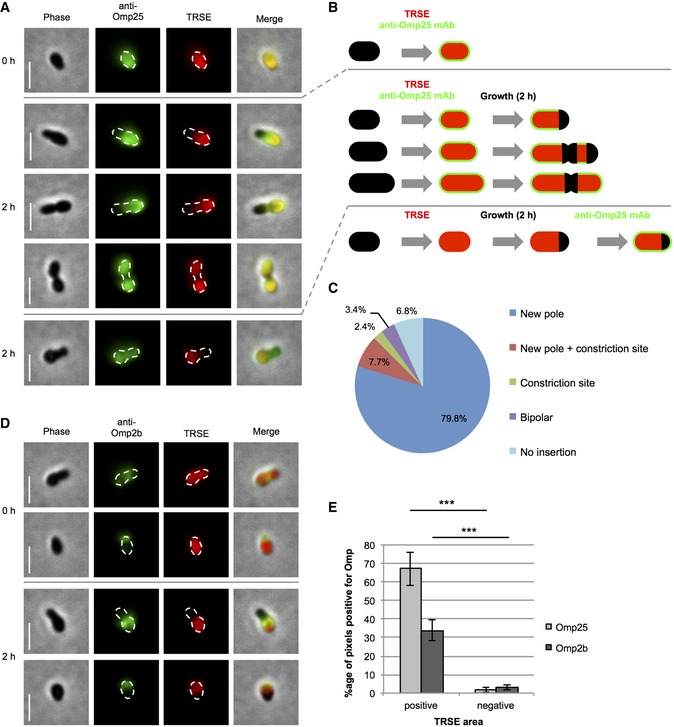
- Localization of initially labeled Omp25 (green) on TRSE‐labeled (red) bacteria before (0 h) and after 2 h of growth in the absence of both labelings (2 h). As a control, Omp25 localization after pulse‐chase labeling with TRSE is shown at the bottom panel. Scale bars: 2 μm.
- Model of TRSE (red) and Omp25 (green) labeling corresponding to (A). Incorporation of new material at the pole and/or at the constriction site is shown as black areas.
- Quantification of localization of newly inserted Omp25 represented by negative Omp25 areas from (A). Numbers are indicating mean percentages. n = 279 bacteria (five biological replicates).
- Localization of initially labeled Omp2b (green) on TRSE‐labeled (red) bacteria before (0 h) and after 2 h of growth in the absence of both labelings (2 h). Scale bars: 2 μm.
- Co‐localization of Omp25‐ and Omp2b‐positive pixels with TRSE‐positive or TRSE‐negative pixels, respectively. Error bars correspond to SD from independent experiments. Differences were statistically analyzed by t‐test. ***P < 0.001. n Omp25 = 279 bacteria, 85,666 pixels (five biological replicates). n Omp2b = 252 bacteria, 74,630 pixels (three biological replicates).
Figure EV3. Single‐cell analysis of fluorescence signals of TRSE and Omp2b labeled bacteria.
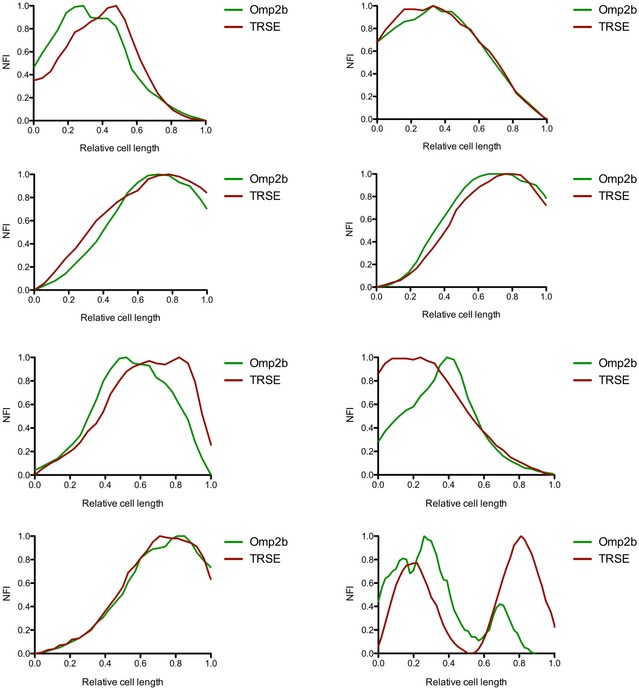
Bacteria were labeled with TRSE (red) and anti‐Omp2b mAb (green) and subsequently grown for 2 h in the absence of both labelings. Examples show bacteria of different size and are originating from data shown in Fig 4D and E. NFI: normalized fluorescence intensity.
Taken together, these results allow us to propose that at least two major Omps of B. abortus are poorly mobile on the bacterial surface in time and space scales applied in these experiments.
PG is inserted at the same sites than Omp25
Furthermore, the incorporation of new PG was investigated using the fluorescent D‐amino acid HCC‐amino‐D‐alanine (HADA), allowing an efficient labeling of newly synthesized PG (Kuru et al, 2012). Bacteria expressing the old pole marker PdhS‐mCherry (Hallez et al, 2007) were labeled for 5 min with HADA, fixed and analyzed by fluorescence microscopy. In agreement with the previously proposed growth sites, newly incorporated PG was inserted at the new pole and at the constriction site (Fig 5A and B). Analysis of the HADA fluorescence intensity showed a polar incorporation for most cells (Fig 5C). In longer cells, the PG insertion was directed to the mid‐cell at the constriction site.
Figure 5. Unipolar insertion of PG.
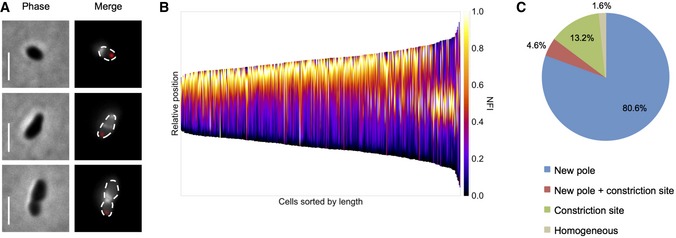
- Short pulse labeling of exponential phase bacteria with the fluorescent D‐amino acid HADA. Merge is showing old pole marker PdhS‐mCherry (red) and PG insertion sites (white). Scale bars: 2 μm.
- Demographic representation of HADA labeling. Bacteria were sorted according to their cell length and oriented with the old pole at the bottom of the demograph by PdhS‐mCherry fluorescence signal. NFI: normalized fluorescence intensity. n = 393 bacteria (three biological replicates).
- Quantification of localization of PG insertion sites from (A). Numbers are mean percentages. n = 393 bacteria (three biological replicates).
LPS is inserted at the growth sites and is not highly mobile
Since Omp25 and PG are inserted at the new pole and at the constriction site (Figs 4A and 5A), we wondered whether LPS was incorporated at the same growth areas. To answer this question, we constructed a Δgmd rough strain where the synthesis of S‐LPS can be induced by controlling gmd. As indicated above, the absence of the O‐chain and the rough phenotype of Δgmd were checked by IF using the mAb directed against S‐LPS (Appendix Fig S1B) and by Western blot (Appendix Figs S1A and S2A). A copy of gmd was provided on a plasmid under the control of the E. coli lac promoter (plac‐gmd) and was therefore inducible with isopropyl β‐D‐1‐thiogalactopyranoside (IPTG). Under normal growth conditions in rich medium, the Δgmd plac‐gmd strain had a rough phenotype without detectable O‐chain on its surface in the absence of IPTG (Fig 6A) and displayed a slight growth defect similar to the Δgmd parental strain (Appendix Fig S5A). As an indicator of growth, bacteria were labeled with eFluor dye, which is labeling the surface in a similar way as TRSE by covalent binding to accessible amines. When the strain was induced with IPTG for 4 h, a portion of bacteria displayed detectable S‐LPS on their surface (Fig 6A). Empty vector negative controls are shown in Appendix Fig S5B. S‐LPS localization by IF revealed that it was mostly detected at the new pole (66.9 ± 1.8% (mean ± SD), n = 468 bacteria), i.e., opposite to the old pole marker PdhS‐mCherry and in the eFluor negative part of the OM (Fig 6B and C). The S‐LPS could also be detected at the constriction site (Fig 6A–C). A small proportion of bacteria showed S‐LPS insertion at both poles (5.0 ± 2.1% (mean ± SD), n = 468 bacteria). This could be explained by the fact that if a divisional bacterium inserted new S‐LPS at the new pole and the constriction site (see Fig 6A, Image 2 Δgmd plac‐gmd +IPTG) and directly divided afterward, one of the daughter cells would show a bipolar S‐LPS labeling. Additionally, a minor population of the cells showed a homogenous S‐LPS localization [2.1 ± 1.7% (mean ± SD), n = 468 bacteria] and only one bacterium [0.1 ± 0.3% (mean ± SD), n = 468 bacteria] was found to inserted S‐LPS at the old pole. Consistent with the experiments described above showing the unipolar insertion of Omps and PG at the new pole and at the constriction site, here we show that LPS is also incorporated at these two growth sites. Observations reported in Fig 6A also suggest that S‐LPS is displaying a very poor mobility within the time of the presented experiment (4 h). Indeed, a high mobility of S‐LPS would have given homogeneously distributed S‐LPS (with O‐chain) on the bacterial surface after IPTG induction in the Δgmd plac‐gmd strain (Fig 6A), which is not the case.
Figure 6. Unipolar insertion and low mobility of LPS.
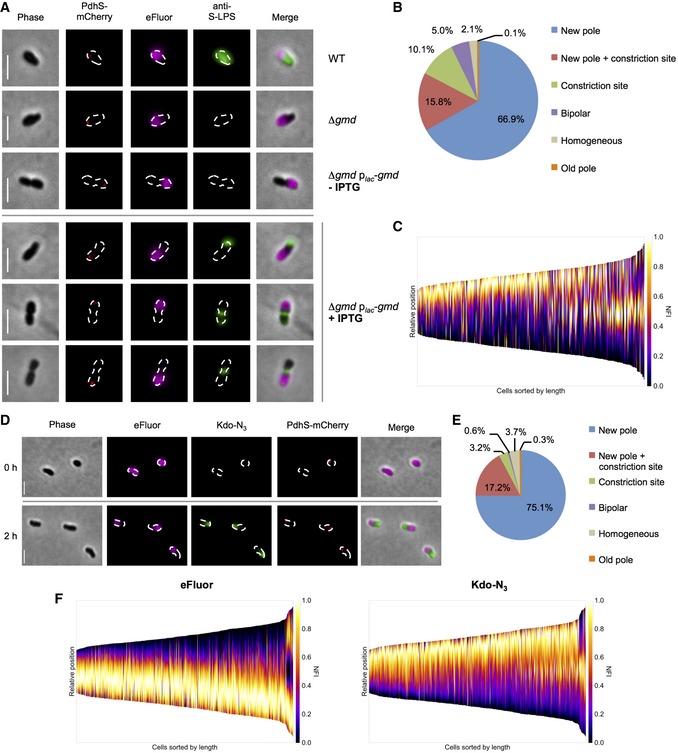
- Localization of S‐LPS (green) in the eFluor‐labeled (magenta) inducible rough strain Δgmd plac‐gmd possessing the old pole marker PdhS‐mCherry (red). The strains Δgmd and Δgmd plac‐gmd –IPTG were used as negative controls. Scale bars: 2 μm.
- Quantification of S‐LPS insertion from (A). Numbers are indicating mean percentages. n = 468 bacteria (three biological replicates).
- Demograph represents fluorescence profile of S‐LPS labeling from (A). Cells were oriented with the old pole at the bottom of the graph by PdhS‐mCherry and sorted by cell length. NFI: normalized fluorescence intensity. n = 468 bacteria (three biological replicates).
- Short pulse labeling of LPS (2 h) by Kdo‐N3 (green) on eFluor‐labeled (magenta) bacteria expressing the old pole marker PdhS‐mCherry (red). Scale bars: 2 μm.
- Quantification of LPS insertion sites from (D). Numbers are indicating mean percentages. n = 566 bacteria (three biological replicates).
- Demographs represent fluorescence intensities of eFluor (OM, left) and Kdo‐N3 (LPS, right) labeling. Cells were sorted by cell length and aligned with the old pole at the bottom of the graph by PdhS‐mCherry localization. NFI: normalized fluorescence intensity. n = 566 bacteria (three biological replicates).
In order to study the mobility of R‐LPS and S‐LPS on the bacterial surface without mAbs that could be suspected to cluster O‐chains together, we used a technique allowing the labeling of 3‐deoxy‐D‐manno‐octulosonic acid (Kdo), a sugar in the core of LPS, through click chemistry (Dumont et al, 2012; Fugier et al, 2015). A Kdo derivative carrying a N3 group at position C8 (Kdo‐N3) was added to the culture medium, taken up by the bacteria and incorporated in the biosynthesis of the LPS core of both S‐ and R‐LPS. The N3 groups can react with a fluorescent cyclooctyne derivative, allowing the localization of newly incorporated Kdo‐N3 on the bacterial surface (Dumont et al, 2012; Fugier et al, 2015). Bacteria were labeled with eFluor, grown for 2 h in the presence of Kdo‐N3, and then labeled by a strained alkyne (cyclooctyne) fused to a fluorophore (Fig 6D). The newly inserted LPS carrying Kdo‐N3 arose mostly from the new pole [75.1 ± 1.5% (mean ± SD), n = 566 bacteria], opposite to PdhS‐mCherry and eFluor labeling, and occasionally from the constriction site (Fig 6E and F). Interestingly, there was heterogeneity within the population regarding the area covered by the Kdo‐N3 fluorescence, corresponding to a high proportion of the cell surface for some bacteria. This could be due to the variation in the amount of incorporated LPS among single bacteria (consistent with different growth rates for individual bacteria inside the population), or to a low diffusion rate or confinement diameter allowing newly incorporated LPS to cover more surface in a fraction of the bacteria in comparison with absent diffusion. The detection of a zonal labeling by Kdo‐N3 showed that LPS does not display long‐range diffusion under the tested conditions.
A long pulse labeling with Kdo‐N3 confirmed this hypothesis. If bacteria were initially labeled with Kdo‐N3 and washed and growth was restarted in the absence of the dye, the newly inserted unlabeled LPS could be observed at the same growth sites, further supporting the main insertion of newly synthesized LPS at these sites (Fig EV4A and B). There were 17.7 ± 9.0% (mean ± SD, n = 924 bacteria), usually small in size that did not show an unlabeled area under these experimental conditions (Fig EV4B). This would be consistent with a low mobility of LPS in these cells. Nevertheless, the detection of unlabeled areas (Fig EV4A–C) showed the absence of LPS diffusion in a relative long period of time (2 h).
Figure EV4. Polar insertion of LPS.
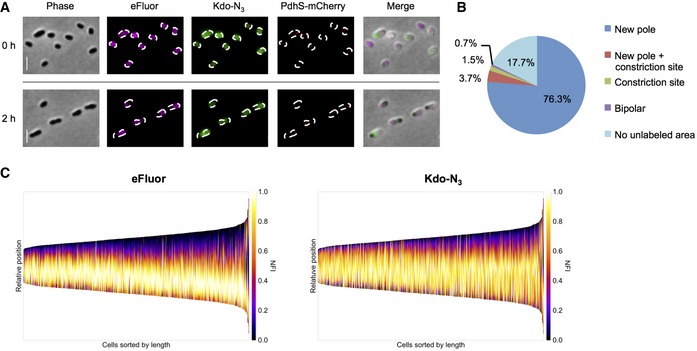
- Long pulse labeling of LPS with Kdo‐N3 (green) followed by labeling with eFluor (magenta) and grown in the absence of both labelings (2 h). Scale bars: 2 μm.
- Quantification of LPS insertion sites from (A). Numbers are indicating mean percentages. n = 924 bacteria (three biological replicates).
- Demographs are representing the fluorescence intensities of eFluor (OM, left) and Kdo‐N3 (LPS, right). Cells were sorted by cell length and aligned with the old pole at the bottom of the graphs by the PdhS‐mCherry labeled pole. NFI: normalized fluorescence intensity. n = 924 bacteria (three biological replicates).
In conclusion, by the induction of S‐LPS production in a rough strain as well as by the direct labeling of LPS, it could be shown that LPS is incorporated at the new pole and at the constriction site and that LPS seems to have a limited mobility.
Altogether, these data suggest that unipolar growth is not accompanied with a massive diffusion of the mother cell envelope into the daughter cell envelope. This low mobility of OM components could have important consequences for the generation of daughter cells with different surface components.
Efficient generation of daughter cells with a new surface component
Experiments described above show that the OM components such as Omp25, Omp2b, and LPS do not display long‐range diffusion. This is consistent with the TRSE (or eFluor) labeling patterns, since initial TRSE labeling does not diffuse on the cell surface (Brown et al, 2012). One interesting consequence of this very low diffusion is that, in principle, producing daughter cells completely covered with a new antigen on their surface would require fewer generations compared to a classical diffusion (Fig EV5). If the surface components diffuse very slowly, it is predictable that if a switch in gene expression occurs in a mother cell with unipolar growth, this could generate daughter cells completely covered with a new surface component at the second generation (Fig EV5). To obtain a proof of principle of this assumption, the S‐LPS inducible strain Δgmd plac‐gmd was used to control the synthesis of the O‐chain of S‐LPS. Cultures were induced with IPTG and the presence of S‐LPS and R‐LPS on the bacterial surface was analyzed by flow cytometry and fluorescence microscopy by labeling with the mAbs directed against S‐LPS and R‐LPS (Cloeckaert et al, 1993) (Fig 7). The non‐induced control strain is shown in Appendix Fig S6. After 3 h of induction, bacteria analyzed by flow cytometry still showed a rough phenotype, probably because bacteria did not have the time to produce and translocate a detectable amount of S‐LPS on the surface (Fig 7A). Then, after 6 h of induction, bacteria started to incorporate S‐LPS on their surface, as shown by the increase of the proportion of bacteria with a positive S‐LPS signal (Fig 7A). The majority of the population contained also S‐LPS as early as 9 h. After 24 h, most bacteria possessed a mix of S‐LPS and R‐LPS on their surfaces similar to the WT (Fig 1B). At 9 h post‐induction, the proportion of bacteria fully labeled with the S‐LPS mAb was 39.4 ± 4.3% (mean ± SD, n = 937 bacteria) and reached 54.9 ± 4.4% (mean ± SD), n = 1059 bacteria) after 24 h post‐induction (Fig 7B). It is thus remarkable that a 6‐h period (between 3 and 9 h of induction) was sufficient to generate about 40% of bacteria with a new surface antigen. This 6‐h period corresponds to < 3 generations since the doubling time of this strain was 2.8 ± 0.3 h (mean ± SD, n = 3 independent experiments) under this experimental set‐up.
Figure EV5. Comparison of lateral and unipolar growth models regarding a change in surface composition.
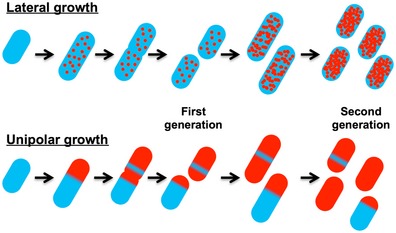
In the first cell, the production of a new surface antigen (in red) is initiated. In the lateral growth scenario, the daughter cells surfaces are a mix of old (blue) and new (red) antigens at the second generation. In the unipolar growth case, two daughter cells are entirely made of new antigen on their surfaces at the second generation. This hypothetical model involves only one initiation event in the first cell.
Figure 7. Induced generation of daughter cells with S‐LPS.
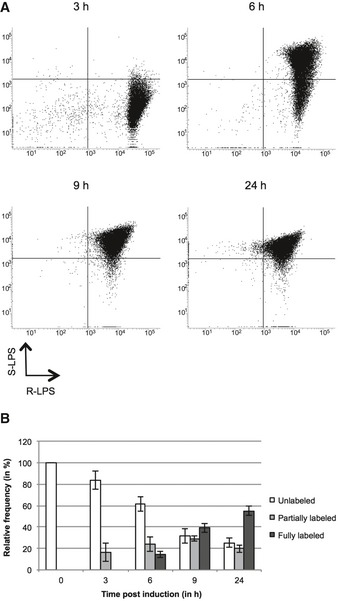
- Distribution of R‐LPS and S‐LPS in Δgmd plac‐gmd after 3, 6, 9, and 24 h post‐induction analyzed by flow cytometry (one representative example among three biological replicates, n = 20,000 events).
- Quantification of S‐LPS labeling from (A) as relative frequencies. Error bars correspond to SD from 3 independent experiments. n 0 h = 77 bacteria, n 3 h = 254 bacteria, n 6 h = 616 bacteria, n 9 h = 937 bacteria, n 24 h = 1,059 bacteria.
Discussion
The data reported here show that several components of the B. abortus OM are heterogeneously localized. This heterogeneity is maintained by the low mobility of individual components such as Omp2b, Omp25, and LPS over a period of time corresponding to a bacterial cell cycle (2–4 h). Additionally, the different layers of the envelope (OM and PG) are all inserted at the new pole and at the constriction site.
Initial LPS extractions of Brucella strains showed two distinct banding patterns in SDS–PAGE representing R‐LPS and S‐LPS (Dubray & Limet, 1987; Bowden et al, 1995; Zygmunt et al, 2012). Moreover, flow cytometry analysis already suggested positive signals for S‐LPS and R‐LPS in the smooth B. abortus 544 WT strain (Bowden et al, 1995), consistent with our estimate that a majority (~97%) of bacteria display a mix of S‐LPS and R‐LPS (Fig 1B). This co‐existence of R‐LPS and S‐LPS on single bacteria would be interesting to investigate in other bacteria. Our single cell analyses using fluorescence microscopy revealed a high heterogeneity between single cells with R‐LPS labeling ranging from absence to patchy and even full labeling (Figs 1A and EV1). Furthermore, in AFM analyses, the areas enriched in R‐LPS correlated with a high roughness (Ra) value (Fig 2), suggesting that irregular surface structures, already reported for E. coli (Amro et al, 2000; Gammoudi et al, 2016) and S. meliloti (Greif et al, 2010), correspond to mixes of long and short LPS molecules. To our knowledge, this is the first study making a correlation between the presence of R‐LPS clusters localized by fluorescence microscopy and the physical surface structure of the bacterial surface investigated by AFM.
Our data also show that R‐LPS clusters are co‐localizing with Omp2b (Fig 3A and C, Appendix Fig S3), an essential trimeric porin predicted to be involved in nutrient uptake (Douglas et al, 1984). The binding of LPS molecules to different OM porins was already reported for several other Gram‐negative bacteria, e.g., E. coli (Rocque et al, 1987; Strittmatter & Galanos, 1987; Buehler et al, 1991; de Cock & Tommassen, 1996), Salmonella (Strittmatter & Galanos, 1987; Latsch et al, 1992; Hagge et al, 2002) or Yersinia (Strittmatter & Galanos, 1987; Vakorina et al, 2003). This is well described for OmpF, a major porin of E. coli (Bolla et al, 1988; Holzenburg et al, 1989; Diedrich et al, 1990; Buehler et al, 1991; Sen & Nikaido, 1991; Arunmanee et al, 2014, 2016; Patel et al, 2016) belonging to the same family as Omp2b. One selective advantage of clustering R‐LPS and Omp2b could be to facilitate diffusion of compounds from the medium into the pores of the porin, as suggested by theoretical simulations using OmpF as a model (Patel et al, 2016). We were able to show that Omp2b seems to have a preference of co‐localizing with R‐LPS, whereas there was no distinction between the different endogenous LPS types in previous in vivo studies (Rocque et al, 1987; Strittmatter & Galanos, 1987; Bolla et al, 1988; Holzenburg et al, 1989; Diedrich et al, 1990; Buehler et al, 1991; Latsch et al, 1992). Interestingly, Omp2b clusters do not diffuse in newly inserted envelope (Fig 4D and E) suggesting that long‐range diffusion of Omp2b‐R‐LPS clusters does not occur on B. abortus cell surface in the conditions tested here.
Previously, it was shown that Rhizobiales, including B. abortus, display unipolar growth by pulse labeling bacteria with TRSE and subsequent chase without the dye (Brown et al, 2012). TRSE binds to accessible and reactive amines present on the cell surface, but up to now the insertion of a specific OM component had not been investigated. Our results indicate that the insertion of one of the major Omp of Brucella, namely Omp25 (Dubray & Bezard, 1980; Verstreate et al, 1982; Dubray & Charriaut, 1983), is taking place mostly at the new pole in exponential phase bacteria and at the constriction site in divisional bacteria (Fig 4A and B). We found the same insertion sites for PG (Fig 5A and C), as previously reported for A. tumefaciens (Kuru et al, 2012; Cameron et al, 2014).
Localized labeling of TRSE during single cell growth assays in Rhizobiales (Brown et al, 2012) is consistent with the absence of long‐range diffusion of OM components. Likewise, we could show that Omp25 and Omp2b were restricted in the TRSE‐positive area after a chase period (Fig 4E). This result is in agreement with the studied immobility or confinement of several Omps (see review Kleanthous et al, 2015). Additionally, Omp25 and Omp2b were suggested to be bound to PG (Dubray & Bezard, 1980; Verstreate et al, 1982; Dubray & Charriaut, 1983; Sowa et al, 1991; Cloeckaert et al, 1992b), which could explain their absence of mobility. However, the non‐mobility of E. coli OmpA is not mediated by its ability to bind PG (Verhoeven et al, 2013); thus, other mechanisms such as protein–protein interactions, as shown for BtuB‐OmpF in E. coli (Rassam et al, 2015), could contribute to the low diffusion of Omps. Detailed analysis of diffusion coefficient requiring sophisticated equipment is currently not accessible for class III pathogens but deep analysis of model bacteria like E. coli indicates that diffusion of OM proteins could be restricted in small patches (0.03–0.6 μm) (Kleanthous et al, 2015; Rassam et al, 2015). Confined diffusion could generate low apparent diffusion or absence of long‐range diffusion as reported here for Omp25 and Omp2b.
In addition to Omp25 and PG, LPS was also inserted at the proposed growth sites (Figs 6A and D, and EV4A) and exhibited a very low apparent diffusion (Figs 6C and F, and EV4C), especially compared to LPS lateral diffusion reported for Salmonella typhimurium (Schindler et al, 1980). However, the confinement area seems to be slightly larger for LPS compared to Omp25, since Kdo‐N3 labeling partially invades regions labeled with eFluor (Figs 6F and EV4C) suggesting that diffusion of LPS is less restricted than the one of Omp25 (Fig 4A). Contrary to E. coli LPS (Schneck et al, 2010), B. abortus LPS does not bind massive amounts of divalent cations (Moriyon & Berman, 1982) and the lipid A comprises very long acyl chains with two of them proposed to span the OM (Velasco et al, 2000). This could contribute to a deeper anchoring of LPS in the OM and therefore a reduced mobility. Moreover, the lower amount of phosphate groups present in Brucella LPS core could generate a lower charge repulsion between single molecules and thus a stronger interaction between them (Lapaque et al, 2005). Therefore, the constraints that limit diffusion of LPS on the bacterial surface need to be further explored. Since the insertion sites of LPS are located at the new pole and at the constriction site, it would be of great interest to localize the machinery involved, in particular LptD, a member of the LPS insertion machinery in the OM (Chng et al, 2010). However, as we proposed above for Omp25 and Omp2b, long‐range lateral diffusion of LPS is probably very limited in the OM. The mechanisms related to the interactions between the insertion of OM proteins and LPS incorporation remain to be investigated. The combination of unipolar growth and low mobility of OM components could have an advantage in the generation of daughter cells different from their mother in terms of surface composition (Figs 7 and EV5). This would be a selective advantage in processes like phase variation and antigenic variation (van der Woude & Bäumler, 2004), which are important for bacterial pathogens. The dissociation of smooth and rough Brucella was already reported several years ago (Henry, 1933; Stearns & Roepke, 1941; Braun, 1945, 1946), and first suggestions were made that this dissociation could also happen inside the host (Stearns & Roepke, 1941). Genetic events leading to this dissociation have been proposed (Mancilla et al, 2010; Turse et al, 2011) and dissociation from smooth to rough was described in vitro as well as in vivo (Turse et al, 2011), thus highlighting the importance of this behavior regarding virulence. Our data suggest that the production of daughter cells with a different surface antigen could be achieved in a few generations (typically 2), which would contrast with a model in which surface antigens are progressively diluted along many generations to allow bacteria to escape immune surveillance (Fig EV5). This could be of particular interest for chronic pathogens with a low proliferation potential inside their hosts.
Materials and Methods
Bacterial strains and media
Brucella abortus 544 NalR strain (referred to as WT in this study) and its derivatives were cultivated in 2YT‐rich medium (1% yeast extract, 1.6% peptone, 0.5% NaCl) at 37°C. Overnight liquid cultures were diluted 10 times to a low optical density (OD600 nm), grown all day long, and diluted again in the evening to start a second overnight culture that reached an OD600 nm between 0.3 and 0.5 the next day. If not indicated otherwise, all experiments were carried out with exponential phase cultures (OD600 nm ranging from 0.3 to 0.5). E. coli strains were cultivated in LB medium at 37°C. All strains and plasmids used in this study are listed in Appendix Tables S1 and S2.
Antibiotics were added, if necessary, at the following concentrations: kanamycin 20 or 50 μg/ml (kan R at a chromosomal site or provided on a plasmid, respectively); chloramphenicol 20 μg/ml; nalidixic acid 25 μg/ml. Brucella abortus Δgmd plac‐gmd was induced with a final concentration of 1 mM IPTG.
Construction of Brucella abortus mutant strains
Approximately 750 bp upstream and downstream of the coding sequence of interest were amplified from the purified genomic DNA of B. abortus 544 by PCR using Q5® High‐Fidelity DNA Polymerase (New England Biolabs). These two fragments were fused by means of a 20‐bp‐overlapping region by PCR. The resulting amplicons were purified from agarose gels and digested as the destination vector with the corresponding restriction enzymes and ligated overnight at 20°C. Ligation products were transformed in E. coli DH10B, and clones were screened by PCR. Selected plasmids were checked by sequencing and transformed in E. coli S17‐1 strain to allow conjugation to B. abortus 544 NalR strain. Deletion mutants were constructed by allelic exchange via homologous recombination and checked by PCR with primers hybridizing upstream and downstream from the regions involved in recombination. The gmd coding sequence is localized in an operon containing genes involved in the synthesis of the O‐chain of B. abortus (Godfroid et al, 2000). In order to avoid polar effects by the deletion of gmd, 9 bp from the end of the ORF including a ribosome‐binding site remained in the genome after allelic exchange. Additionally, 15 bp downstream from the start codon was also deleted. Brucella abortus 544 Δgmd was complemented with the plasmid pBBRI_gmd (plac‐gmd), which contains gmd under the control of the E. coli lac promoter, the E. coli lacI gene, and allowed a controlled induction with IPTG. The pBBRI plasmid contains a pBBRMCS1 backbone (Kovach et al, 1994) and a regulation cassette originating from pSRK‐Kan (Khan et al, 2008). It was previously validated for ctrA inducible expression in B. abortus (Francis et al, 2017). The reported plasmid contained two plac and was thus modified as follows. In order to remove the plac that is not used for induction, the plasmid was restricted with KpnI and SphI and the generated sticky ends were transformed to blunt‐ends by T4 DNA Polymerase. The resulting plasmid was ligated, checked by sequencing, and further named pBBRI. If needed, the old pole marker PdhS‐mCherry provided on pSK‐Kan plasmid (kan R) (Van der Henst et al, 2010) was integrated in the genome via homologous recombination. Primers used in this study are listed in Appendix Table S3.
TRSE and eFluor labeling
Bacteria were washed (4,600 g, 2.5 min) twice with phosphate‐buffered saline (PBS) and resuspended in Texas Red™‐X Succinimidyl Ester (TRSE, Invitrogen) or eBioscience™ Cell Proliferation Dye eFluor™ 670 (eFluor, Invitrogen) at a final concentration of 1 μg/ml in PBS. After 15 min of incubation at room temperature (RT) protected from light, bacteria were washed twice and resuspended either in 2YT culture medium or PBS depending on further experiment. Samples were further handled protected from light. For both labelings, a fraction of non‐growing bacteria was observed at low frequency, 1.7% (4/242 bacteria) after TRSE treatment, and 3.5% (9/258 bacteria) after eFluor incubation.
Fluorescence microscopy
Images were acquired on 1% agarose PBS pads with a Nikon Eclipse 80i fluorescence microscope equipped with a phase‐contrast objective Plan Apo λ 100×/1.45 NA and a Hamamatsu camera ORCA‐ER. Images were processed with NIS imaging software Elements AR (version 5.02) and further analyzed as described in the “Image analysis” section (see below). For combination of fluorescence microscopy and AFM, bacteria were imaged with an inverted fluorescence microscope Zeiss Axio Observer Z1 equipped with an EC Plan‐Neofluar 100×/1.30 NA objective and a Hamamatsu camera C10600. Fluorescence images were processed with Zen imaging software 2012 (version 1.1.2.0), and AFM images were treated with JPK software (version 6.1.49).
IF
Different OM structures (S‐LPS, R‐LPS, and Omp25 and Omp2b) were localized by IF using specific mAbs (Appendix Table S4). Labeling was carried out like previously reported (Francis et al, 2017) with minor changes. Briefly, exponential phase bacteria were washed twice with PBS at 4,600 g for 2.5 min and resuspended in the same amount of supernatant from hybridoma culture containing the appropriate mAb. After incubation for 40 min at RT on a rotating wheel, bacteria were washed twice with PBS at 1,500 g for 2.5 min at 4°C. Pellet was resuspended in PBS containing the corresponding secondary antibody (Ab) (Appendix Table S5) diluted 1:500 and incubated for 40 min at RT on a rotating wheel. Bacteria were washed and resuspended either in 2YT medium for subsequent growth or in PBS for fluorescence microscopy. Labeling with secondary fluorescent Ab only was used as a negative control.
Co‐localization by IF
For co‐localization studies of R‐LPS and S‐LPS, R‐LPS was initially labeled with the mAb, followed by S‐LPS (Appendix Table S4) as described above. For co‐localization of Omp2b and R‐LPS, labeling with primary mAb was done sequentially (first Omp2b, then R‐LPS), whereas both secondary fluorescent antibodies were incubated simultaneously. These secondary antibodies were isotype‐specific for the primary mAb (Appendix Table S5). As a negative control, secondary antibodies with the inappropriate isotype were used to show specificity of the labeling.
Insertion of new OM components by IF
To monitor new insertion of Omp25 and Omp2b, bacteria were labeled with TRSE (see TRSE labeling) and afterward with a primary mAb against the structure of interest (Appendix Table S4). After washing, bacterial pellet was resuspended in prewarmed 2YT and diluted for further growth. After 2 h of growth, bacteria were labeled with secondary Ab (Appendix Table S5) and observed by fluorescence microscopy.
Induction of S‐LPS
For the inducible strain B. abortus 544 Δgmd plac‐gmd, bacteria were labeled with eFluor (see TRSE labeling) and resuspended in prewarmed 2YT containing IPTG or not (for negative non‐induced control sample). Brucella abortus 544 Δgmd containing the empty vector pBBRI was used as negative control. Cultures were induced for 4 h at 37°C with shaking, washed, and then labeled by IF (see IF). Labeling was observed by fluorescence microscopy. Strains were cultivated without chloramphenicol to reduce inhibition of growth. The presence of the plasmid (pBBRI and pBBRI_gmd) was checked after 4 h induction by plating on 2YT plates with or without chloramphenicol and counting of colony‐forming units (CFU).
For the study of the induced generation of daughter cells with S‐LPS, bacterial culture of Δgmd plac‐gmd in early exponential phase (OD600 nm around 0.1) was washed twice with PBS (4,600 g, 2.5 min) and culture was split in two parts to cultivate in induced (with IPTG) or non‐induced (without IPTG) conditions. OD600 nm was measured at time points 0, 3, 6, 9 and 24 h and samples were fixed with 2% PFA. Fixed samples were labeled by IF (see above) with mAb against R‐LPS and S‐LPS (Appendix Tables S4 and S5) and analyzed by fluorescence microscopy and flow cytometry (see above).
LPS labeling
Labeling of LPS was carried out by Kdo‐N3 (Dumont et al, 2012). For short pulse labeling, exponential phase bacteria were washed twice in PBS (4,600 g, 2.5 min), labeled with eFluor, washed, and resuspended in prewarmed 2YT containing 1 mM Kdo‐N3. After 2 h of growth at 37°C shaking, 50 μl was washed twice with PBS (4,600 g, 2.5 min) and labeled for 1 h with 0.1 mM DBCO‐PEG4‐5/6 carboxyrhodamine 110 (Jena Bioscience) diluted in PBS protected from light on a rotating wheel (Fugier et al, 2015). Samples were washed and investigated by fluorescence microscopy. For long pulse labeling, bacterial culture was diluted to OD600 nm = 0.05 in 300 μl 2YT 1 mM Kdo‐N3 and grown overnight. The cultures were washed, labeled with eFluor, and resuspended in 1.25 ml of prewarmed 2YT. After 2 h of growth, bacteria were labeled as described above and analyzed by fluorescence microscopy. As negative controls, bacteria grown in the absence of Kdo‐N3 were labeled with DBCO‐PEG4‐5/6 carboxyrhodamine 110 resulting in missing fluorescence signal.
PG labeling
Exponential phase bacteria were short pulse labeled for 5 min with HADA (Kuru et al, 2012) at a final concentration of 500 μM in 2YT medium. Samples were treated protected from light. Cells were washed once with PBS (4,600 g, 2.5 min) and fixed with ethanol. Therefore, pellet was resuspended in 70% cold ethanol and incubated for 15 min on ice. Bacteria were washed twice with PBS and observed by fluorescence microscopy.
AFM
Exponential phase bacteria were washed twice with PBS (4,600 g, 2.5 min), fixed with 2% final concentration of paraformaldehyde (PFA) for 20 min at RT, and washed twice with PBS. If necessary, samples were labeled by IF as described above. For the roughness measurements, WT and Δgmd were labeled with the mAb directed against Brucella R‐LPS (Appendix Table S4) and a secondary fluorescent Ab (Appendix Table S5). Bacterial concentrations were adjusted to 108 bacteria/ml and samples were stored at 4°C in PBS protected from light for maximum of 3 days. In order to prepare the sample, polyethylenimine (PEI)‐coated thin glass slides were used to immobilize the cells, as described previously (Francius et al, 2008). Multiparametric images of bacteria were recorded in PBS using the quantitative imaging mode available on the NanoWizard III AFM (JPK Instruments, Germany).
Images were obtained using either oxide‐sharpened microfabricated Si3Ni4 cantilevers (MSCT; Bruker) or gold cantilevers (OMCL‐TR4; Olympus, Tokyo, Japan) functionalized with mAb directed against R‐LPS using protein G, as described previously (Casalini et al, 2015). Cells were first imaged in their entirety, at 128 pixels × 128 pixels, with an applied force kept at 0.25 nN, and a constant approach/retract speed of 20 μm/s (z range of 500 nm). Zooms of 0.4 × 0.4 μm² were then recorded on two areas of each bacterium. The cantilevers spring constants were determined by the thermal noise method prior to the measurements (Hutter & Bechhoefer, 1993).
The arithmetic average roughness Ra was measured on height images after order‐3 flattening, and Padh was determined on the adhesion images as the number of pixels with adhesion values higher than 30 pN, a threshold determined empirically to eliminate noise and unspecific interactions.
For each condition, experiments were repeated for at least 3 independent cell preparations (culture/IF).
Image analysis
Fluorescence images were analyzed with MicrobeJ (Ducret et al, 2016), a plug‐in of ImageJ software (Schneider et al, 2012). Unless otherwise stated, only isolated bacteria were analyzed and disrupted bacteria as well as cell aggregates were excluded from the analysis. For strains containing the old pole marker PdhS‐mCherry, only bacteria possessing a unique polar PdhS signal were used to construct a demographic representation. For S‐LPS induction in B. abortus 544 Δgmd plac‐gmd, bacteria were manually selected if necessary in smaller cell aggregates. For insertion of new Omp25, Omp2b and LPS labeling by Kdo‐N3, only bacteria positive for both fluorescent labelings (TRSE/Omp25, TRSE/Omp2b, and eFluor/Kdo‐N3) were analyzed. For the analysis of co‐localization of Omp2b or Omp25 with TRSE, fluorescence intensities per pixel generated by MicrobeJ were used. Frequency analysis of fluorescence intensity per pixel allowed the definition of cutoffs to discriminate positive signal from background for each independent sample. These cutoffs range from 1,000 to 1,200 on a scale from 0 to 4,000 (saturation) of fluorescence intensity for Omp25 labeling, 600 for Texas Red and 800 for Omp2b labeling. The proportions of Omp2b (three samples with 17,236, 19,262, and 38,132 pixels)‐ or Omp25 (five samples with 10,292, 15,358, 17,672, 19,073 and 23,271 pixels)‐positive signals in TRSE‐positive and TRSE‐negative areas were compared using a t‐test. The co‐localization analysis of Omp2b with R‐LPS signals was also performed by the discrimination between positive and negative signals based on fluorescence intensity per pixel (100,382 pixels were considered), and then a chi‐square test was applied with the null hypothesis that co‐localization was a product of the proportion of positive signal for each labeling. Several cutoffs were considered and all yielded P‐values < 10−40.
Flow cytometry
Late exponential phase bacteria (OD600 nm ≈ 0.6) were washed twice with PBS, fixed with 2% PFA for 20 min at RT, washed again, and labeled with mAb directed against S‐LPS and R‐LPS by IF (see above). Secondary antibodies (Appendix Table S5) were isotype‐specific for primary antibodies. Analysis was carried with FACSVerse™ (BD). 20,000 events were recorded per sample. The further analyzed population was defined by measuring SSC and FSC values, which allowed exclusion of small particles as well as taller aggregates. Fluorescence intensities corresponding to secondary Ab binding were recorded and presented in dot plots. The gate for each individual experiment was chosen according to the negative control, where bacteria were only labeled with secondary fluorescent antibodies.
Statistics
Pixel analysis of co‐localization of Omp2b with R‐LPS generated comparisons of frequencies that were tested with a chi‐square test based on the null hypothesis of independent localization probability. Comparisons of two samples were performed with one‐tailed statistical tests, either t‐test for a symmetric distribution, or Mann–Whitney U‐test if distribution is asymmetric. With more than two samples, pairwise comparison of samples was made with Tukey test. Sample sizes and P‐values are indicated in figure legends or in the main text.
Author contributions
VV performed all experiments except AFM experiments, which were performed by CV, CF, and CF‐D; VV and XDB designed the study and CV, CF, CF‐D, and YFD designed the AFM experiments; VV and XDB wrote the manuscript; CV and CF wrote the manuscript concerning AFM experiments; all authors read and approved the final manuscript.
Conflict of interest
The authors declare that they have no conflict of interest.
Supporting information
Appendix
Expanded View Figures PDF
Review Process File
Acknowledgements
We thank Ignacio Moriyón, Raquel Conde Álvarez, Francesco Renzi, Jean‐Yves Matroule, and Jean‐François Collet for stimulating and helpful discussion. We thank Stéphane Vincent and his team for the synthesis of HADA and Boris Vauzeilles for providing Kdo‐N3. We thank Kévin Willemart for the technical assistance in flow cytometry and Beatriz Izquierdo Lafuente for providing the B. abortus ∆omp25 strain. This research has been funded by grants from Fonds de la Recherche Scientifique‐Fonds National de la Recherche Scientifique (FRS‐FNRS, http://www.fnrs.be) (PDR T.0053.13 and PDR Brucell‐cycle T.0060.15, and CDR J.0091.14) to X. De Bolle. The work was also funded by a grant from Concerted Research Actions (17/22‐087) of the Fédération Wallonie‐Bruxelles, to J.‐F. Collet, P. Soumillion and X. De Bolle. We thank UNamur (https://www.unamur.be/) for financial and logistic support. V. Vassen is supported by a Ph.D. grant from FRIA (FRS‐FNRS). Work at the Université Catholique de Louvain was supported by the European Research Council (ERC) under the European Union's Horizon 2020 research and innovation program (grant agreement 693630), the FRS‐FNRS, the FNRS‐WELBIO (grant WELBIO‐CR‐2015A‐05), and the Research Department of the Communauté Française de Belgique (Concerted Research Action). Y.F. Dufrêne is a Research Director at FNRS.
The EMBO Journal (2019) 38: e100323
References
- Amro NA, Kotra LP, Wadu‐Mesthrige K, Bulychev A, Mobashery S, G‐y L (2000) High‐resolution atomic force microscopy studies of the Escherichia coli outer membrane: structural basis for permeability. Langmuir 16: 2789–2796 [Google Scholar]
- Arunmanee W, Harris JR, Lakey JH (2014) Outer membrane protein F stabilised with minimal amphipol forms linear arrays and LPS‐dependent 2D crystals. J Membr Biol 247: 949–956 [DOI] [PMC free article] [PubMed] [Google Scholar]
- Arunmanee W, Pathania M, Solovyova AS, Le Brun AP, Ridley H, Basle A, van den Berg B, Lakey JH (2016) Gram‐negative trimeric porins have specific LPS binding sites that are essential for porin biogenesis. Proc Natl Acad Sci USA 113: E5034–E5043 [DOI] [PMC free article] [PubMed] [Google Scholar]
- Beveridge TJ (1999) Structures of gram‐negative cell walls and their derived membrane vesicles. J Bacteriol 181: 4725–4733 [DOI] [PMC free article] [PubMed] [Google Scholar]
- Bolla JM, Lazdunski C, Pages JM (1988) The assembly of the major outer membrane protein OmpF of Escherichia coli depends on lipid synthesis. EMBO J 7: 3595–3599 [DOI] [PMC free article] [PubMed] [Google Scholar]
- Bowden RA, Cloeckaert A, Zygmunt MS, Bernard S, Dubray G (1995) Surface exposure of outer membrane protein and lipopolysaccharide epitopes in Brucella species studied by enzyme‐linked immunosorbent assay and flow cytometry. Infect Immun 63: 3945–3952 [DOI] [PMC free article] [PubMed] [Google Scholar]
- Braun W (1945) Factors controlling bacterial dissociation. Science 101: 182–183 [DOI] [PubMed] [Google Scholar]
- Braun W (1946) Dissociation in Brucella abortus: a demonstration of the role of inherent and environmental factors in bacterial variation. J Bacteriol 51: 327–349 [DOI] [PubMed] [Google Scholar]
- Brown PJ, de Pedro MA, Kysela DT, Van der Henst C, Kim J, De Bolle X, Fuqua C, Brun YV (2012) Polar growth in the alphaproteobacterial order rhizobiales. Proc Natl Acad Sci USA 109: 1697–1701 [DOI] [PMC free article] [PubMed] [Google Scholar]
- Buehler LK, Kusumoto S, Zhang H, Rosenbusch JP (1991) Plasticity of Escherichia coli porin channels. Dependence of their conductance on strain and lipid environment. J Biol Chem 266: 24446–24450 [PubMed] [Google Scholar]
- Burman LG, Raichler J, Park JT (1983) Evidence for diffuse growth of the cylindrical portion of the Escherichia coli murein sacculus. J Bacteriol 155: 983–988 [DOI] [PMC free article] [PubMed] [Google Scholar]
- Cameron TA, Anderson‐Furgeson J, Zupan JR, Zik JJ, Zambryski PC (2014) Peptidoglycan synthesis machinery in Agrobacterium tumefaciens during unipolar growth and cell division. MBio 5: e01219‐14 [DOI] [PMC free article] [PubMed] [Google Scholar]
- Cardoso PG, Macedo GC, Azevedo V, Oliveira SC (2006) Brucella spp noncanonical LPS: structure, biosynthesis, and interaction with host immune system. Microb Cell Fact 5: 13 [DOI] [PMC free article] [PubMed] [Google Scholar]
- Casalini S, Dumitru AC, Leonardi F, Bortolotti CA, Herruzo ET, Campana A, de Oliveira RF, Cramer T, Garcia R, Biscarini F (2015) Multiscale sensing of antibody‐antigen interactions by organic transistors and single‐molecule force spectroscopy. ACS Nano 9: 5051–5062 [DOI] [PubMed] [Google Scholar]
- Chng SS, Ruiz N, Chimalakonda G, Silhavy TJ, Kahne D (2010) Characterization of the two‐protein complex in Escherichia coli responsible for lipopolysaccharide assembly at the outer membrane. Proc Natl Acad Sci USA 107: 5363–5368 [DOI] [PMC free article] [PubMed] [Google Scholar]
- Chopinet L, Formosa C, Rols MP, Duval RE, Dague E (2013) Imaging living cells surface and quantifying its properties at high resolution using AFM in QI mode. Micron 48: 26–33 [DOI] [PubMed] [Google Scholar]
- Cloeckaert A, de Wergifosse P, Dubray G, Limet JN (1990) Identification of seven surface‐exposed Brucella outer membrane proteins by use of monoclonal antibodies: immunogold labeling for electron microscopy and enzyme‐linked immunosorbent assay. Infect Immun 58: 3980–3987 [DOI] [PMC free article] [PubMed] [Google Scholar]
- Cloeckaert A, Jacques I, de Wergifosse P, Dubray G, Limet JN (1992a) Protection against Brucella melitensis or Brucella abortus in mice with immunoglobulin G (IgG), IgA, and IgM monoclonal antibodies specific for a common epitope shared by the Brucella A and M smooth lipopolysaccharides. Infect Immun 60: 312–315 [DOI] [PMC free article] [PubMed] [Google Scholar]
- Cloeckaert A, Zygmunt MS, de Wergifosse P, Dubray G, Limet JN (1992b) Demonstration of peptidoglycan‐associated Brucella outer‐membrane proteins by use of monoclonal antibodies. J Gen Microbiol 138: 1543–1550 [DOI] [PubMed] [Google Scholar]
- Cloeckaert A, Jacques I, Bowden RA, Dubray G, Limet JN (1993) Monoclonal antibodies to Brucella rough lipopolysaccharide: characterization and evaluation of their protective effect against B. abortus . Res Microbiol 144: 475–484 [DOI] [PubMed] [Google Scholar]
- de Cock H, Tommassen J (1996) Lipopolysaccharides and divalent cations are involved in the formation of an assembly‐competent intermediate of outer‐membrane protein PhoE of E. coli . EMBO J 15: 5567–5573 [PMC free article] [PubMed] [Google Scholar]
- Conde‐Alvarez R, Arce‐Gorvel V, Iriarte M, Mancek‐Keber M, Barquero‐Calvo E, Palacios‐Chaves L, Chacon‐Diaz C, Chaves‐Olarte E, Martirosyan A, von Bargen K, Grillo MJ, Jerala R, Brandenburg K, Llobet E, Bengoechea JA, Moreno E, Moriyon I, Gorvel JP (2012) The lipopolysaccharide core of Brucella abortus acts as a shield against innate immunity recognition. PLoS Pathog 8: e1002675 [DOI] [PMC free article] [PubMed] [Google Scholar]
- Diedrich DL, Stein MA, Schnaitman CA (1990) Associations of Escherichia coli K‐12 OmpF trimers with rough and smooth lipopolysaccharides. J Bacteriol 172: 5307–5311 [DOI] [PMC free article] [PubMed] [Google Scholar]
- Douglas JT, Rosenberg EY, Nikaido H, Verstreate DR, Winter AJ (1984) Porins of Brucella species. Infect Immun 44: 16–21 [DOI] [PMC free article] [PubMed] [Google Scholar]
- Dubray G, Bezard G (1980) Isolation of three Brucella abortus cell‐wall antigens protective in murine experimental brucellosis. Ann Rech Vet 11: 367–373 [PubMed] [Google Scholar]
- Dubray G, Charriaut C (1983) Evidence of three major polypeptide species and two major polysaccharide species in the Brucella outer membrane. Ann Rech Vet 14: 311–318 [PubMed] [Google Scholar]
- Dubray G, Limet J (1987) Evidence of heterogeneity of lipopolysaccharides among Brucella biovars in relation to A and M specificities. Ann Inst Pasteur Microbiol 138: 27–37 [DOI] [PubMed] [Google Scholar]
- Ducret A, Quardokus EM, Brun YV (2016) MicrobeJ, a tool for high throughput bacterial cell detection and quantitative analysis. Nat Microbiol 1: 16077 [DOI] [PMC free article] [PubMed] [Google Scholar]
- Dumont A, Malleron A, Awwad M, Dukan S, Vauzeilles B (2012) Click‐mediated labeling of bacterial membranes through metabolic modification of the lipopolysaccharide inner core. Angew Chem Int Ed Engl 51: 3143–3146 [DOI] [PubMed] [Google Scholar]
- Formosa C, Grare M, Jauvert E, Coutable A, Regnouf‐de‐Vains JB, Mourer M, Duval RE, Dague E (2012) Nanoscale analysis of the effects of antibiotics and CX1 on a Pseudomonas aeruginosa multidrug‐resistant strain. Sci Rep 2: 575 [DOI] [PMC free article] [PubMed] [Google Scholar]
- Francis N, Poncin K, Fioravanti A, Vassen V, Willemart K, Ong TA, Rappez L, Letesson JJ, Biondi EG, De Bolle X (2017) CtrA controls cell division and outer membrane composition of the pathogen Brucella abortus . Mol Microbiol 103: 780–797 [DOI] [PubMed] [Google Scholar]
- Francius G, Tesson B, Dague E, Martin‐Jezequel V, Dufrene YF (2008) Nanostructure and nanomechanics of live Phaeodactylum tricornutum morphotypes. Environ Microbiol 10: 1344–1356 [DOI] [PubMed] [Google Scholar]
- Fugier E, Dumont A, Malleron A, Poquet E, Mas Pons J, Baron A, Vauzeilles B, Dukan S (2015) Rapid and specific enrichment of culturable gram negative bacteria using non‐lethal copper‐free click chemistry coupled with magnetic beads separation. PLoS ONE 10: e0127700 [DOI] [PMC free article] [PubMed] [Google Scholar]
- Gammoudi I, Mathelie‐Guinlet M, Morote F, Beven L, Moynet D, Grauby‐Heywang C, Cohen‐Bouhacina T (2016) Morphological and nanostructural surface changes in Escherichia coli over time, monitored by atomic force microscopy. Colloids Surf B Biointerfaces 141: 355–364 [DOI] [PubMed] [Google Scholar]
- Gil‐Ramirez Y, Conde‐Alvarez R, Palacios‐Chaves L, Zuniga‐Ripa A, Grillo MJ, Arce‐Gorvel V, Hanniffy S, Moriyon I, Iriarte M (2014) The identification of wadB, a new glycosyltransferase gene, confirms the branched structure and the role in virulence of the lipopolysaccharide core of Brucella abortus . Microb Pathog 73: 53–59 [DOI] [PubMed] [Google Scholar]
- Godfroid F, Cloeckaert A, Taminiau B, Danese I, Tibor A, de Bolle X, Mertens P, Letesson JJ (2000) Genetic organisation of the lipopolysaccharide O‐antigen biosynthesis region of Brucella melitensis 16M (wbk). Res Microbiol 151: 655–668 [DOI] [PubMed] [Google Scholar]
- Greif D, Wesner D, Regtmeier J, Anselmetti D (2010) High resolution imaging of surface patterns of single bacterial cells. Ultramicroscopy 110: 1290–1296 [DOI] [PubMed] [Google Scholar]
- Hagge SO, de Cock H, Gutsmann T, Beckers F, Seydel U, Wiese A (2002) Pore formation and function of phosphoporin PhoE of Escherichia coli are determined by the core sugar moiety of lipopolysaccharide. J Biol Chem 277: 34247–34253 [DOI] [PubMed] [Google Scholar]
- Hallez R, Mignolet J, Van Mullem V, Wery M, Vandenhaute J, Letesson JJ, Jacobs‐Wagner C, De Bolle X (2007) The asymmetric distribution of the essential histidine kinase PdhS indicates a differentiation event in Brucella abortus . EMBO J 26: 1444–1455 [DOI] [PMC free article] [PubMed] [Google Scholar]
- Henry BS (1933) Dissociation in the genus Brucella . J Infect Dis 52: 374–402 [Google Scholar]
- Holzenburg A, Engel A, Kessler R, Manz HJ, Lustig A, Aebi U (1989) Rapid isolation of OmpF porin‐LPS complexes suitable for structure‐function studies. Biochemistry 28: 4187–4193 [DOI] [PubMed] [Google Scholar]
- Hutter JL, Bechhoefer J (1993) Calibration of atomic‐force microscope tips. Rev Sci Instrum 64: 1868–1873 [Google Scholar]
- Khan SR, Gaines J, Roop RM II, Farrand SK (2008) Broad‐host‐range expression vectors with tightly regulated promoters and their use to examine the influence of TraR and TraM expression on Ti plasmid quorum sensing. Appl Environ Microbiol 74: 5053–5062 [DOI] [PMC free article] [PubMed] [Google Scholar]
- Kleanthous C, Rassam P, Baumann CG (2015) Protein‐protein interactions and the spatiotemporal dynamics of bacterial outer membrane proteins. Curr Opin Struct Biol 35: 109–115 [DOI] [PMC free article] [PubMed] [Google Scholar]
- Kovach ME, Phillips RW, Elzer PH, Roop RM II, Peterson KM (1994) pBBR1MCS: a broad‐host‐range cloning vector. Biotechniques 16: 800–802 [PubMed] [Google Scholar]
- Kuru E, Hughes HV, Brown PJ, Hall E, Tekkam S, Cava F, de Pedro MA, Brun YV, VanNieuwenhze MS (2012) In situ probing of newly synthesized peptidoglycan in live bacteria with fluorescent D‐amino acids. Angew Chem Int Ed Engl 51: 12519–12523 [DOI] [PMC free article] [PubMed] [Google Scholar]
- Lapaque N, Moriyon I, Moreno E, Gorvel JP (2005) Brucella lipopolysaccharide acts as a virulence factor. Curr Opin Microbiol 8: 60–66 [DOI] [PubMed] [Google Scholar]
- Latsch M, Stemmer F, Loos M (1992) Purification and characterization of LPS‐free porins isolated from Salmonella minnesota . FEMS Microbiol Lett 69: 275–281 [DOI] [PubMed] [Google Scholar]
- Mancilla M, Lopez‐Goni I, Moriyon I, Zarraga AM (2010) Genomic island 2 is an unstable genetic element contributing to Brucella lipopolysaccharide spontaneous smooth‐to‐rough dissociation. J Bacteriol 192: 6346–6351 [DOI] [PMC free article] [PubMed] [Google Scholar]
- Mobasheri H, Ficht TA, Marquis H, Lea EJ, Lakey JH (1997) Brucella Omp2a and Omp2b porins: single channel measurements and topology prediction. FEMS Microbiol Lett 155: 23–30 [DOI] [PubMed] [Google Scholar]
- Moreno E, Moriyón I (2006) The genus Brucella In The prokaryotes: volume 5: proteobacteria: alpha and beta subclasses, Dworkin M, Falkow S, Rosenberg E, Schleifer K‐H, Stackebrandt E. (eds), pp 315–456. New York, NY: Springer New York; [Google Scholar]
- Moriyon I, Berman DT (1982) Effects of nonionic, ionic, and dipolar ionic detergents and EDTA on the Brucella cell envelope. J Bacteriol 152: 822–828 [DOI] [PMC free article] [PubMed] [Google Scholar]
- Nikaido H, Vaara M (1985) Molecular basis of bacterial outer membrane permeability. Microbiol Rev 49: 1–32 [DOI] [PMC free article] [PubMed] [Google Scholar]
- Paquet JY, Diaz MA, Genevrois S, Grayon M, Verger JM, de Bolle X, Lakey JH, Letesson JJ, Cloeckaert A (2001) Molecular, antigenic, and functional analyses of Omp2b porin size variants of Brucella spp. J Bacteriol 183: 4839–4847 [DOI] [PMC free article] [PubMed] [Google Scholar]
- Patel DS, Re S, Wu EL, Qi Y, Klebba PE, Widmalm G, Yeom MS, Sugita Y, Im W (2016) Dynamics and interactions of OmpF and LPS: influence on pore accessibility and ion permeability. Biophys J 110: 930–938 [DOI] [PMC free article] [PubMed] [Google Scholar]
- de Pedro MA, Quintela JC, Holtje JV, Schwarz H (1997) Murein segregation in Escherichia coli . J Bacteriol 179: 2823–2834 [DOI] [PMC free article] [PubMed] [Google Scholar]
- Rassam P, Copeland NA, Birkholz O, Toth C, Chavent M, Duncan AL, Cross SJ, Housden NG, Kaminska R, Seger U, Quinn DM, Garrod TJ, Sansom MS, Piehler J, Baumann CG, Kleanthous C (2015) Supramolecular assemblies underpin turnover of outer membrane proteins in bacteria. Nature 523: 333–336 [DOI] [PMC free article] [PubMed] [Google Scholar]
- Rocque WJ, Coughlin RT, McGroarty EJ (1987) Lipopolysaccharide tightly bound to porin monomers and trimers from Escherichia coli K‐12. J Bacteriol 169: 4003–4010 [DOI] [PMC free article] [PubMed] [Google Scholar]
- Schindler M, Osborn MJ, Koppel DE (1980) Lateral diffusion of lipopolysaccharide in the outer membrane of Salmonella typhimurium . Nature 285: 261–263 [DOI] [PubMed] [Google Scholar]
- Schneck E, Schubert T, Konovalov OV, Quinn BE, Gutsmann T, Brandenburg K, Oliveira RG, Pink DA, Tanaka M (2010) Quantitative determination of ion distributions in bacterial lipopolysaccharide membranes by grazing‐incidence X‐ray fluorescence. Proc Natl Acad Sci USA 107: 9147–9151 [DOI] [PMC free article] [PubMed] [Google Scholar]
- Schneider CA, Rasband WS, Eliceiri KW (2012) NIH image to ImageJ: 25 years of image analysis. Nat Methods 9: 671–675 [DOI] [PMC free article] [PubMed] [Google Scholar]
- Sen K, Nikaido H (1991) Lipopolysaccharide structure required for in vitro trimerization of Escherichia coli OmpF porin. J Bacteriol 173: 926–928 [DOI] [PMC free article] [PubMed] [Google Scholar]
- Sowa BA, Kelly KA, Ficht TA, Frey M, Adams LG (1991) SDS‐soluble and peptidoglycan‐bound proteins in the outer membrane‐peptidoglycan complex of Brucella abortus . Vet Microbiol 27: 351–369 [DOI] [PubMed] [Google Scholar]
- Stearns TW, Roepke MH (1941) The effect of dissociation on the electrophoretic mobility of Brucella . J Bacteriol 42: 745–755 [DOI] [PMC free article] [PubMed] [Google Scholar]
- Strittmatter W, Galanos C (1987) Characterisation of protein co‐extracted together with LPS in Escherichia coli, Salmonella minnesota and Yersinia enterocolitica . Microb Pathog 2: 29–36 [DOI] [PubMed] [Google Scholar]
- Turse JE, Pei J, Ficht TA (2011) Lipopolysaccharide‐deficient Brucella variants arise spontaneously during infection. Front Microbiol 2: 54 [DOI] [PMC free article] [PubMed] [Google Scholar]
- Vakorina TI, Novikova OD, Krasikova IN, Naberezhnykh GN, Solov'eva TF, Ovodov YS (2003) Interaction of porin from Yersinia pseudotuberculosis with different structural forms of endogenous lipopolysaccharide. Biochemistry 68: 976–983 [DOI] [PubMed] [Google Scholar]
- Van der Henst C, Charlier C, Deghelt M, Wouters J, Matroule JY, Letesson JJ, De Bolle X (2010) Overproduced Brucella abortus PdhS‐mCherry forms soluble aggregates in Escherichia coli, partially associating with mobile foci of IbpA‐YFP. BMC Microbiol 10: 248 [DOI] [PMC free article] [PubMed] [Google Scholar]
- Velasco J, Bengoechea JA, Brandenburg K, Lindner B, Seydel U, Gonzalez D, Zahringer U, Moreno E, Moriyon I (2000) Brucella abortus and its closest phylogenetic relative, Ochrobactrum spp., differ in outer membrane permeability and cationic peptide resistance. Infect Immun 68: 3210–3218 [DOI] [PMC free article] [PubMed] [Google Scholar]
- Verhoeven GS, Dogterom M, den Blaauwen T (2013) Absence of long‐range diffusion of OmpA in E. coli is not caused by its peptidoglycan binding domain. BMC Microbiol 13: 66. [DOI] [PMC free article] [PubMed] [Google Scholar]
- Verstreate DR, Creasy MT, Caveney NT, Baldwin CL, Blab MW, Winter AJ (1982) Outer membrane proteins of Brucella abortus: isolation and characterization. Infect Immun 35: 979–989 [DOI] [PMC free article] [PubMed] [Google Scholar]
- Wientjes FB, Nanninga N (1989) Rate and topography of peptidoglycan synthesis during cell division in Escherichia coli: concept of a leading edge. J Bacteriol 171: 3412–3419 [DOI] [PMC free article] [PubMed] [Google Scholar]
- Woldringh CL, Huls P, Pas E, Brakenhoff GJ, Nanninge N (1987) Topography of peptidoglycan synthesis during elongation and polar cap formation in a cell division mutant of Escherichia coli MC4100. Microbiology 133: 575–586 [Google Scholar]
- van der Woude MW, Bäumler AJ (2004) Phase and antigenic variation in bacteria. Clin Microbiol Rev 17: 581–611 [DOI] [PMC free article] [PubMed] [Google Scholar]
- Zygmunt MS, Jacques I, Bernardet N, Cloeckaert A (2012) Lipopolysaccharide heterogeneity in the atypical group of novel emerging Brucella species. Clin Vaccine Immunol 19: 1370–1373 [DOI] [PMC free article] [PubMed] [Google Scholar]
Associated Data
This section collects any data citations, data availability statements, or supplementary materials included in this article.
Supplementary Materials
Appendix
Expanded View Figures PDF
Review Process File