Abstract
Azanone (HNO) is a reactive nitrogen species with pronounced biological activity and high therapeutic potential for cardiovascular dysfunction. A critical barrier to understanding the biology of HNO and furthering clinical development is quantification and real-time monitoring of delivery in living systems. Here, we describe the design and synthesis of the first chemiluminescent probe for HNO, HNOCL-1, which can detect HNO generated from as low as 138 nM Angeli’s salt with high selectivity based on reaction with a phosphine group to form a self-cleavable azaylide intermediate. We have capitalized on this high sensitivity to develop a generalizable kinetics-based approach, which provides real-time quantitative estimates of HNO concentration that show good agreement with computational simulations. This method can be used to quantify picomolar HNO concentrations generated from hydrogen sulfide (H2S) and nitric oxide (NO). HNOCL-1 can monitor dynamics of HNO delivery in living cells and tissues, demonstrating the versatility of this method for tracking HNO in living systems.
Keywords: nitroxyl, chemiluminescence, phosphine, bioanalytical
Graphical Abstract
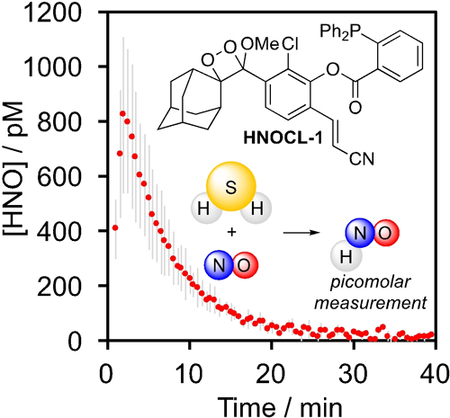
Light it up: A chemiluminescent 1,2-dioxetane molecule functionalized with a triarylphosphine trigger can quantify picomolar levels of azanone (HNO) through an azaylide mediated reaction using a kinetics-based approach. This probe can be used for quantitative measurement of HNO concentration generated from reaction of hydrogen sulfide (H2S) and nitric oxide (NO) and can be loaded into living cells and animals to monitor HNO delivery in real-time.
Azanone (HNO, nitroxyl), is chemically related to nitric oxide (NO) by the addition of one electron and one proton. HNO rapidly dimerizes and eliminates to form nitrous oxide (k = 8 × 10⁶ M–1s–1 at 23 °C)1 and reacts with molecular oxygen with estimated rate constants that range from 103 to 104 M–1s–1 (k = 3 × 10³ M–1s–1 at 37 °C;2 k = 1 × 10⁴ M–1s–1 at 23 °C;3 k = 1.8 × 10⁴ M–1s–1 at 25 °C4,5). Two major biological targets responsible for HNO bioactivity are thiols, which react directly with HNO to form sulfinamides (k = 2 × 10⁶ M–1s–1 at 37 °C)2 and the iron in heme-containing proteins.6 While both HNO and NO can activate soluble guanylyl cyclase, only HNO acts a positive cardiac inotrope by direct reaction with cysteine residues on cardiac ryanodine receptors and the sarcoplasmic reticulum Ca2+-ATPase (SERCA2a).7 Additionally, continued use does not lead to tolerance, a critical issue with organic nitrate NO donors.8 HNO derived from Angeli’s salt (Na2N2O3) reduces pain in animal models via a cGMP/PKG/KATP pathway9 and HNO derived from oxidative metabolism of cyanamide has been used clinically as a deterrent for alcohol consumption by inhibiting aldehyde dehydrogenase.10 Early attempts at using Angeli’s salt (Na2N2O3) and other HNO donors in the clinic were hampered by short half-lives, poor pharmacokinetics, and by-products.11 Newer N-hydroxysulfonamide donors CXL-1020 and CXL-1427, however, have shown promise in clinical trials for treatment of congestive heart failure.12,13 HNO can be produced in vitro by enzymes such as nitric oxide synthase,14 the reaction of S-nitrosoglutathione with glutathione,15 and the reduction of NO by H2S,16 thiols,17 and other biological molecules.18 Intriguingly, cellular generation of HNO from the reaction between H2S and NO has been implicated in regulating vascular tone and blood flow through an HNO/TRPA1/CGRP pathway.16,19
A critical requirement to advance understanding of HNO’s biological activity is the achievement of accurate and sensitive measurement of HNO delivery and production.20 HNO detection is complicated by its rapid dimerization and elimination to form nitrous oxide (N2O). Early approaches for HNO detection relied on gas chromatography measurements of N2O or on trapping HNO with heme proteins like myoglobin.21 HNO-selective electrodes based on immobilization of metalloporphyrins that bind to HNO offer the distinct advantage of real-time detection,22 but are unable to operate inside of living cells. This challenge is being addressed by the development of small molecule copper-based,23 phosphine-based,24–25,26 and TEMPO-based fluorescent probes.27 Thiol trapping of HNO allows monitoring of cellular delivery using capillary electrophoresis28 and, recently, a fluorescent probe based on the reaction of HNO with a sterically hindered thiol has been reported.29 Despite progress, quantification and real-time monitoring of HNO dynamics using reaction-based probes remain an unsolved problem.30
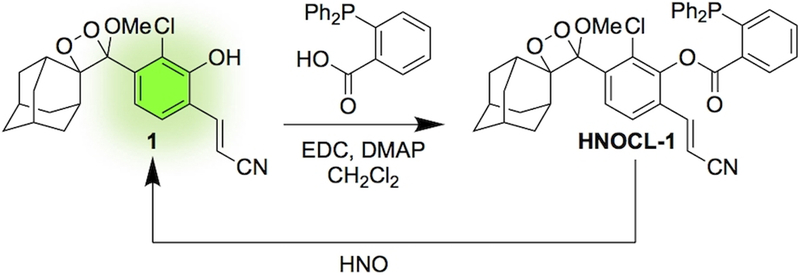
Chemiluminescence offers dramatic increases in signal to noise and sensitivity over fluorescence techniques.31,32 In particular, sterically stabilized 1,2-dioxetanes, such as Schaap’s dioxetane33 enable reaction-based triggering of chemiluminescence emission using a chemically initiated electron exchange luminescence (CIEEL) mechanism.34 This strategy has been used to image numerous analytes in vitro, in living cells, and in whole animals.35–36,37,38,39,40,41,42,43 Recent advances in molecular design have yielded structures with high emission under aqueous conditions without the need for polymeric “Enhancer” solutions.44–45,46 In line with our laboratory’s goal to develop probes for reactive sulfur, oxygen, and nitrogen (RSON) species,36,38,39,47–48,49,50 we designed a reaction-based chemiluminescent probe for HNO, HNOCL-1, by linking a triaryl phosphine group to a sterically stabilized 1,2-dioxetane (Scheme 1). Upon reaction with HNO, the triaryl phosphine is converted to an azaylide, followed by ester cleavage (Scheme S2).24,51The resultant phenol then undergoes CIEEL decomposition to emit light.34 Ester coupling using EDC and DMAP was performed after preparation of the dioxetane 1 to avoid phosphine oxidation. Although yields were lowered by competitive CIEEL decomposition, the rapid rate of ester formation enabled production and isolation of HNOCL-1.
Scheme 1.
Design and synthesis of the chemiluminescent HNO probe HNOCL-1.
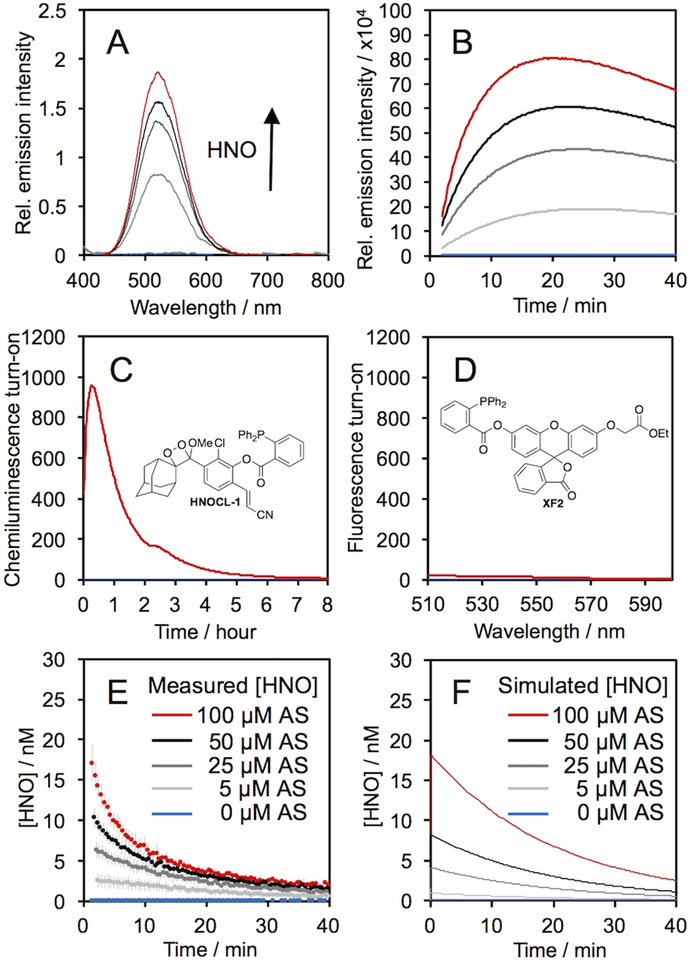
The response of HNOCL-1 was evaluated by treating the probe with increasing concentrations of Angeli’s salt, a commonly used donor compound for HNO (Figure 1). Before adding Angeli’s salt no chemiluminescence emission was observed, but upon its addition an emission centered at 525 nm increased in a dose-dependent manner (Figure 1A). The time-course of the emission intensity (Figure 1B) increased to reach a maximum in approximately 15 minutes for 100 μM Angeli’s salt, and continue to emit light for 8 hours (Figure 1C). Analysis of the products by GC/MS revealed two abundant signals at m/z = 150.1 and 304.1, which we assign to adamantanone and the stabilized acyl iminophosphorane,52 respectively (Figure S1,2). A comparison was made to a cell-permeable version of a previously reported fluorescent probe for HNO, herein named XF2 (Figure 1D, full characterization can be found in the supplementary information).36 While the fluorescent probe XF2 yielded a 20-fold turn-on response after 25 minutes, HNOCL-1 provided an 833-fold turn-on response at the same time point (Figure 1C). HNOCL-1 is soluble at 20 μM (Figure S3) and stable in aqueous buffer (Figure S4). In order to estimate the lower limit of detection, HNO release from low concentrations of Angeli’s salt was measured (Figure S5), and a detection limit of 138 nM (3σ) was determined (Figure S5B).
Figure 1.
Chemiluminescence response of HNOCL-1 and Angeli’s salt, Na2N2O3 (AS). (A) Chemiluminescence emission spectra at 525 nm of 20 μM HNOCL-1 and 0 (blue trace), 50, 100, 150, and 200 μM (red trace) AS. (B) Time course of chemiluminescence emission of 0 (blue trace), 5, 25, 50, and 100 μM (red trace) AS. (C) Time course of chemiluminescence emission of 10 μM HNOCL-1 and 0 (blue trace) or 200 μM (red trace) AS. (D) Fluorescence emission spectra of 10 μM XF2 after reacting with 0 (blue trace) or 200 μM (red trace) AS for 25 minutes. (E)–(F) Concentration of HNO generated from AS (E) measured from the raw chemiluminescence emission of 20 μM HNOCL-1 or (F) computationally simulated. All experiments were performed in 20 mM HEPES or PBS (pH 7.4), containing ≤1% DMSO. Error bars are ± S.D. from n = 6 replicates.
Encouraged by this sensitivity, we anticipated that quantitative real-time estimates of HNO concentration could be obtained using HNOCL-1 based on kinetic modeling analogous to that used for electrode quantification.22 The rate equations of the relevant reactions were used to derive Eq. (1), an expression for HNO concentration in terms of the concentration of the phenol 1 (see supporting information for details). In Eq. (1), k1 is the observed second order rate constant of the probe and HNO, and k3 is the rate of chemiluminescent decomposition of the dioxetane 1.
| (1) |
The rate of the reaction of HNOCL-1 was determined by the method of Miranda and Wink (k1 = 20,433 M–1s–1 at 25 °C, pH 7.4, Figure S7)2 and the rate of chemiluminescent decomposition, k3, was determined from measurements of the exponential decay of isolated 1 (k3 = 5.92 × 10⁻⁴ s–1 at 25 °C, pH 7.4, Figure S8). The raw chemiluminescence emission was converted into [1] by careful calibration of the chemiluminescence emission with varying concentrations of the isolated phenol 1 (Figure S9). Using this kinetics-based approach, the plot of raw chemiluminescence emission given in Figure 1B was converted into real-time quantitative measurements of HNO concentration in Figure 1E. These traces generally show agreement with estimates based on simulated traces constructed by numerically solving the appropriate differential equation describing HNO kinetics (Figure 1F, see supporting information for details).
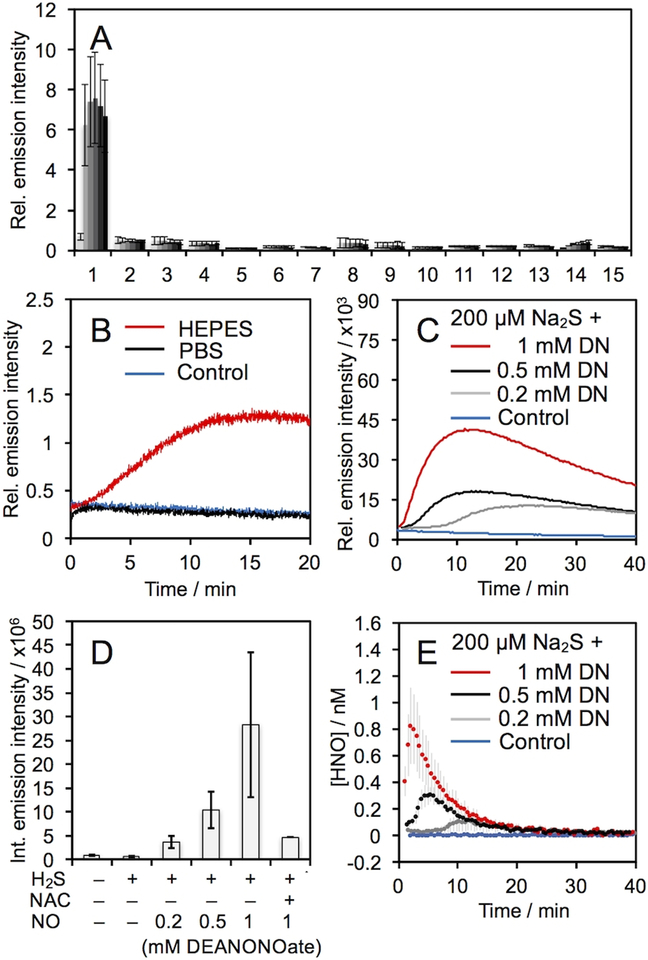
The selectivity of HNOCL-1 for HNO was determined by monitoring the chemiluminescence emission across a panel of selected RSON species (Figure 2A). In general, no significant response was observed for other species over the blank control. One exception was for DEA NONOate, a donor of NO (Figure 2A, bar 14). A small, but observable, increase in chemiluminescence emission over time was seen, which became readily apparent when the concentration was raised to 1 mM DEA NONOate (Figure 2B, red trace). Given literature precedent for formation of HNO from NO reduction,16–18 we hypothesized that this increase could be due to reduction of NO by HEPES in the buffer. Indeed, reacting HNOCL-1 with DEA NONOate in PBS buffer completely attenuated this response (Figure 2B, black trace).
Figure 2.
Chemiluminescent responses of 20 μM HNOCL-1 and 200 μM RSON species. Legend: 1. AS, 2. GSH (2 mM), 3. GSNO, 4. H2O2, 5. KO2, 6. Cys (1 mM), 7. Na2S, 8. Na2S2O3, 9. NaNO2, 10. HO•, 11. ONOO–, 12. tBuOOH, 13. OCl–, 14. DEA NONOate, 15. Blank. (B) Time-course of the chemiluminescent emission of 20 μM HNOCL-1 alone (blue trace), with 1 mM DEA NONOate (DN) in PBS (black trace), and with 1 mM DN in HEPES (red trace). (C) Time course of chemiluminescent emission and (D) integrated emission intensity of 20 μM HNOCL-1 alone (blue trace), 200 μM Na2S alone or with 0.2, 0.5, and 1 mM (red trace) DN, and 200 μM Na2S, 1 mM DN, and 2 mM N-acetyl cysteine (NAC). (E) Concentration of HNO produced from 20 μM HNOCL-1 alone (blue trace), and 200 μM Na2S and 0.2, 0.5, and 1 mM (red trace) DN as determined from Eq. (1) and the data shown in (C). All experiments were performed in 20 mM HEPES or PBS (pH 7.4), containing ≤1% DMSO. Error bars are ± S.D. from n = 3–6 replicates.
The production of HNO from H2S and NO has been proposed as a biological pathway for HNO generation and has been implicated in an HNO/TRPA1/CGRP signaling pathway.16,19 HNOCL-1 shows a clear dose-dependent increase in HNO production from H2S and DEA NONOate (Figure 2C,D), a signal that is diminished in the absence of DEA NONOate or in the presence of N-acetyl cysteine (NAC) as a thiol scavenger of HNO (Figure 2D). Using the kinetics-based approach described above, real-time quantitative estimates of HNO production from H2S and NO were determined (Figure 2E). With 200 μM Na2S and 1 mM DEA NONOate, a peak concentration of ca. 800 pM HNO was observed within the first several minutes of reaction (Figure 2E, red trace). With less NO, the peak concentration was reduced and the time to reach the peak concentration of HNO was increased (Figure 2E, black trace and grey trace).
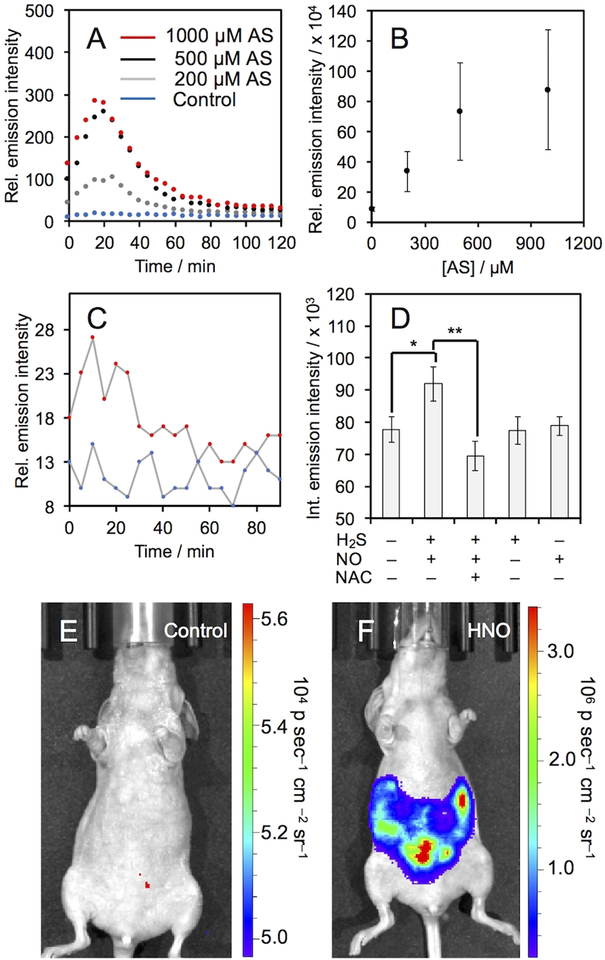
We proceeded to evaluate the ability of HNOCL-1 to measure HNO in biological systems. No cellular toxicity was observed with 18-hour incubation of up to 100 μM HNOCL-1 (Figure S10). Living A549 cells were incubated with HNOCL-1 for 30 minutes, thoroughly washed, and then treated with increasing amounts of Angeli’s salt, resulting in increasing chemiluminescence emission (Figure 3A). The time-course of cellular HNO delivery can be monitored in real-time, with a maximum chemiluminescence emission observed at 20 minutes. The response is roughly linear with Angeli’s salt concentrations between 0 and 500 μM and begins to level out at 1 mM (Figure 3B). Similar results were obtained in RAW 264.7 macrophages (Figure S11). Control experiments comparing signal seen from A549 cells incubated with HNOCL-1 and untreated cells show that this technique has very low background (Figure S12). In comparison to the fluorescent probe XF2 with 200 μM AS, which gives a 37% increase in signal (Figure S13A–G), HNOCL-1 gives a 747% increase for a 20-fold improvement over XF2 for cellular operation (Figure S13H). In order to interrogate the ability of HNOCL-1 to measure NO reduction chemistry in living cells, we treated A549 cells with HNOCL-1 and then added DEA NONOate and Na2S (Figure 3C). A clear, statistically significant increase was observed (Figure 3D), in agreement with previous studies.16,53 Control experiments in the absence of H2S and DEA NONOate or using N-acetyl cysteine (NAC) as a thiol scavenger returned signal to baseline levels. Fluorescence microscopy images of the fluorescent product of the HNOCL-1 and HNO confirm cellular uptake (Figure S14). Next, we evaluated the ability of HNOCL-1 to image HNO production in animal tissue54 by comparing chicken hearts treated with HNOCL-1 and Angeli’s salt to hearts treated with HNOCL-1 and vehicle, where a significant increase in photon flux was observed (Figure S15). Finally, we performed a preliminary evaluation of the efficacy of HNOCL-1 for whole animal imaging by imaging signal following intraperitoneal (IP) injection of HNOCL-1 and either a vehicle control or 1 mM Angeli’s salt (Figure 3E,F). A 300-fold increase in chemiluminescence emission was observed in the mouse treated with Angeli’s salt (Figure S16) and time-lapse imaging provided a measure of the lifetime and perfusion of HNOCL-1 in a living mouse (Movie S1).
Figure 3.
Chemiluminescent measurement of HNO in living cells. (A) Time course of chemiluminescent emission and (B) integrated emission intensity of A549 cells incubated with 20 μM HNOCL-1 for 30 minutes, washed and then treated with AS. Error bars are ±S.D. from n = 9 wells across 3 biological replicates. (C) Time course of chemiluminescence emission of A549 cells incubated with 20 μM HNOCL-1 for 30 minutes, washed and then incubated without (blue trace) or with 1 mM DEA NONOate (DN) and 200 μM Na2S (red trace). (D) Integrated emission intensity of A549 cells incubated with 20 μM HNOCL-1 for 30 minutes, washed and then treated as indicated with H2S as 200 μM Na2S, NO as 1 mM DN, and NAC at 2 mM. Error bars are ±S.E. from n = 6–11 wells and 2–4 biological replicates. Statistical significance was assessed using a two-tailed student’s t-test. **p<0.01, *p<0.05. All cellular experiments were performed at 37 °C. (E)–(F) Images of BALB/c nude mice 2 minutes after IP injection with 40 μM HNOCL-1 and (E) vehicle control or (F) 1 mM Angeli’s salt in 20 mM PBS (pH 7.4) containing 5% DMSO.
In summary, we have described the first chemiluminescent probe for real-time monitoring of HNO in living cells. The rapid and sensitive response has enabled an innovative kinetics-based approach that provides quantitative estimates of HNO concentration. To date, this has only been accomplished using electrodes22 and a xerogel optical sensor film,55 which are inherently limited to extracellular monitoring. Chemiluminescent probes like HNOCL-1 can be loaded into cells, and we anticipate that expansion of this kinetics-based approach will lead to a unique method for quantification of HNO in living cells. This approach is generalizable to other reaction-based probes as long as one can achieve high sensitivity, mechanistic understanding, and evaluation of kinetic parameters. The cellular data shows that HNOCL-1 provides a method to reliably monitor the time-course of HNO delivery from donor systems and preliminary experiments in living mice demonstrate that the high photon flux from HNOCL-1 is sufficient for imaging HNO in animal tissue. We anticipate that HNOCL-1 will find use in understanding HNO biology and the development of new HNO-based therapeutics.
Supplementary Material
Acknowledgements
This work was supported by the National Institutes of Health (NIH) under R15GM114792, the National Science Foundation under CHE 1653474, and optical imaging was performed using an IVIS purchased under NIH 1S10RR024757 and supported by NIH P30 CA142543. We acknowledge Manasa Subbarao, Sara Lange, and Jian Cao for experimental assistance and thank Maciej Kukula (UT Arlington) for assistance with mass spectrometry. A.R.L. declares a financial stake in Biolum Sciences, LLC.
Contributor Information
Lyn Mouhaffel, Department of Chemistry, Center for Drug Discovery, Design, and Delivery (CD4), and Center for Gobal Health Impact (CGHI), Southern Methodist University, Dallas, TX, USA 75205-0314.
Ralph P. Mason, Prognostic Imaging Research Laboratory (PIRL), Pre-clinical Imaging Section, Department of Radiology, UT Southwestern Medical Center, Dallas, TX, USA 75390-9058
Alexander R. Lippert, Department of Chemistry, Center for Drug Discovery, Design, and Delivery (CD4), and Center for Gobal Health Impact (CGHI), Southern Methodist University, Dallas, TX, USA 75205-0314
References
- [1].Shafirovich V, Lymar SV, Proc. Natl. Acad. Sci. USA 2002, 99, 7340–7345. [DOI] [PMC free article] [PubMed] [Google Scholar]
- [2].Miranda KM, et al. , Proc. Natl. Acad. Sci. USA 2003, 100, 9196–9201. [DOI] [PMC free article] [PubMed] [Google Scholar]
- [3].Liochev SI; Fridovich I, Free Radic. Biol. Med 2003, 34, 1399–1404. [DOI] [PubMed] [Google Scholar]
- [4].Smulik R; Debski D, Zielonka J; Michalowski B, Adamus J, Marcinek A, Kalyanaraman B, Sikora A, J. Biol. Chem 2014, 289, 35570–35581. [DOI] [PMC free article] [PubMed] [Google Scholar]
- [5].Smulik-Izydorczyk R, Mesjasz A, Gerbich A, Adamus J, Michalski R, Sikora A, Nitric Oxide 2017, 69, 61–68. [DOI] [PubMed] [Google Scholar]
- [6].Farmer PJ, Sulc F, J. Inorg. Biochem 2005, 99, 166–184. [DOI] [PubMed] [Google Scholar]
- [7].Tocchetti CG, et al. , Circ. Res 2007, 100, 96–104. [DOI] [PMC free article] [PubMed] [Google Scholar]
- [8].Münzel T, Daiber A, Mülsch A, Circ. Res 2005, 97, 618–628. [DOI] [PubMed] [Google Scholar]
- [9].Staurengo-Ferrari L, et al. , Pharmacol. Rep 2014, 66, 691–698. [DOI] [PMC free article] [PubMed] [Google Scholar]
- [10].DeMaster EG, Redfern B, Nagasawa HT, Biochem. Pharmacol 1998, 55, 2007–2015. [DOI] [PubMed] [Google Scholar]
- [11].Kemp-Harper BK, Horowitz JD, Ritchie RH, Drugs 2016, 76, 1337–1348. [DOI] [PubMed] [Google Scholar]
- [12].Cowart D, Aranda J, Haas G, Smith W, Mazhari R, Kalish V, Colucci W, J. Am. Coll. Cardiol 2011, 57, 1250–1258. [Google Scholar]
- [13].Cowart D, Venuti R, Guptill J, Noveck R, Foo S, J. Am. Coll. Cardiol 2015, 65, A876. [Google Scholar]
- [14].Adak S, Wang Q, Stuehr DJ, J. Biol. Chem 2000, 275, 33554–33561. [DOI] [PubMed] [Google Scholar]
- [15].Wong PSY, Hyun J, Fukuto JM, Shirota FN, DeMaster EG, Shoeman DW, Nagasawa HT, Biochemistry 1998, 37, 5362–5371. [DOI] [PubMed] [Google Scholar]
- [16].Eberhardt M, et al. , Nat. Commun 2014, 5, 4381. [DOI] [PMC free article] [PubMed] [Google Scholar]
- [17].Suarez SA, Muñoz M, Alvarez L, Venancio MF, Rocha WR, Bikiel DE, Marti MA, Doctorovich F, J. Am. Chem. Soc 2017, 139, 14483–14487. [DOI] [PubMed] [Google Scholar]
- [18].Suarez SA, et al. , J. Am. Chem. Soc 2015, 137, 4720–4727. [DOI] [PubMed] [Google Scholar]
- [19].Dux M, Will C, Vogler B, Filipovic MR, Messlinger K, Br. J. Pharmacol 2016, 173, 431–445. [DOI] [PMC free article] [PubMed] [Google Scholar]
- [20].Miao Z, King SB, Nitric Oxide 2016, 57, 1–14. [DOI] [PMC free article] [PubMed] [Google Scholar]
- [21].Paolocci N, Jackson MI, Lopez BE, Miranda K, Tocchetti CG, Wink DA, Hobbs AJ, Fukuto JM, Pharmacol. Ther 2007, 113, 442–458. [DOI] [PMC free article] [PubMed] [Google Scholar]
- [22].Suárez SA, Bikiel DA, Wetzler DE, Martí MA, Doctorovich F, Anal. Chem 2013, 85, 10262–10269. [DOI] [PubMed] [Google Scholar]
- [23].Rivera-Fuentes P, Lippard SJ, Acc. Chem. Res 2015, 48, 2927–2934. [DOI] [PubMed] [Google Scholar]
- [24].Reisz JA, Zink CN, King SB, J. Am. Chem. Soc 2011, 133, 11675–11685. [DOI] [PMC free article] [PubMed] [Google Scholar]
- [25].Miao Z, Reisz JA, Mitroka SM, Pan J, Xian M, King SB, Bioorg. Med. Chem. Lett 2014, 25, 16–19. [DOI] [PMC free article] [PubMed] [Google Scholar]
- [26].Kawai K, Ieda N, Aizawa K, Suzuki T, Miyata N, Nakagawa H, J. Am. Chem. Soc 2013, 135, 12690–12696. [DOI] [PubMed] [Google Scholar]
- [27].Cline MR, Toscano JP, J. Phys. Org. Chem 2011, 24, 993–998. [Google Scholar]
- [28].Johnson GM, Chozinski TJ, Gallagher ES, Aspinwall CA, Miranda KM, Free Radic. Biol. Med 2014, 76, 299–307. [DOI] [PMC free article] [PubMed] [Google Scholar]
- [29].Pino NW, Davis III J, Yu Z, Chan J, J. Am. Chem. Soc 2017, 139, 18476–18479. [DOI] [PMC free article] [PubMed] [Google Scholar]
- [30].Dong B, Kong X, Lin W, ACS Chem. Biol 2018, 13, 1714–1720. [DOI] [PubMed] [Google Scholar]
- [31].Roth-Konforti M, Bauer C, Shabat D, Angew. Chem. Int. Ed 2017, 129, 15839–15844. [DOI] [PubMed] [Google Scholar]
- [32].Ryan LS, Lippert AR, Angew. Chem. Int. Edit 2018, 57, 622–624. [DOI] [PubMed] [Google Scholar]
- [33].Schaap AP, Chen T, Handley RS, Tetrahedron Lett. 1987, 28, 4874–4880. [Google Scholar]
- [34].Vacher M, et al. , Chem. Rev 2018, 118, 6927–6974. [DOI] [PubMed] [Google Scholar]
- [35].An W, Mason RP, Lippert AR, Org. Biomol. Chem 2018, 16, 4176–4182. [DOI] [PMC free article] [PubMed] [Google Scholar]
- [36].Cao J, An W, Reeves AG, Lippert AR, Chem. Sci 2018, 9, 2552–2558. [DOI] [PMC free article] [PubMed] [Google Scholar]
- [37].Liu L, Mason RP, PLoS One 2010, 5, e12024. [DOI] [PMC free article] [PubMed] [Google Scholar]
- [38].Cao J, Lopez R, Thacker JM, Moon JY, Jiang C, Morris SNS, Bauer JH, Tao P, Mason RP, Lippert AR, Chem. Sci 2015, 6, 1979–1985. [DOI] [PMC free article] [PubMed] [Google Scholar]
- [39].Cao J, Campbell J, Liu L, Mason RP, Lippert AR, Anal. Chem 2016, 88, 4995–5002. [DOI] [PMC free article] [PubMed] [Google Scholar]
- [40].Bruemmer KJ, Green O, Su TA, Shabat D, Chang CJ, Angew. Chem. Int. Ed 2018, 57, 7508–7512. [DOI] [PMC free article] [PubMed] [Google Scholar]
- [41].Gao Y, Lin Y, Liu T, Zhang X, Xu F, Liu P, Du L, Li M, Chinese Chem. Lett 2018, doi: 10.1016/j.cclet.2018.03.028. [DOI] [Google Scholar]
- [42].Green O, Gnaim S, Blau R, Eldar-Boock A, Satchi-Fainaro R, Shabat D, J. Am. Chem. Soc 2017, 139, 13243. [DOI] [PubMed] [Google Scholar]
- [43].Hananya N, Boock AE, Bauer CR, Satchi-Fainaro R, Shabat D, J. Am. Chem. Soc 2016, 138, 13438. [DOI] [PubMed] [Google Scholar]
- [44].Green O, Eilon T, Hanayana N, Gutkin S, Bauer CR, Shabat D, ACS Cent. Sci 2017, 3, 349–358. [DOI] [PMC free article] [PubMed] [Google Scholar]
- [45].Lippert AR, ACS. Cent. Sci 2017, 3, 260–271. [DOI] [PMC free article] [PubMed] [Google Scholar]
- [46].Gnaim S, Green O, Shabat D, Chem. Commun 2018, 54, 2073–2085. [DOI] [PubMed] [Google Scholar]
- [47].Bruemmer KJ, Merrikhihaghi S, Lollar CT, Morris SNS, Bauer JH, Lippert AR, Chem. Commun 2014, 50, 12311–12314. [DOI] [PubMed] [Google Scholar]
- [48].Quimbar ME, Krenek KM, Lippert AR, Methods 2016, 109, 123–130. [DOI] [PMC free article] [PubMed] [Google Scholar]
- [49].Reeves AG, Subbarao M, Lippert AR, Anal. Methods 2017, 9, 3418–3421. [DOI] [PMC free article] [PubMed] [Google Scholar]
- [50].Kroll JL, Werchan CA, Reeves AG, Bruemmer KJ, Lippert AR, Ritz T, Physiol. Behav 2017, 179, 99–104. [DOI] [PubMed] [Google Scholar]
- [51].Reisz JA, Klorig EB, Wright MW, King SB, Org. Lett 2009, 11, 2719–2721. [DOI] [PubMed] [Google Scholar]
- [52].Bittner S, Assaf Y, Krief P, Pomerantz M, Ziemnicka BT, Smith CG, J. Org. Chem 1985, 50, 1712–1718. [Google Scholar]
- [53].Zhou Y, Zhang X, Yang S, Li Y, Qing Z, Zheng J, Li J, Yang R, Anal. Chem 2017, 89, 4587–4594. [DOI] [PubMed] [Google Scholar]
- [54].Mason EA, Lopez R, Mason RP, Opt. Mater. Express 2016, 6, 1384–1392. [Google Scholar]
- [55].Dobmeier KP, Riccio DA, Schoenfisch MH, Anal. Chem 2008, 80, 1247–1254. [DOI] [PMC free article] [PubMed] [Google Scholar]
Associated Data
This section collects any data citations, data availability statements, or supplementary materials included in this article.


