

Abstract
Primary biliary cholangitis (PBC) is an autoimmune liver disease that can lead to cirrhosis and liver failure. Our aim was to assess the recent trends in the mortality rates and health care utilization of patients with PBC seen in the inpatient setting in the United States. We used the National (Nationwide) Inpatient Sample data (2005‐2014). The study population included adults with PBC, using International Classification of Diseases, Ninth Revision codes. Trends in PBC‐related discharges, total charges, length of stay (LoS), and in‐hospital mortality were evaluated. Hierarchical generalized linear models were performed for determining predictors of mortality and total hospital charges. Between the study years of 2005 and 2014, a total of 22,665 hospitalized cases with PBC were identified (mean age 63 years; 84% female, 76% white). The number of PBC‐related discharges increased from 3.24 per 100,000 in 2005 to 3.68 per 100,000 in 2014, with an average annual increase of 1.4% (95% confidence interval [CI]: 0.4%‐2.4%). Fifty‐seven percent had Medicare as their primary payer, 37% had cirrhosis, and 1.3% had hepatocellular carcinoma. Between 2005 and 2014, the average total charges for PBC increased from $53,901 to $57,613 (annual percent change [APC], 1.7%; 95% CI: −0.2%‐3.5%), LoS decreased from 6.9 days to 5.4 days (APC, −2.2%; 95% CI: −3.2% to −1.1%), and mortality rate decreased from 3.8% to 2.8% (APC, −5.4%; 95% CI: −8.4% to −2.4%). Multivariable analysis revealed that ascites were independently associated with increased risk of in‐hospital mortality (odds ratio: 1.77; 95% CI: 1.50‐2.08), increased charge (percent change: 22.5%; 95% CI: 18.6%‐26.7%), and increased LoS (percent change: 29.7%; 95% CI: 25.7%‐33.9%). Conclusion: The number of PBC cases has increased in recent years. Mortality and LoS have decreased, and the total charges have remained the same.
Abbreviations
- APC
annual percentage change
- CCI
Charlson Comorbidity Index
- CI
confidence interval
- HCUP
Healthcare Costs and Utilization Project
- ICD‐9
International Classification of Diseases, Ninth Revision
- LoS
length of stay
- NIS
National (Nationwide) Inpatient Sample
- OR
odds ratio
- PBC
primary biliary cholangitis
- UDCA
ursodeoxycholic acid
Primary biliary cholangitis (PBC), formerly known as primary biliary cirrhosis, is an autoimmune liver disease involving small bile ducts in the liver.1, 2 The disease is more prevalent among females, and patients generally present with fatigue, occasionally in combination with pruritus.3 Although PBC is relatively rare, it is considered the most common autoimmune liver disease. In fact, some studies have suggested that the prevalence rates of PBC may be on the rise.3, 4, 5 The disease is of multifactorial etiology with suspected contributions from genetic and environmental factors. The pathogenesis of PBC appears to involve T lymphocyte–mediated attack of the enzyme PDC‐E2 found in mitochondria.6 In PBC, small intralobular bile ducts are primarily affected and gradually destroyed, resulting in cholestasis and potentially leading to cirrhosis and liver failure.1, 7, 8 PBC is usually diagnosed by liver enzyme abnormalities and the presence of antimitochondrial antibodies in the absence of extrahepatic biliary obstruction or other liver disease.9 Since the 1980s, ursodeoxycholic acid (UDCA) has become the mainstay for treatment of PBC.10, 11 UDCA is not a definitive cure, but treatment can slow disease progression and delay the need for liver transplantation.12 Additionally, obeticholic acid, a farnesoid X receptor agonist, has been recently approved for patients with PBC with inadequate response to UDCA and for patients who are intolerant to UDCA.13, 14 Despite effective treatment for PBC, a number of these patients develop advanced liver disease and are listed for liver transplantation. The aim of this study is to investigate and quantify the economic and mortality burden of PBC in the hospitalized patients from the United States between 2005 and 2014.
Materials and Methods
Study Population
The National (Nationwide) Inpatient Sample (NIS) is a large, nationally representative hospital discharge database developed by the Agency for Healthcare Research and Quality as part of the Healthcare Costs and Utilization Project (HCUP).15 The NIS was designed to approximate a 20% stratified sample of all discharges from US community hospitals, excluding rehabilitation and long‐term acute care hospitals, on a year‐to‐year basis. Beginning with 2012, the NIS was redesigned for more stable and precise national estimates of all HCUP participating hospitals rather than a sample of hospitals from which all discharges were obtained.
NIS data from 2005 to 2014 were queried in this study. All discharges with the diagnosis of PBC (International Classification of Diseases, Ninth Revision [ICD‐9] code 571.6) using all listed diagnoses were included. In addition, patient demographics, characteristics of hospital, severity of illness, and resource utilizations were collected. Complications such as ascites, hepatic encephalopathy, portal hypertension, and gastroesophageal varices were also derived by using the ICD‐9 codes (Supporting Table S1). Deyo‐modification of the Charlson Comorbidity Index (CCI)16 was calculated. The major outcomes evaluated in this study were in‐hospital mortality, total charges, length of stay (LoS), and total number of discharges in a year, together with their changes over the study period.
Statistical Analysis
The sample design elements (clusters, strata, and trend weights) provided by the NIS were used to create national estimates for the total number of PBC discharges and total resource utilization parameters across the study period. The standard errors of percentages/means were estimated using the Taylor linearization method, a method that incorporates the sample design. We calculated discharges per 100,000 in the population by dividing the estimated total discharges by US population estimates from the Census Bureau. The annual percent change for the full study period was calculated using Joinpoint software.17 The term “increasing” or “decreasing” was used to describe whether the trends in the annual percent change (APC) was significantly different from zero; otherwise, the term “leveled off” or “stable” was used. The prevalence of various parameters, including demographic parameters, resource utilizations and comorbidities, was compared over time using analysis of variance for continuous variables, the stratum‐specific chi‐square for categorical variables, and the method of weighted least squares recommended by HCUP for trend analysis.18 Data were expressed as weighted means or percentages ± standard error. Multiple imputations were adopted to address missing data. Multiple imputations provide a valid and effective method for dealing with missing data, and is widely adopted in practice.19, 20, 21, 22 All variables in our multivariable model and the sample design elements were included in the imputation model. The 20 imputed data sets were created using the Markov chain Monte Carlo23 and fully conditional specification imputation method24 recommended by HCUP. The hierarchical generalized linear model (HGLM) with hospitals as random effects was used to evaluate independent predictors of in‐hospital mortality, total charge, and LoS. A sensitivity analysis was performed in the subset of patients with no missing information on variables in HGLM. All P values of 0.05 or less were considered as statistically significant. All analyses were performed with SAS software version 9.4 (SAS Institute, Cary, NC).
Results
Trends in PBC‐Related Discharges
Between 2005 and 2014, a total of 22,665 PBC discharges were reported in our study cohort. The PBC discharge rate per 100,000 in the population consistently increased from 3.24 in 2005 to 3.68 in 2014, with an average annual increase of 1.4% (95% confidence interval [CI]: 0.4%‐2.4%). In females, the rate increased from 5.37 per 100,000 in 2005 to 6.20 per 100,000 in 2014 (APC: 1.4%; 95% CI: 0.1%‐2.6%), whereas the rate was not increased in males (APC: 1.7%; 95% CI: −0.9%‐2.6%) (Fig. 1 and Supporting Table S2).
Figure 1.
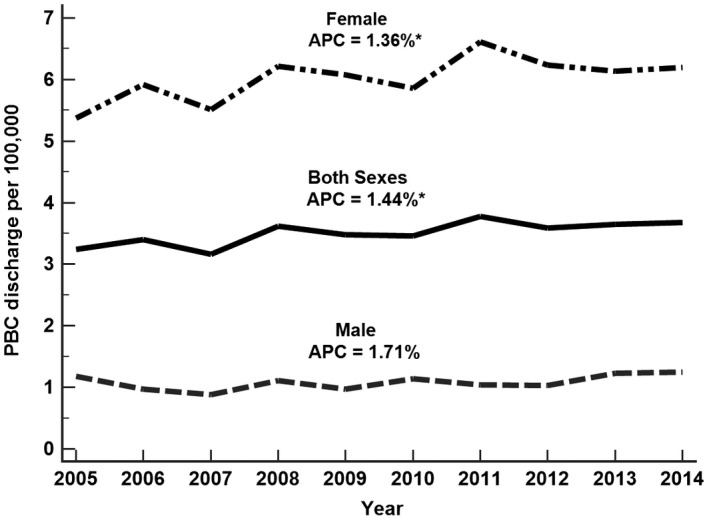
PBC discharge rate per 100,000, United States, 2005‐2014.
Characteristics of Patients With PBC
Baseline characteristics of patients with PBC diagnosis are summarized in Table 1. Most of the PBC discharges were older (average age 63 years), 76% were white, 84.4% were female, and 56.7% had Medicare as their primary payer (Table 1). Patients between the ages of 45 and 65 years were the largest subgroup and comprised 38.37% of those with the disease. Table 2 reports the clinical characteristics of PBC discharges by comparing the weighted data for 2005 and 2014. Descriptions of the hospitals where patients with PBC were admitted are given in Table 3. Most of these patients were hospitalized at large hospitals (65.0%) and teaching hospitals (55.9%) (Table 3). They underwent an average of 1.88 ± 0.04 procedures and had average charges of $56,400 ± $1,268, with an average LoS of 5.82 ± 0.07 days. The average total charge per discharge remained stable during the 2005‐2014 period.
Table 1.
Characteristics of PBC Discharges, NIS 2005‐2014
| Characteristic | 2005‐2014 (Weighted) | 2005 (Weighted) | 2014 (Weighted) | APC (95% CI) |
|---|---|---|---|---|
| Age, years | 63.03 ± 0.19 | 61.02 ± 0.95 | 63.46 ± 0.41 | 0.0 (−0.3‐0.3) |
| Race, % | ||||
| White | 76.01 ± 0.56 | 77.94 ± 2.23 | 75.18 ± 1.18 | −0.5 (−0.8 to −0.1) * |
| Black | 5.95 ± 0.24 | 4.75 ± 0.89 | 6.82 ± 0.61 | 1.7 (−0.7‐4.2) |
| Other † | 18.04 ± 0.52 | 17.30 ± 2.26 | 18.00 ± 1.04 | 1.3 (−0.7‐3.3) |
| Female, % | 84.35 ± 0.32 | 81.46 ± 1.37 | 82.78 ± 0.81 | −0.2 (−0.6‐0.3) |
| Primary payer, % | ||||
| Medicare | 56.7 ± 0.50 | 54.47 ± 2.00 | 61.08 ± 1.13 | 0.9 (−0.3‐2.0) |
| Medicaid | 9.03 ± 0.31 | 10.80 ± 1.42 | 9.29 ± 0.71 | 0.7 (−1.6‐3.1) |
| Private | 29.7 ± 0.43 | 30.95 ± 1.78 | 26.40 ± 1.06 | −1.7 (−3.7‐0.5) |
| Other | 4.55 ± 0.19 | 3.78 ± 0.53 | 3.24 ± 0.42 | −1.3 (−5.1‐2.7) |
| Elective admission, % | 17.91 ± 0.35 | 20.32 ± 1.38 | 15.29 ± 0.81 | −3.7 (−5.0 to −2.3) * |
| Disposition status, % | ||||
| Routine | 60.63 ± 0.39 | 63.17 ± 1.47 | 58.73 ± 1.05 | −0.6 (−1.1‐0.0) |
| Short‐term hospital | 3.66 ± 0.14 | 3.40 ± 0.45 | 3.32 ± 0.37 | −0.6 (−2.6‐1.5) |
| SNF/ICF/Other | 15.95 ± 0.28 | 14.91 ± 1.06 | 17.96 ± 0.83 | 0.6 (−1.0‐2.3) |
| Home health care | 15.76 ± 0.29 | 14.46 ± 1.03 | 16.53 ± 0.78 | 2.8 (1.0‐4.6) |
| Against medical advice | 0.37 ± 0.04 | 0.20 ± 0.10 | 0.59 ± 0.15 | 2.4 (−9.1‐15.4) |
| Died ‡ | 3.62 ± 0.13 | 3.86 ± 0.50 | 2.86 ± 0.33 | −5.4 (−8.4 to −2.4) * |
| Resource utilization | ||||
| Number of procedure | 1.88 ± 0.04 | 1.84 ± 0.10 | 1.78 ± 0.05 | −0.3 (−2.1‐1.5) |
| LoS, days | 5.82 ± 0.07 | 6.85 ± 0.38 | 5.37 ± 0.15 | −2.2 (−3.2 to −1.1) * |
| Charge, $ § | 56,400 ± 1,268 | 53,901 ± 2,115 | 57,613 ± 1,174 | 1.7 (−0.2‐3.5) |
| Cost, $ § , || | 17,059 ± 359 | 19,557 ± 910 | 15,646 ± 333 | −2.4 (−4.3 to −0.5) * |
Data presented as weighted mean/percentage ± standard error.
Significantly different from 0 (P < 0.05) is indicated in bold.
P < 0.05.
Other races include Hispanic/Asian/Native American; 14.9% of race was missing.
In‐hospital mortality.
Inflation adjusted to 2016 dollars.
Cost was converted from charges using the HCUP cost‐to‐charge ratio.
Abbreviations: ICF, intermediate care facility; and SNF, skilled nursing facility.
Table 2.
Clinical Characteristics of PBC Discharges, NIS 2005‐2014
| Characteristic | 2005‐2014 (Weighted) | 2005 (Weighted) | 2014 (Weighted) | APC (95% CI) |
|---|---|---|---|---|
| Number diagnosed | 11.88 ± 0.06 | 8.88 ± 0.13 | 14.32 ± 0.14 | 5.3 (4.7‐5.9) * |
| Severity of illness, % | ||||
| Minor/moderate | 38.27 ± 0.38 | 45.04 ± 1.42 | 33.43 ± 1.09 | −2.9 (−4.7 to −1.0) * |
| Major/extreme | 61.73 ± 0.38 | 54.96 ± 1.42 | 66.57 ± 1.09 | 1.9 (0.7‐3.2) * |
| Risk of dying, % | ||||
| Minor/moderate | 60.95 ± 0.37 | 67.75 ± 1.30 | 54.77 ± 1.08 | −2.3 (−3.1 to −1.5) * |
| Major/extreme | 39.05 ± 0.37 | 32.25 ± 1.30 | 45.23 ± 1.08 | 3.7 (2.4‐5.1) * |
| Compensated cirrhosis, % | 7.12 ± 0.20 | 5.04 ± 0.54 | 11.42 ± 0.66 | 9.1 (6.0‐12.4) * |
| Decompensated cirrhosis, % | 36.97 ± 0.46 | 33.99 ± 1.69 | 39.86 ± 1.19 | 2.2 (0.7‐3.7) * |
| Hepatocellular carcinoma, % | 1.31 ± 0.09 | 0.73 ± 0.25 | 1.76 ± 0.30 | 6.9 (2.8‐11.1) * |
| Liver transplantation, % | 2.14 ± 0.18 | 2.80 ± 0.71 | 2.06 ± 0.33 | −2.6 (−9.2‐4.5) |
| CCI | 3.42 ± 0.02 | 3.04 ± 0.06 | 3.59 ± 0.05 | 1.7 (1.1‐2.4) * |
| Complications, % | ||||
| Ascites | 17.21 ± 0.33 | 15.97 ± 1.21 | 19.49 ± 0.90 | 2.9 (1.1‐4.7) * |
| Hepatic encephalopathy | 13.43 ± 0.32 | 10.00 ± 1.07 | 16.51 ± 0.84 | 4.3 (2.7‐6.0) * |
| Portal hypertension | 15.98 ± 0.34 | 11.65 ± 0.99 | 18.44 ± 0.89 | 5.8 (2.9‐8.9) * |
| Gastroesophageal varices | 13.92 ± 0.3 | 11.35 ± 0.93 | 14.41 ± 0.87 | 3.1 (0.2‐6.0) * |
| Autoimmune disease, % † | 5.26 ± 1.80 | 3.96 ± 0.59 | 5.71 ± 4.69 | 3.5 (2.0‐5.1) * |
Data presented as mean/percentage ± standard error.
Significantly different from 0 (P < 0.05) is indicated in bold.
P < 0.05.
Autoimmune disease included scleroderma and Sjögren’s syndrome.
Table 3.
Characteristics of Hospitals, 2005‐2014
| Characteristic | 2005‐2014 (Weighted) | 2005 (Weighted) | 2014 (Weighted) | APC (95% CI) |
|---|---|---|---|---|
| Hospital region, % | ||||
| Northeast | 20.18 ± 0.60 | 19.58 ± 1.70 | 20.83 ± 0.95 | 1.0 (−0.5‐2.4) |
| Midwest | 25.34 ± 0.61 | 23.62 ± 2.16 | 25.75 ± 1.11 | −0.4 (−2.2‐1.5) |
| South | 32.35 ± 0.59 | 29.66 ± 1.92 | 33.52 ± 1.14 | 0.9 (−0.3‐2.1) |
| West | 22.12 ± 0.60 | 27.14 ± 2.88 | 19.91 ± 0.87 | −1.7 (−3.3‐0.0) * |
| Hospital bed size, % | ||||
| Small | 11.74 ± 0.29 | 10.83 ± 1.04 | 17.47 ± 0.67 | 5.7 (1.7‐9.9) * |
| Medium | 23.26 ± 0.51 | 20.70 ± 2.12 | 26.42 ± 1.04 | 1.8 (−0.2‐3.8) |
| Large | 65.00 ± 0.59 | 68.47 ± 2.26 | 56.11 ± 1.23 | −1.6 (−3.0 to −0.2) * |
| Hopital location/teaching, % | ||||
| Rural | 10.00 ± 0.24 | 11.64 ± 0.99 | 6.97 ± 0.36 | −4.6 (−7.2 to −2.0)* |
| Urban nonteaching | 34.07 ± 0.56 | 42.39 ± 2.37 | 21.29 ± 0.70 | −5.0 (−8.6 to −1.3)* |
| Urban teaching | 55.93 ± 0.64 | 51.63 ± 2.24 | 71.73 ± 0.82 | 4.7 (2.2‐7.3) * |
Data presented as percentage ± standard error.
Significantly different from 0 (P < 0.05) is indicated in bold.
P < 0.05.
The average total charge per discharge adjusted for inflation leveled by 1.7% (95% CI: −0.2%‐3.5%) per year between 2005 and 2014. In contrast, the average LoS decreased from 6.85 days in 2005 to 5.37 days in 2014, at a 2.2% average annual decrease (95% CI: 1.1%‐3.2%) (Table 1). The percentage of elective admissions also decreased (APC: 2.8%; 95% CI: 1.0%‐4.6%). Approximately 76% of patients were discharged to home (routine: 60.6%; home health care: 15.8%), with 16% requiring disposition to skilled nursing or intermediate care facilities. There were no significant annual changes on the percentage of primary payer.
From 2005 to 2014, both the severity of illness and risk of death increased significantly (major or extreme from 55.0% to 66.6% with APC of 1.9% (95% CI: 0.7%‐3.2%) and from 32.3% to 45.2% with APC of 3.7% (95% CI: 2.4%‐5.1%), respectively. Despite that, the in‐hospital mortality rate among PBC discharges decreased annually by 5.4% (95% CI: 2.4%‐8.4%) (Table 1).
When patients with PBC were evaluated based on age, over the study time period, transplantation rates were higher among those younger than 60 years of age, compared with those over the age of 60. However, the transplantation rate among those younger than 60 years of age did not show a statistically significant change (Supporting Table S6).
Among PBC discharges, the percentage of patients with decompensated cirrhosis increased from 34.0% in 2005 to 39.9% in 2014 with APC of 2.2% (95% CI: 0.7%‐3.7%). There was an increase in compensated hepatic cirrhosis from 5.0% to 11.4% with APC of 9.1%. The percentage of those with hepatocellular carcinoma increased from 0.7% to 1.8% with APC of 6.9% (95% CI: 2.8% to 11.1%), whereas the percentage of those with liver transplant remained stable. Overall, the most common complication seen was ascites, which accounted for 17.2%, followed by portal hypertension (16.0%), gastroesophageal varices (13.9%), and hepatic encephalopathy (13.4%) (Table 2).
Finally, there was an increase in the prevalence of ascites (16.0%‐19.5%; APC: 2.9%), portal hypertension (11.7%‐18.4%; APC: 5.8%), gastroesophageal varices (11.4%‐14.4%; APC: 3.1%), hepatic encephalopathy (10.0%‐16.5%; APC: 4.3%), and Sjögren’s syndrome (1.7%‐3.7%; APC: 5.7%) (Table 2).
Independent Predictors of In‐Hospital Mortality
The downward trend for in‐hospital mortality was statistically significant even after adjustment for demographic, clinical, and hospital characteristics (odds ratio [OR]: 0.93; 95% CI: 0.90‐0.95). Age (OR: 1.03; 95% CI: 1.02‐1.03), ascites (OR: 1.77; 95% CI: 1.50‐2.08), hepatic encephalopathy (OR: 2.10; 95% CI: 1.77‐2.49), and CCI (OR: 1.15; 95% CI: 1.11‐1.19) were independently associated with higher in‐hospital mortality (Table 4). Compared with Medicare, Medicaid (OR: 1.49; 95% CI: 1.12‐1.98) and other‐pay payers (OR: 1.48; 95% CI: 1.03‐2.12) were associated with increased risk of in‐hospital mortality.
Table 4.
Predictors of In‐Hospital Mortality, Charge, and LoS, NIS 2005‐2014
| Covariates | In‐Hospital Mortality* | Charge † | LoS ‡ |
|---|---|---|---|
| OR (95% CI) | % Change (95% CI) | IRR (95% CI) | |
| Calendar year | 0.94 (0.92‐0.97) | 3.42 (2.90‐3.95) | 0.97 (0.97‐0.98) |
| Age | 1.04 (1.03‐1.04) | −0.13 (−0.21 to −0.05) | 0.996 (0.996‐0.997) |
| Race | |||
| White | Reference | Reference | Reference |
| Black | 1.44 (1.04‐1.99) | −2.49 (−6.5‐1.69) | 1.07 (1.04‐1.10) |
| Other | 0.91 (0.73‐1.12) | 0.18 (−2.65‐3.08) | 1.09 (1.07‐1.12) |
| Female | 1.00 (0.81‐1.24) | −3.34 (−5.86 to −0.75) | 0.93 (0.91‐0.94) |
| Primary payer | |||
| Medicare | Reference | Reference | Reference |
| Medicaid | 1.59 (1.17‐2.17) | −6.99 (−10.57 to −3.26) | 0.98 (0.96‐1.01) |
| Private | 1.09 (0.88‐1.35) | 5.18 (2.59‐7.83) | 0.94 (0.93‐0.96) |
| Other pay | 1.27 (0.83‐1.94) | −5.47 (−9.96 to −0.76) | 0.93 (0.90‐0.96) |
| Hospital region | |||
| Northeast | Reference | Reference | Reference |
| Midwest | 0.64 (0.49‐0.84) | −9.83 (−14.34 to −5.09) | 0.88 (0.83‐0.92) |
| South | 0.85 (0.68‐1.05) | 3.35 (−1.28‐8.20) | 0.97 (0.92‐1.02) |
| West | 1.05 (0.84‐1.32) | 41.58 (34.28‐9.27) | 0.85 (0.81‐0.90) |
| Hospital bed size | |||
| Small | Reference | Reference | Reference |
| Medium | 1.16 (0.87‐1.55) | 14.40 (9.44‐19.58) | 0.99 (0.96‐1.03) |
| Large | 1.19 (0.92‐1.54) | 23.88 (18.86‐29.11) | 1.11 (1.07‐1.15) |
| Hopital location/teaching | |||
| Rural | Reference | Reference | Reference |
| Urban nonteaching | 1.27 (0.91‐1.78) | 69.22 (61.08‐77.77) | 1.12 (1.07‐1.17) |
| Urban teaching | 1.49 (1.07‐2.07) | 85.94 (77.04‐95.29) | 1.23 (1.17‐1.29) |
| Decompensated cirrhosis | 2.54 (2.14‐3.00) | −6.85 (−8.79 to −4.86) | 1.16 (1.14‐1.17) |
| Hepatocellular carcinoma | 1.72 (1.08‐2.73) | 20.14 (11.19‐29.8) | 0.86 (0.81‐0.90) |
| Autoimmune disease | 0.96 (0.67‐1.39) | −4.33 (−8.40 to −0.07) | 0.93 (0.90‐0.96) |
| CCI > 1 | 1.58 (1.22‐2.06) | 5.16 (2.65‐7.74) | 1.21 (1.19‐1.23) |
| LoS, days | 1.03 (1.03‐1.04) | 10.65 (10.44‐10.86) | NA |
Due to multicollinearity, complications and liver trasnplant were excluded in the models. Inflation‐adjusted charges to 2016 dollars. Bold text denotes P < 0.05.
Analyzed by multilevel logistic regression.
Analyzed by multilevel generalized linear regression with log link function and gamma error distribution.
Analyzed by multilevel generalized Poisson model.
Abbreviations: NA, not applicable; OR, odds ratio; and RR, incidence rate ratio.
Independent Predictors of Total Charge
The upward trend for total charge in PBC discharges was statistically significant after adjustment for demographic, clinical, and hospital characteristics (percent change: 1.75%; 95% CI: 1.18%‐2.33%) (Supporting Table S5). The adjusted total charge was found to be increasing by 22.57% (95% CI: 18.62%‐26.65%) with ascites and 3.69% (95% CI: 3.01%‐4.38%) with CCI. In addition, there were hospital region, size, and location variations in charges; compared with the Northeast, the West (percent change: 28.26%; 95% CI: 20.88%‐36.09%) had higher charges, and the Midwest (percent change: −14.69%; 95% CI: −19.27% to −9.85%) had lower charges. Compared with rural hospitals, urban nonteaching hospitals (percent change: 81.0%; 95% CI: 71.40%‐91.14%) and urban teaching hospitals (percent change: 107.90%; 95% CI: 96.93%‐119.49%) had higher charges (Table 4).
Independent Predictors of LoS
The downward trend for LoS in PBC discharges was statistically significant even after adjustment for demographic, clinical, and hospital characteristics (percent change: −2.33%; 95% CI: −2.79%‐1.86%). The adjusted LoS was found to be increasing by 29.70% (95% CI: 25.66%‐33.87%) with ascites, 4.24% (95% CI: 0.54%‐8.09%) with hepatic encephalopathy, and 3.94% (95% CI: 3.28%‐4.60%) with CCI. There were also hospital region, size, and location variations in the LoS (Table 4).
Comparison of Medicare Patients With PBC: Medicare Versus NIS Database
We compared Medicare patients from the NIS data set with Medicare patients reported previously.25 The Medicare database reports cost per patient, whereas the Medicare‐NIS database reports per discharge. Nevertheless, the data comparison between data obtained from Medicare database analysis and Medicare‐NIS database analysis was identical (Supporting Table S3). This provides validity of the data analysis approach.
Discussion
We used a large inpatient database from the United States to assess resource utilization and mortality of patients with PBC. The data suggest that although the number of PBC‐related discharges has increased in the United States between 2005 and 2014, outcomes such as LoS and in‐hospital mortality have decreased. These positive changes may be attributed to better screening and earlier detection of the disease, which leads to more timely treatment. Furthermore, the availability and widespread use of UDCA might have led to better control of PBC; thus, fewer patients might progress to cirrhosis and liver failure. However, even though the LoS of patients decreased, the total charge per patient remained stable, which can be explained by either an increased number of discharges with PBC diagnosis or progression of disease to the point where it causes a certain level of expenditure even with decreased LoS.
An important finding of our study was the increase in the number of hospitalizations for PBC, from 3.24 per 100,000 in 2005 to 3.68 per 100,000 in 2014. There were 9,768 hospitalizations for PBC in 2005, which increased to almost 12,000 hospitalizations in 2014, a 1.4% annual increase. The annually increasing number may be suggestive of an increasing incidence and prevalence of the disease overall in the United States.26, 27, 28 This is in line with other epidemiological studies that have shown similar findings. As the etiology of PBC is not definitively known, the results of our study may bring into question whether an increase in environmental exposures could be contributing to the greater disease prevalence.29, 30, 31, 32
The increased prevalence may also be secondary to increased survival of patients, either due to improved care or earlier diagnosis. We see from our data that although the severity of illness and risk of death increased significantly, the in‐hospital mortality rate among PBC discharges decreased by 5.4% during the 10‐year period. This finding may suggest a positive trend of better diagnosis, awareness, and in‐hospital management of the disease. In fact, this would also explain another finding of our study. Although the LoS of patients with PBC has been decreasing, the total charges for those individuals remain stable. It can be suggested that once PBC causes severe liver disease and results in cirrhosis and its complications, the health care expenditure associated with that condition remains stable, even with shorter stay, as shown in our study.
An alternative explanation for the increasing number of hospitalizations may be the failure of effective first‐line treatment for patients with PBC.26, 27, 28 In addition to higher prevalence and better detection, there is a possibility that treatment regimens may fail in a number of patients who end up in the inpatient setting with advanced liver disease with PBC. In fact, almost 40% of patients with PBC treated with UDCA fail to achieve optimal response and are at risk for progressive liver disease.10, 11, 33, 34, 35, 36 Our study reveals that the severity of illness as reflected by higher CCI and risk of death for inpatients with PBC increased over the study period. This could indicate that patients with PBC requiring hospitalization may not be managed optimally in the outpatient setting, either because of failure of UDCA or underutilization of this treatment.
As mentioned previously, our analysis of resource utilization resulted in interesting findings. The average LoS decreased from 6.9 days to 5.4 days, consistent with recent efforts to reduce LoS for hospitalized patients. In contrast, the total charges per discharge of patients with PBC remained the same. Another important finding of our study was that Medicare was the primary payer for most of the patients with PBC requiring hospitalization, and the proportion of these patients increased by 12% between 2005 and 2014. These findings are important, given the fact that the prevalence and the number of discharges have been increasing, with sicker patient profiles and higher numbers of diagnoses, requiring higher number of procedures, all of which point toward a higher health care burden. In fact, a recent study among Medicare recipients showed that the resource utilization of patients with PBC has been rising parallel to the increase in disease prevalence, even though mortality rates have remained relatively stable.25 Given that patients diagnosed with PBC are also more likely to have other autoimmune diseases as well, the increasing prevalence and costs of PBC could also preclude an increase in overall economic and social burden from other autoimmune disease. It is also important to note that previous studies have shown that treatment of PBC is cost‐effective.37, 38 In this context, identification of effective treatment of these patients with approved medication regimens may not only reduce mortality and morbidity, but also resource utilization and economic burden of PBC. Nevertheless, more data supporting these issues should be collected in the future.
To assess the accuracy of our analysis, we compared Medicare patients with PBC enrolled in two different databases. The study subjects from the current study were compared with another study of Medicare patients with PBC that was recently published using the Medicare database.25 In this context, 56.7% of PBC discharges in the current study had Medicare as a primary payer. Most of the clinical and demographic parameters in the current study were similar to the previously reported data (Supporting Table S3). This provides validity of both analyses. In contrast, our estimated prevalence rate in the current study was lower than the previous study. There are multiple reasons for this difference, including the differences in study designs as well as statistical analysis.
Multivariable analysis results that indicate predictors of in‐hospital mortality and the total charge for both studies are provided in Supporting Tables S4 and S5. In this context, the calendar year was an independent predictor of total charges. Furthermore, this effect was present with or without adjusting for inflation, suggesting that the burden to health care costs is likely to be even more than reported.25
It is plausible that the increased number of PBC patients discharged from hospitals may be simply a reflection of these patients having well‐controlled liver disease, living longer, with lower liver‐related adverse outcomes, which could have led to hospitalization for unrelated conditions such as cardiovascular disease, diabetes, renal insufficiencies, or cancers. Although this is possible, our study was not able to completely address this issue, which should be the focus of future investigation.
When interpreting these findings, we must acknowledge some inherent limitations of our study. First, we did not have outpatient data, which would add another aspect of the overall burden of PBC to society. Furthermore, we used ICD‐9 coding for the diagnosis of PBC, and it is well known that the accuracy of disease coding carries the utmost importance for the reliability of the data. The prevalence of the disease might be underreported—and rarely overreported—due to coding errors in such data sets. Moreover, unique patient identifiers were not available in the NIS, which led to some patients being counted multiple times in our analysis.
In conclusion, PBC carries a significant and gradually increasing economic and social burden. The disease has become a frequent cause of liver morbidity and need for transplantation. However, as seen in other epidemiological studies, the incidence and prevalence varies greatly among studies and different populations. As more data are available, further research is needed to better delineate the incidence and prevalence of PBC, to fully appreciate its social and economic impact. Continued strategies to diagnose the disease early and treat with effective and approved medications may not only reduce mortality, but also resource utilization of patients with PBC.
Supporting information
Potential conflict of interest: Dr. Younossi consults for Gilead, Bristol‐Myers Squibb, NovoNordisk, Intercept, Viking, and Terns.
References
- 1. Imam MH, Lindor KD. The natural history of primary biliary cirrhosis. Semin Liver Dis 2014;34:329‐333. [DOI] [PubMed] [Google Scholar]
- 2. Selmi C, Bowlus CL, Gershwin ME, Coppel RL. Primary biliary cirrhosis. Lancet 2011;377:1600‐1609. [DOI] [PubMed] [Google Scholar]
- 3. Zhang H, Carbone M, Lleo A, Invernizzi P. Geoepidemiology, genetic and environmental risk factors for PBC. Dig Dis 2015;33(Suppl. 2):94‐101. [DOI] [PubMed] [Google Scholar]
- 4. Prince M, Chetwynd A, Newman W, Metcalf JV, James OFW. Survival and symptom progression in a geographically based cohort of patients with primary biliary cirrhosis: follow‐up for up to 28 years. Gastroenterology 2002;123:1044‐1051. [DOI] [PubMed] [Google Scholar]
- 5. Boonstra K, Kunst AE, Stadhouders PH, Tuynman HA, Poen AC, van Nieuwkerk KMJ, et al. Rising incidence and prevalence of primary biliary cirrhosis: a large population‐based study. Liver Int 2014;34:e31‐e38. [DOI] [PubMed] [Google Scholar]
- 6. Braun S, Berg C, Buck S, Gregor M, Klein R. Catalytic domain of PDC‐E2 contains epitopes recognized by antimitochondrial antibodies in primary biliary cirrhosis. World J Gastroenterol 2010;16:973‐981. [DOI] [PMC free article] [PubMed] [Google Scholar]
- 7. Momah N, Lindor KD. Primary biliary cirrhosis in adults. Expert Rev Gastroenterol Hepatol 2014;8:427‐433. [DOI] [PubMed] [Google Scholar]
- 8. Purohit T, Cappell MS. Primary biliary cirrhosis: pathophysiology, clinical presentation and therapy. World J Hepatol 2015;7:926‐941. [DOI] [PMC free article] [PubMed] [Google Scholar]
- 9. Lazaridis KN, Juran BD, Boe GM, Slusser JP, de Andrade M, Homburger HA, et al. Increased prevalence of antimitochondrial antibodies in first‐degree relatives of patients with primary biliary cirrhosis. Hepatology 2007;46:785‐792. [DOI] [PubMed] [Google Scholar]
- 10. Lindor KD. UDCA, PBC and biochemistry: What does normal mean? Gut 2000;46:8. [DOI] [PMC free article] [PubMed] [Google Scholar]
- 11. Lindor K. Ursodeoxycholic acid for the treatment of primary biliary cirrhosis. N Engl J Med 2007;357:1524‐1529. [DOI] [PubMed] [Google Scholar]
- 12. Angulo P, Batts KP, Therneau TM, Jorgensen RA, Dickson ER, Lindor KD. Long‐term ursodeoxycholic acid delays histological progression in primary biliary cirrhosis. Hepatology 1999;29:644‐647. [DOI] [PubMed] [Google Scholar]
- 13. Ali AH, Lindor KD. Obeticholic acid for the treatment of primary biliary cholangitis. Expert Opin Pharmacother 2016;17:1809‐1815. [DOI] [PubMed] [Google Scholar]
- 14. Jones DEJ. Obeticholic acid for the treatment of primary biliary cirrhosis. Expert Rev Gastroenterol Hepatol 2016;2:1‐9. [DOI] [PubMed] [Google Scholar]
- 15. Rockville M. The healthcare cost and utilization project: an overview. Eff Clin Pract 2002;5:143‐151. [PubMed] [Google Scholar]
- 16. Quan H, Sundararajan V, Halfon P, Fong A, Burnand B, Luthi J‐C, et al. Coding algorithms for defining comorbidities in ICD‐9‐CM and ICD‐10 administrative data. Med Care 2005;43:1130‐1139. [DOI] [PubMed] [Google Scholar]
- 17. National Cancer Institute . Joinpoint Regression Program [computer program]. Version 4.6.0.0. Available at https://surveillance.cancer.gov/joinpoint/; 2018.
- 18. Houchens R, Ross D, Elixhauser A, Jiang J. Nationwide inpatient sample (NIS) redesign final report. HCUP Methods Series Report No. 2014‐04. US Agency for Healthcare Research and Quality; Published February 11, 2014. [Google Scholar]
- 19. Rubin DB. Multiple Imputation for Nonresponse in Surveys. Hoboken, NJ: John Wiley & Sons; 2004. [Google Scholar]
- 20. Sterne JAC, White IR, Carlin JB, Spratt M, Royston P, Kenward MG, et al. Multiple imputation for missing data in epidemiological and clinical research: potential and pitfalls. BMJ 2009;338:b2393. [DOI] [PMC free article] [PubMed] [Google Scholar]
- 21. Powney M, Williamson P, Kirkham J, Kolamunnage‐Dona R. A review of the handling of missing longitudinal outcome data in clinical trials. Trials 2014;15:237. [DOI] [PMC free article] [PubMed] [Google Scholar]
- 22. Little RJ, D’Agostino R, Cohen ML, Dickersin K, Emerson SS, Farrar JT, et al. The prevention and treatment of missing data in clinical trials. N Engl J Med 2012;367:1355‐1360. [DOI] [PMC free article] [PubMed] [Google Scholar]
- 23. Allison PD. Imputation of categorical variables with PROC MI. SUGI 30 2005;113:1‐4. [Google Scholar]
- 24. Berglund P, Heeringa SG. Multiple imputation of missing data using SAS. Cary, NC: SAS Institute; 2014. [Google Scholar]
- 25. Sayiner M, Golabi P, Stepanova M, Younossi I, Nader F, Racila A, et al. Primary biliary cholangitis in Medicare population: the impact on mortality and resource utilization. Hepatology 2019;69:237‐244. [DOI] [PubMed] [Google Scholar]
- 26. James OF, Bhopal R, Howel D, Gray J, Burt AD, Metcalf JV. Primary biliary cirrhosis once rare, now common in the United Kingdom? Hepatology 1999;30:390‐394. [DOI] [PubMed] [Google Scholar]
- 27. Myers RP, Shaheen AAM, Fong A, Burak KW, Wan A, Swain MG, et al. Epidemiology and natural history of primary biliary cirrhosis in a Canadian health region: a population‐based study. Hepatology 2009;50:1884‐1892. [DOI] [PubMed] [Google Scholar]
- 28. Carey EJ, Ali AH, Lindor KD. Primary biliary cirrhosis. Lancet 2015;386:1565‐1575. [DOI] [PubMed] [Google Scholar]
- 29. Marzorati S, Lleo A, Carbone M, Gershwin ME, Invernizzi P. The epigenetics of PBC: the link between genetic susceptibility and environment. Clin Res Hepatol Gastroenterol 2016;40:650‐659. [DOI] [PubMed] [Google Scholar]
- 30. Selmi C, De Santis M, Cavaciocchi F, Gershwin ME. Infectious agents and xenobiotics in the etiology of primary biliary cirrhosis. Dis Markers 2010;29:287‐299. [DOI] [PMC free article] [PubMed] [Google Scholar]
- 31. Smyk D, Rigopoulou EI, Baum H, Burroughs AK, Vergani D, Bogdanos DP. Autoimmunity and environment: Am I at risk? Clin Rev Allergy Immunol 2012;42:199‐212. [DOI] [PubMed] [Google Scholar]
- 32. Selmi C, Gershwin ME. The role of environmental factors in primary biliary cirrhosis. Trends Immunol 2009;30:415‐420. [DOI] [PubMed] [Google Scholar]
- 33. Silveira MG, Lindor KD. Obeticholic acid and budesonide for the treatment of primary biliary cirrhosis. Expert Opin Pharmacother 2014;15:365‐372. [DOI] [PubMed] [Google Scholar]
- 34. Trivedi PJ, Hirschfield GM, Gershwin ME. Obeticholic acid for the treatment of primary biliary cirrhosis. Expert Rev Clin Pharmacol 2016;9:13‐26. [DOI] [PubMed] [Google Scholar]
- 35. Lammert C, Juran BD, Schlicht E, Chan LL, Atkinson EJ, de Andrade M, et al. Biochemical response to ursodeoxycholic acid predicts survival in a North American cohort of primary biliary cirrhosis patients. J Gastroenterol 2014;49:1414‐1420. [DOI] [PMC free article] [PubMed] [Google Scholar]
- 36. Lammers WJ, Hirschfield GM, Corpechot C, Nevens F, Lindor KD, Janssen HLA, et al. Development and validation of a scoring system to predict outcomes of patients with primary biliary cirrhosis receiving ursodeoxycholic acid therapy. Gastroenterology 2015;149:1804‐1812.e4. [DOI] [PubMed] [Google Scholar]
- 37. Boberg KM, Wisløff T, Kjøllesdal KS, Støvring H, Kristiansen IS. Cost and health consequences of treatment of primary biliary cirrhosis with ursodeoxycholic acid. Aliment Pharmacol Ther 2013;38:794‐803. [DOI] [PubMed] [Google Scholar]
- 38. Pasha T, Heathcote J, Gabriel S, Cauch‐Dudek K, Jorgensen R, Therneau T, et al. Cost‐effectiveness of ursodeoxycholic acid therapy in primary biliary cirrhosis. Hepatology 1999;29:21‐26. [DOI] [PubMed] [Google Scholar]
Associated Data
This section collects any data citations, data availability statements, or supplementary materials included in this article.
Supplementary Materials