Abstract
During normal proliferation, hepatocytes accumulate triglycerides (TGs) in lipid droplets (LDs), but the underlying mechanisms and functional significance of this steatosis are unknown. In the current study, we examined the coordinated regulation of cell cycle progression and LD accumulation. As previously shown, hepatocytes develop increased LD content after mitogen stimulation. Cyclin D1, in addition to regulating proliferation, was both necessary and sufficient to promote LD accumulation in response to mitogens. Interestingly, cyclin D1 promotes LD accumulation by inhibiting the breakdown of TGs by lipolysis through a mechanism involving decreased lipophagy, the autophagic degradation of LDs. To examine whether inhibition of lipolysis is important for cell cycle progression, we overexpressed adipose TG lipase (ATGL), a key enzyme involved in TG breakdown. As expected, ATGL reduced LD content but also markedly inhibited hepatocyte proliferation, suggesting that lipolysis regulates a previously uncharacterized cell cycle checkpoint. Consistent with this, in mitogen‐stimulated cells with small interfering RNA‐mediated depletion of cyclin D1 (which inhibits proliferation and stimulates lipolysis), concurrent ATGL knockdown restored progression into S phase. Following partial hepatectomy, a model of robust hepatocyte proliferation in vivo, ATGL overexpression led to decreased LD content, cell cycle inhibition, and marked liver injury, further indicating that down‐regulation of lipolysis is important for normal hepatocyte proliferation. Conclusion: We suggest a new relationship between steatosis and proliferation in hepatocytes: cyclin D1 inhibits lipolysis, resulting in LD accumulation, and suppression of lipolysis is necessary for cell cycle progression.
Short abstract
In this article, we provide evidence that lipid droplet (LD) accumulation in proliferating hepatocytes is regulated by the cell cycle protein cyclin D1, which inhibits LD catabolism via lipophagy. We further find that inducing lipolysis inhibits hepatocyte cell cycle progression. These studies suggest that inhibition of lipolysis necessary for normal hepatocyte proliferation.
Abbreviations
- ADV
adenovirus
- AMPK
adenosine monophosphate–activated protein kinase
- ATGL
adipose triglyceride lipase
- Baf A1
bafilomycin A1
- BODIPY
boron‐dipyrromethene
- cdk
cyclin‐dependent kinase
- CGI‐58
comparative gene identification‐58
- Con
control
- D1
cyclin D1
- DAPI
4′,6‐diamidino‐2‐phenylindole
- DMSO
dimethyl sulfoxide
- EGF
epidermal growth factor
- FBS
fetal bovine serum
- G0S2
G0/G1 switch gene 2
- GFP
green fluorescent protein
- H&E
hematoxylin and eosin
- Hig2
hypoxia‐inducible gene 2
- LAL
lysosomal acid lipase
- LAMP1
lysosomal‐associated membrane protein 1
- LC3
‐microtubule‐associated protein 1 light chain 3 alpha
- LD
lipid droplet
- lns
insulin
- mRNA
messenger RNA
- PBS
phosphate‐buffered saline
- pfu
plaque forming unit
- PH
partial hepatectomy
- PLIN2
perilipin 2
- PPARα
peroxisome proliferator‐activated receptor alpha
- RFP
red fluorescent protein
- ROI
region of interest
- siRNA
small interfering RNA
- TG
triglyceride
Hepatocytes rarely proliferate in healthy liver, but these cells have a remarkable ability to enter the cell cycle in the setting of acute and chronic liver injury. This regenerative response allows the liver to restore adequate hepatocyte mass in response to surgical resection, viruses, toxins, and other injuries. Although the phenomenon of liver regeneration has been extensively studied, many aspects of this complex process are incompletely understood.1, 2
The liver plays a pivotal role in diverse metabolic functions including lipid metabolism. Hepatocytes are equipped with the enzymatic machinery to efficiently perform many lipid‐processing functions, including de novo synthesis, uptake, oxidation, production of ketones and other byproducts, and export. As part of this metabolic flux, excess intracellular lipids are primarily stored in the form of triglyceride (TG) within lipid droplets (LDs) in the cytoplasm. Abnormal LD accumulation in hepatocytes (steatosis or “fatty liver”) occurs in numerous pathologic conditions, including alcoholic liver disease, hepatitis C, and nonalcoholic fatty liver disease (NAFLD). The incidence of NAFLD and its complications, including cirrhosis and hepatocellular carcinoma, is rising rapidly because of the obesity and metabolic syndrome epidemics.3
LDs also transiently accumulate in hepatocytes as part of the normal response during liver regeneration,4, 5 but the biological significance of this is unclear. Numerous dietary and genetic studies have examined whether preexisting fatty liver inhibits liver regeneration in mice; although some of these models exhibit impaired regeneration, the presence of excess steatosis per se does not seem to be inhibitory.4, 6 Conversely, liver regeneration after partial hepatectomy (PH) can proceed normally in models with impaired LD accumulation.4, 7 Thus, the relationship of fatty liver and hepatocyte proliferation is complex, and specific mechanisms linking lipid metabolic processes and the cell cycle are lacking.
Cell proliferation is controlled by protein kinase complexes consisting of cyclins and cyclin‐dependent kinases (cdks). Distinct cyclin/cdk complexes regulate progression through different phases of the cell cycle. In many cells, including hepatocytes, mitogenic signaling pathways induce cyclin D1 during the gap 1 (G1) phase, which complexes with cdk4 to promote passage through the G1 late restriction point, after which cells no longer require mitogens to complete the cell cycle. Prior studies have demonstrated that expression of cyclin D1 alone is sufficient to induce hepatocyte proliferation in the absence of other mitogenic signals.8, 9, 10, 11, 12 In addition to regulating the cell cycle machinery, cyclin D1 has been shown to modulate numerous other cellular processes, including metabolism,13 which may also play an important role in normal and neoplastic cell proliferation.
In this study, we further examined the relationship between lipid metabolism, LDs, and the cell cycle machinery in hepatocytes. We focused on lipolysis, the process of catabolism of TGs stored in LDs, and its regulation by lipophagy. The results demonstrate an unexpected reciprocal regulatory mechanism involving cyclin D1, lipolysis, and cell cycle control.
Materials and Methods
Animals
All animals were housed according to National Institutes of Health (NIH) guidelines. Experiments were carried out under the supervision of the Institutional Animal Care and Use Committee at Minneapolis Veterans Affairs Health Care System. Young male Sprague Dawley rats (225‐250 gm) and 8‐ to 10‐week‐old male Balb/C mice were purchased from Harlan Sprague Dawley and Envigo. Mice were subjected to two thirds PH and adenovirus (ADV) transduction using 5 × 10⁹ plaque forming units (pfu)/animal as described.10 ADV‐adipose TG lipase (ATGL) and ADV‐green fluorescent protein (GFP) (control) were obtained from Vector Biolabs and Welgen, Inc. Mice were injected with the indicated ADVs 1 hour after PH surgery. In the fasting model, 9‐ to 11‐week‐old male Balb/C mice were injected with cyclin D1 or control ADV as described.10 The mice were harvested 24 hours after injection and were fasted for the final 20 hours.
Primary Hepatocytes
Rat hepatocytes were obtained through a two‐step collagenase perfusion method as described, cultured under conditions that promote mitogen‐induced proliferation,8 and harvested 3 days after plating. ADV transduction was performed as described.8, 14 On‐Target plus SMARTpool small interfering RNA (siRNA) directed against rat cyclin D1 (catalog #L‐089285‐02‐0020), rat ATGL (catalog #L‐117200‐00), and matching nonspecific siRNA (catalog #D‐001810‐10‐20) were used at 100 nM along with DharmaFECT4 (catalog #T‐2004‐03) according to the manufacturer’s instructions (Dharmacon, Lafayette, CO). For lipid staining, boron‐dipyrromethene (BODIPY) 558/568 C12 (catalog #D3835; Invitrogen) was added and incubated overnight before fixation.
Cell Culture
AML12 cells were cultured in Dulbecco’s modified Eagle’s medium/F12 supplemented with 10% fetal bovine serum (FBS), 1% insulin‐transferrin‐selenium, 40 ng/mL dexamethasone, and 1% penicillin/streptomycin as described.14, 15 On‐Target plus SMARTpool siRNA directed against mouse cyclin D1 (catalog #L‐042441‐00‐0020), mouse ATGL (catalog #L‐040220‐01), and mouse ATG5 (catalog #L‐064838) were obtained from Dharmacon. Cyclin D1 and ATGL siRNAs were used at a concentration of 10 nM as above. The concentration of Atg5 siRNA was used at 20 nM. Lalistat (catalog #6098; Tocris Bioscience) was dissolved in dimethyl sulfoxide (DMSO) to make a stock solution and used at a final concentration of 10 µM; DMSO was used as a control as indicated. After transfection for 24 hours, fresh media was added and followed by Lalistat treatment. At 48 hours, cells were harvested for different assays. Bafilomycin A1 (Baf A1; catalog #B1793; Sigma) at a final concentration of 100 nM was added to cells 3 hours before harvesting. For lipid staining, AML12 cells were treated with 200 µM oleate sodium in the presence or absence of BODIPY 558/568 C12 overnight before fixation.
ADVs
The ADV vectors for cyclin D1 have been described.14, 15 An ADV expressing GFP was used in control experiments. ADV titers of 10 pfu/cell were used in rat hepatocytes, and 75 pfu/cell was used in AML12 cells.
DNA Synthesis
DNA synthesis was measured using an enzyme‐linked immunosorbent assay bromodeoxyuridine/5‐bromo‐2'‐deoxyuridine (BrdU) labeling kit (catalog #11647229001; Roche Diagnostics, Indianapolis, IN) following the manufacturer’s protocol.
Protein Extraction And Western BLOT
These procedures were performed as described.10, 14 Anti‐cyclin D1 antibody (catalog #04‐221) was obtained from Millipore (Billerica, MA). Anti‐lysosomal‐associated membrane protein 1 (LAMP1; catalog #ab24170), anti‐CDK4 (catalog #ab68266), anti‐abhydrolase domain containing 5 (ABHD5; catalog #ab183739), and anti‐G0/G1 switch gene 2 (G0S2; catalog #ab183465) antibodies were obtained from Abcam. Anti‐microtubule‐associated protein 1 light chain 3 alpha (LC3; catalog #NB100‐2220) and anti‐actin (catalog #NB600‐501) antibodies were purchased from Novus Biologicals. Anti‐ATGL (catalog #2439S), anti‐p‐adenosine monophosphate–activated protein kinase (pAMPK [T172]; catalog #50081S), anti‐Atg5 (catalog #12994), and anti‐AMPK (catalog #2532S) antibodies were purchased from Cell Signaling Technology. Anti‐hypoxia‐inducible gene 2 (Hig2; catalog #sc‐376704) was purchased from Santa Cruz. Anti‐lysosomal acid lipase A (LIPA; catalog #12956‐1‐AP) antibody was obtained from Proteintech. The secondary antibodies IRDye 800CW anti‐rabbit and IRDye 680 anti‐mouse were purchased from LI‐COR Biosciences. The Odyssey imaging system (LI‐COR Biosciences) was used to scan and measure the intensity of bands.
TG Turnover Assays
Experiments measuring lipid incorporation (pulse period) to measure TG turnover were performed as described.16 Seventy‐two hours after plating, cells were pulsed with 500 µM oleate and trace [1‐14C] oleate for 2 hours. A subset of cells was harvested at the end of the pulse period to measure radiolabel incorporation into cellular lipid fractions. Remaining cells were washed with phosphate‐buffered saline (PBS), and fresh media was added for an additional 6 hours (chase period) followed by collection of media and cells for lipid extraction. To account for differential rates of incorporation, a serial dilution of a TG standard was prepared, and pulse TG concentrations were normalized to this standard. Fatty acids oxidized during the chase period are expressed as a percentage of the pulse [14C] TG. Lipids were extracted and separated into different fractions by thin layer chromatography and analyzed as described.16
Cell Staining And Quantification
For immunofluorescence microscopy, cells were grown on coverslips. LC3 staining was performed as described with minor modification.18 Cells were fixed with 4% paraformaldehyde for 15 minutes at room temperature. After fixation, cells were washed with PBS and incubated with 3% bovine serum albumin, 1.5% glycine, and 0.01% saponin in PBS for 45 minutes. The cells were incubated with LC3B antibody (1:200) overnight at 4°C and then incubated with secondary antibody Texas Red goat anti‐rabbit immunoglobulin G (T2767; Invitrogen) for 1 hour at room temperature after PBS washing. For lysosomal staining, cells were incubated with 20 nM Lysotracker Red DND‐99 (Invitrogen) for 30 minutes before fixation. When costaining for LDs, AML12 cells were incubated with LipidTOX Deep Green Neutral Lipid Stain (1 mM; Invitrogen) for 45 minutes at the end of LC3B and lysosomal staining. The slides were then mounted with ProLong Gold antifade Mountant with 4′,6‐diamidino‐2‐phenylindole (DAPI) for visualization. All images were acquired with a Nikon A1 spectral confocal microscope and prepared using ImageJ (NIH). Images from five different fields per well were captured, and experiments were performed in triplicate. Colocalization analysis by Mander’s coefficient was performed using ImageJ and plugin JACoP. For studies using the red fluorescent protein (RFP)‐GFP‐LC3 plasmid, AML12 cells were plated on coverslips in a 24‐well plate. RFP‐GFP‐LC3 plasmids were transfected at 500 ng per well with Lipofectamine 3000 according to the manufacturer’s protocol. The cells were transfected with cyclin D1 siRNA, a combination of cyclin D1 and Atg5, or control siRNA. At 48 hours, cells were fixed and mounted with ProLong Gold antifade Mountant with DAPI for visualization. Microscopy was performed as described.16
RNA Isolation And Real‐Time Polymerase Chain Reaction
RNA isolation and real‐time polymerase chain reaction (RT‐PCR) were performed as described.14 Primer sequences are in Supporting Table S1. RT‐PCR results were normalized to glyceraldehyde 3‐phosphate dehydrogenase (Gapdh).
TG Assay Of Liver
TG assay of the liver was performed using the Triglyceride Quantification Kit from Abcam and following the manufacturer’s instructions.
Histology And Immunostaining
Oil Red O staining was performed on frozen liver sections as described.17 For perilipin 2 (PLIN2) staining, we used a described antibody (a gift from Dr. Charles Najt, University of Minnesota).19 Paraffin‐embedded liver sections were deparaffinized, followed by antigen retrieval with 10 mM sodium citrate buffer with 0.5% Tween 20 for 15 minutes. After permeabilization in a buffer containing 0.2% Triton X‐100 in PBS, the slides were blocked using 5% goat serum for 1 hour at room temperature followed by overnight incubation with primary antibodies at a dilution of 1:100. The following day, slides were washed and incubated with Texas Red goat anti‐rabbit secondary antibodies at 1:500 dilutions for 1 hour at room temperature, followed by washing with PBS, and finally mounted with ProLong Gold antifade Mountant with DAPI. For LC3B staining, frozen sections were fixed in ice‐cold acetone for 10 minutes, permeabilized with 0.1% Triton X‐100 at room temperature for 20 minutes, and blocked in 5% goat serum in PBS. The sections were then incubated overnight at 4°C with DyLight 650‐conjugated LC3B polyclonal antibody (product #PA5‐22937; 1:200). Following three washes in PBS, the slides were mounted with ProLong Gold antifade Mountant with DAPI for visualization.
Statistical Analysis
Data are expressed as mean ± SEM. Statistical analysis was performed using GraphPad Software (GraphPad Software, Inc., La Jolla, CA). Comparisons between two groups were made by Student t test, and differences among selected experimental groups with P ≤ 0.05 were considered significant.
Results
Cyclin D1 Promotes LD Accumulation
In models of liver regeneration in vivo, hepatocytes transiently accumulate LDs during proliferation.4 Similar findings have been observed in cultured primary hepatocytes stimulated by mitogens.20 Interestingly, however, prior studies have shown that epidermal growth factor (EGF)‐mediated hepatocyte proliferation leads to decreased de novo lipogenesis.21 Similarly, in hepatocytes cultured under conditions that promote differentiated function, transduction with cyclin D1 decreased de novo lipogenesis by mechanisms that appear to involve repression of carbohydrate response element binding protein (ChREBP) and hepatocyte nuclear factor 4α (HNF4α).14 Primary rat hepatocytes were cultured under conditions that promote mitogen‐induced proliferation, as shown in Fig. 1. As previously shown,8, 22 ADV‐mediated transduction of cells with cyclin D1 induced cell cycle progression in the absence of growth factor (as measured by DNA synthesis), whereas siRNA‐mediated knockdown of this protein diminished mitogen‐stimulated proliferation (Fig. 1A,B).
Figure 1.
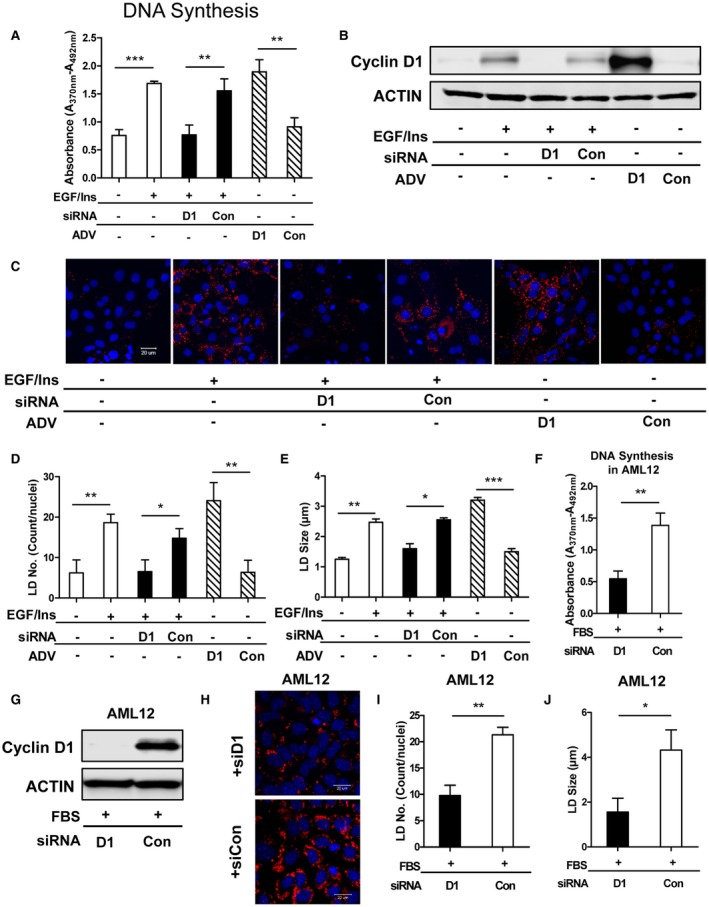
Cyclin D1 regulates lipid droplet accumulation in proliferating hepatocytes. (A‐E) Rat hepatocytes and (F‐J) AML12 cells were cultured as described in Materials and Methods. Proliferation was stimulated in rat hepatocytes with EGF and insulin and in AML12 cells with 10% FBS. Cells were treated with cyclin D1 siRNA or cyclin D1‐expressing ADV as indicated. (A) DNA synthesis as measured by BrdU uptake in rat hepatocytes (n = 5). (B) Representative western blot of cyclin D1. (C) Representative micrographs of LDs stained in hepatocytes with BODIPY. Rat hepatocytes were loaded with C‐12 BODIPY FA (558/568) at a final concentration of 1 µg/mL overnight before harvesting. Nuclei were stained with DAPI. (Scale bar, 20 µm; three independent experiments were performed in B and C.) (D) Hepatocyte LD number and (E) lipid droplet size were analyzed by ImageJ software. Images from five different fields per well were captured, and experiments were performed in triplicate. (F) DNA synthesis in AML12 cells treated with cyclin D1 or control siRNA (n = 5). (G) Cyclin D1 expression in AML12 cells. (H) Representative micrographs of LDs stained with BODIPY in AML12 cells. Cells were loaded overnight with 200 µM oleate. (I,J) Quantification of LD number and size in AML12 cells. Data represent mean ± SEM; *P < 0.05; **P < 0.01; and ***P < 0.001.
As expected, mitogen treatment triggered LD accumulation in hepatocytes20 (Fig. 1C‐E). This was eliminated by cyclin D1 knockdown, whereas cyclin D1 transduction led to increased LDs in the absence of mitogens. We also examined whether cyclin D1 regulated the LD content in the well‐established mouse AML12 hepatocyte line. As previously shown,14 cyclin D1 knockdown led to cell cycle inhibition (Fig. 1F,G). Cyclin D1 depletion also reduced LD content in these cells (Fig. 1H‐J). These studies indicate that cyclin D1 is necessary and sufficient to promote accumulation of LDs in proliferating hepatocytes.
Lipolysis Is Inhibited During Proliferation By Cyclin D1
Because prior studies have found that mitogen treatment and cyclin D1 reduce de novo lipogenesis in hepatocytes,14, 21 we reasoned that LD accumulation during proliferation could result from decreased breakdown of TGs. We therefore examined whether LD catabolism through lipolysis was inhibited by cyclin D1. Using TG turnover as a measure,16 mitogen treatment reduced the rate of lipolysis (compare conditions 1 and 2), and this was reversed by knockdown of cyclin D1 (conditions 2 and 3) (Fig. 2A). Conversely, cyclin D1 expression in mitogen‐deprived cells led to decreased lipolysis (conditions 1 and 4). These data suggest that LD accumulation in proliferating hepatocytes is a result of decreased lipolysis of TGs. Furthermore, the inhibition of lipolysis in mitogen‐stimulated cells is mediated by cyclin D1.
Figure 2.
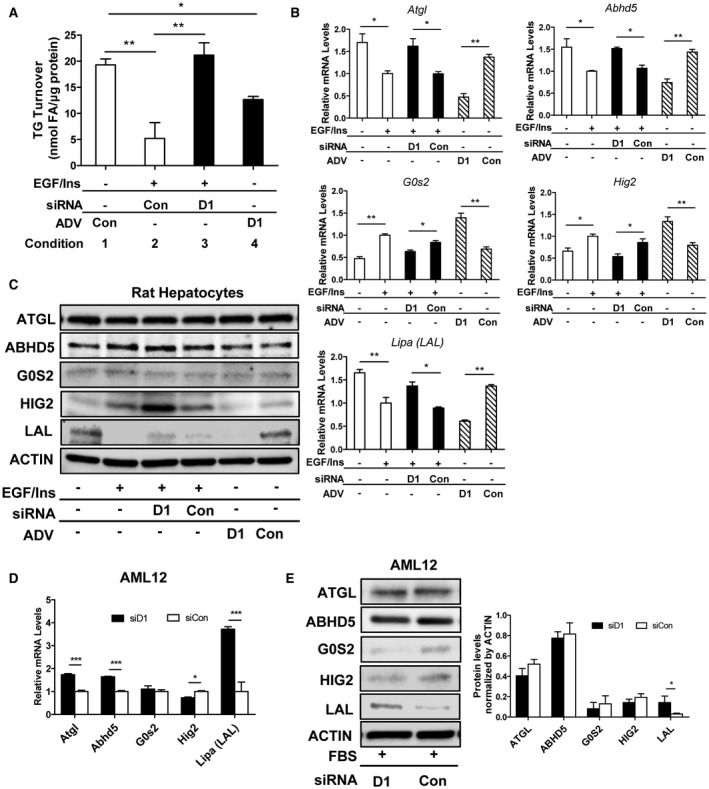
Cyclin D1 inhibits lipolysis and LAL expression. (A‐C) Rat hepatocytes and (D,E) AML12 cells were cultured as in Fig. 1. (A) Lipolysis as measured by TG turnover in rat hepatocytes. (B) Expression of lipolysis‐associated mRNA in rat hepatocytes. (C) Representative western blot of protein expression in rat hepatocytes. (D) mRNA expression in AML12 cells (n = 3). (E) Western blot of AML12 cells. The graph shows the expression of these proteins normalized to actin (n = 3). Data represent mean ± SEM; *P < 0.05; **P < 0.01; and ***P < 0.001. Abbreviations: Abhd5, abhydrolase domain containing 5; FA, fatty acid.
We next examined proteins involved in lipolysis in hepatocytes. The initial step in cytoplasmic LD lipolysis is catalyzed by ATGL, which is recruited to the surface of LDs.23, 24, 25 The factors regulating hepatic ATGL activity are incompletely characterized, but this lipase is activated by binding to comparative gene identification‐58 (CGI‐58; gene name, Abdh5) and inhibited by G0S2.23 At the messenger RNA (mRNA) level, ATGL and CGI‐58 expressions were reduced by mitogen treatment or cyclin D1 transduction, whereas G0S2 was increased (Fig. 2B); the opposite effect occurred with cyclin D1 knockdown. However, at the protein level, ATGL, CGI‐58, and G0S2 were not similarly altered by these treatments, indicating that the expression of these proteins does not parallel that of their respective transcripts (Fig. 2C). The LD protein Hig2 (gene name, Hilpda) has recently been shown to promote hepatocyte LD accumulation by inhibiting lipolysis.26 Knockdown and overexpression studies indicated that cyclin D1 promotes expression of Hig2 mRNA, but the expression of this protein was not regulated in a parallel manner (Fig. 2B,C). Similar findings were observed in AML12 cells treated with cyclin D1 siRNA (Fig. 2D,E). Thus, although cyclin D1 regulates the expression of these mRNA transcripts in a pattern that would be predicted to inhibit lipolysis, we were unable to clearly delineate a similar pattern in the expression of their respective proteins in cell lysates.
We also examined the expression of lysosomal acid lipase (LAL; gene name, Lipa), which catalyzes the hydrolysis of TGs in lysosomes. Both LAL mRNA and protein expression were decreased by mitogen treatment in hepatocytes, and this effect was partially reversed with cyclin D1 knockdown (Fig. 2B,C). Conversely, cyclin D1 expression in mitogen‐deprived cells markedly inhibited LAL expression. Similarly, cyclin D1 depletion also induced LAL in AML12 cells (Fig. 2D,E). These data suggest that cyclin D1 may inhibit lipolysis in hepatocytes in part through repression of LAL.
Evidence That Cyclin D1 Inhibits Lipophagy
An emerging body of literature has highlighted the importance of lipophagy, which uses autophagy mediators to promote lipolysis in the lysosomes and had been considered to be distinct from ATGL‐mediated lipolysis in the cytoplasm.27 However, newer studies have shown significant crosstalk between these two processes and that they are functionally linked.25 For example, a recent paper demonstrated that ATGL triggers lipophagy in hepatocytes and that autophagy regulators are required for ATGL‐mediated lipolysis, indicating that the two processes are interconnected.16 Prior studies in other cell types have found that cyclin D1 can repress autophagy.28, 29 We therefore examined whether cyclin D1 regulates autophagy and lipophagy in AML12 cells. Of note, we have previously shown that cyclin D1 knockdown increases de novo lipogenesis in AML12 cells cultured under these conditions,14 indicating that the decreased abundance of LDs (Fig. 1H‐J) must be due to increased catabolism.
Cyclin D1 knockdown induced the expression of several autophagy‐related genes (Fig. 3A). Furthermore, depletion of cyclin D1 led to increased abundance of Atg5, Lamp1, and LC3B‐II by western blot, consistent with increased autophagic capacity (Fig. 3B). A recent study in other cell types found that cyclin D1 inhibited the activation of AMPK as measured by the western blot of Thr‐172‐phosphorylated AMPK, providing a potential mechanism of autophagy inhibition.29 In contrast, we found that cyclin D1 knockdown moderately decreased the abundance of the activated (Thr‐172) AMPK, suggesting that its regulation (and link to autophagy) is distinct in hepatocytes (Supporting Fig. S1). We transfected AML12 cells with an RFP‐GFP‐LC3 plasmid encoding the tandem GFP and acid‐resistant RFP‐LC3 sensor that contains an acid‐labile GFP and acid‐resistant RFP (Fig. 3C).16 Cyclin D1 knockdown significantly increased the appearance of autophagosomes (RFP‐ and GFP‐positive punctae) and autolysosomes (RFP‐positive punctae) per cell, suggesting substantially increased autophagy induction. To further examine the role of autophagy, we treated AML12 cells with siRNA to the critical autophagy mediator Atg5, which diminished LC3II‐B induction caused by cyclin D1 knockdown (Fig. 3B). In addition, Atg5 depletion reduced autophagy induction in the absence of cyclin D1 as determined by the RFP‐GFP‐LC3 sensor (Fig. 3C). These studies suggest that cyclin D1 diminishes autophagosome formation in AML12 cells through mechanisms that remain to be determined.
Figure 3.
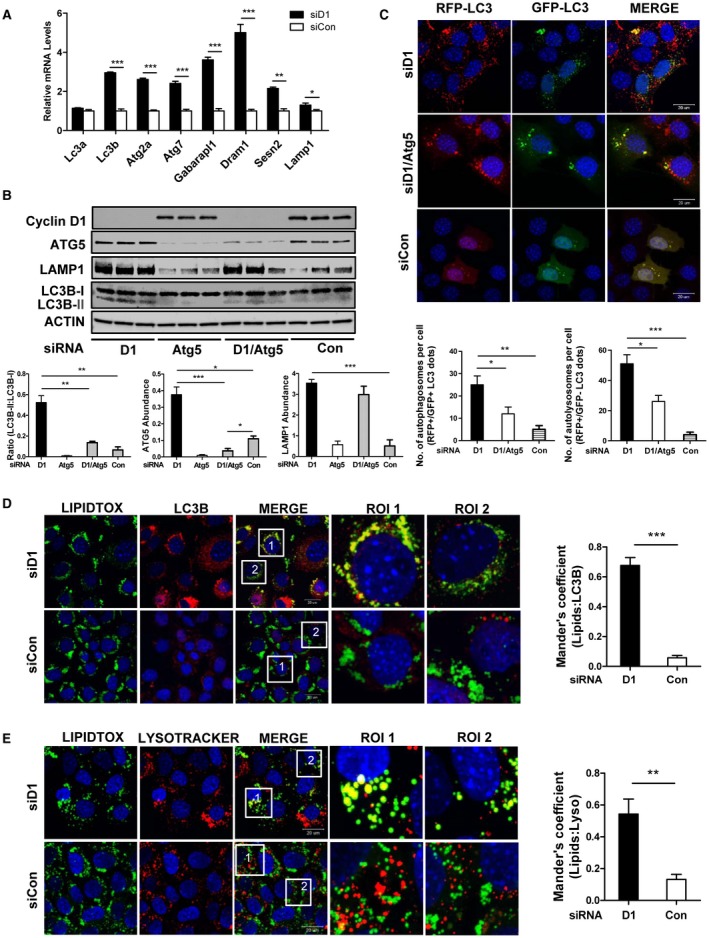
Regulation of autophagy and lipophagy by cyclin D1. AML12 cells were treated with the indicated siRNA. (A) Expression of autophagy‐related mRNA transcripts (n = 3). (B) The effect of cyclin D1 and Atg5 knockdown on the LC3B‐II/LC3B‐I ratio and Lamp1 protein expression. The graphs show normalized expression of these proteins (n = 3). (C) Representative confocal images of AML12 cells transfected with the dual reporter RFP‐GFP‐LC3 to assess autophagic flux. Cells were treated with cyclin D1 siRNA, alone or with Atg5 siRNA. Cyclin D1 siRNA increased autophagy as monitored by the number of RFP/GFP‐positive (yellow) punctae and RFP‐positive/GFP‐negative (red) punctae, and this was partially inhibited by concurrent Atg5 knockdown. The graph shows the number of autophagosomes (yellow punctae) and autolysosomes (red punctae) per cell as determined by ImageJ software (n = 20 cells). (D) Colocalization of LDs (green) with LC3B (red). Two different ROIs are enlarged as shown. Depletion of cyclin D1 markedly enhanced LC3B colocalization with LDs (n = 3 independent studies). (E) Colocalization of LDs (Lipidtox, which stains green) with lysosomes (Lysotracker, which stains red). Two different ROIs are enlarged as shown. Cyclin D1 knockdown increased lysosomal colocalization with LDs (n = 3 independent studies). Data represent mean ± SEM; *P < 0.05; **P < 0.01; and ***P < 0.001. Abbreviations: Dram1, DNA damage regulated autophagy modulator 1; Gabarapl1, gamma‐aminobutyric acid receptor‐associated protein‐like 1; Sesn2, sestrin 2.
To evaluate whether cyclin D1 represses lipophagy, we first examined the association of LDs with LC3B and lysosomes. The colocalization of LC3B with LDs was significantly increased by cyclin D1 knockdown (Fig. 3E). Similarly, there was substantially more colocalization of lysosomes to LDs with cyclin D1 siRNA (Fig. 3F). These studies provide morphologic evidence that cyclin D1 represses lipophagy.
We then examined whether autophagy inhibition through Atg5 depletion affected LD content in AML12 cells (Fig. 4A‐C). Atg5 siRNA had little effect on LD content in mitogen‐treated cells, presumably because the cyclin D1 expression in these cells suppresses lipophagy. However, when cyclin D1 was knocked down, Atg5 depletion markedly induced LD content. These data support the concept that cyclin D1 represses lipolysis and autophagy in proliferating hepatocytes and that cyclin D1 knockdown triggers LD catabolism by increased lipophagy.
Figure 4.
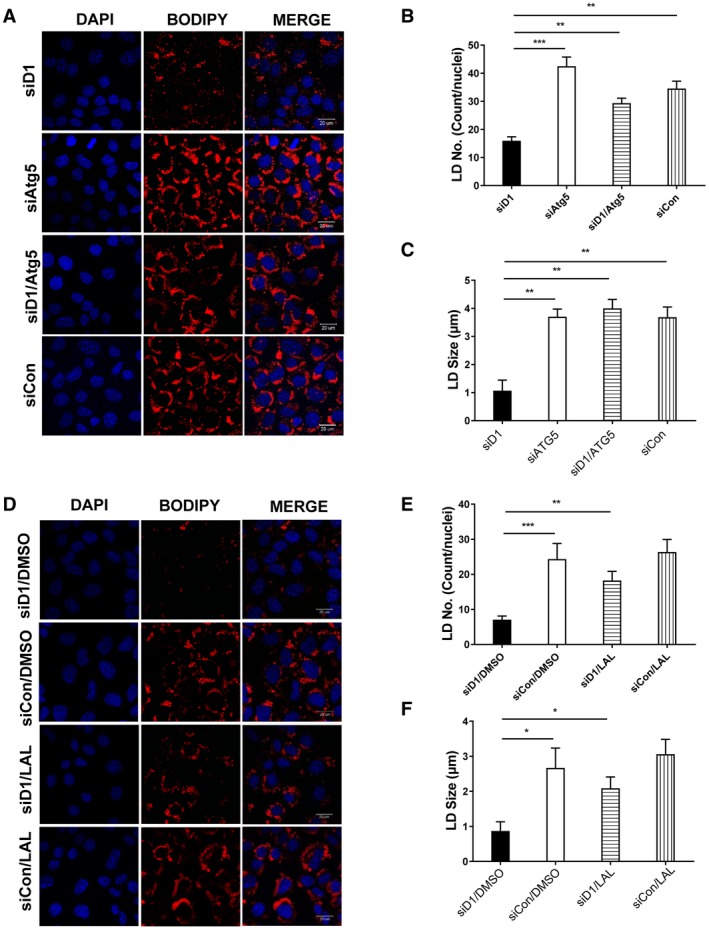
Atg5 and lysosomal lipolysis are required to promote LD catabolism in the setting of cyclin D1 knockdown. (A) Representative confocal images of LDs in AML12 cells treated with siRNA directed against cyclin D1, Atg5, or both. (B,C) Quantification of the number and size of LDs (n = 3) in groups as indicated in (A). Agt5 siRNA blocked LD depletion in response to cyclin D1 knockdown. (D) Representative confocal images of LDs in AML12 cells treated with an LAL inhibitor (LAListat) or vehicle and siRNA as indicated. (E,F) Quantification of the number and size of LDs (n = 3) in groups as indicated in (D). LAListat led to increased LD accumulation in the setting of cyclin D1 knockdown but not in control cells. Data represent mean ± SEM; *P < 0.05; **P < 0.01; and ***P < 0.001.
The lysosomal lipase responsible for TG breakdown during the process of lipophagy is LAL.24 Cyclin D1 knockdown increases the expression of LAL mRNA and protein (Fig. 2). The expression of LAL is induced by several transcription factors, including peroxisome proliferator‐activated receptor alpha (PPARα)24 which we have shown to be repressed by cyclin D1.22 To further examine whether lipophagy plays a role in the regulation of LD accumulation by cyclin D1, we used the LAL inhibitor LAListat, which suppresses lipophagic TG breakdown in hepatocytes.16 LAListat markedly reduced the loss of LDs in AML12 cells resulting from cyclin D1 knockdown (Fig. 4E,F). To further examine the role of lysosomal lipid degradation, we treated cells with bafilomycin A1 (Baf A1), which inhibits lysosomal function by blocking the vacuolar H+ adenosine triphosphatase proton pump and can prevent the fusion of autophagosomes and lysosomes. We found that Baf A1 also prevented the loss of LDs caused by cyclin D1 siRNA (Supporting Fig. S2), further suggesting a key role of lipophagy in this process. Of note, LAListat and Baf A1 induced LD accumulation in cells with cyclin D1 depletion but not in control cells. This supports the concept that in proliferating cells with cyclin D1 expression, lipophagy and lysosomal lipolysis are suppressed and thus Baf A1 has no effect. In the setting of cyclin D1 knockdown, on the other hand, these processes are induced, leading to decreased LD content, which can be reversed by Baf Al treatment.
Cyclin D1 Promotes Ld Accumulation And Diminishes Lipolysis And Autophagy In The Liver
To examine the regulation of LD content and lipophagy by cyclin D1 in vivo, we fasted mice, which strongly induces lipolysis, autophagy, and lipophagy in hepatocytes.18, 24, 30 Mice were transduced with ADV‐cyclin D1 (or a control vector) for 24 hours prior to harvest, and the mice were fasted for the final 20 hours (Fig. 5). We have shown that cyclin D1 transduction for 1 day potently induces hepatocyte replication and regulates the expression of genes involved in numerous metabolic processes.10, 31 Cyclin D1 increased the number of LDs on hematoxylin and eosin (H&E) staining and the number of positive nuclei in Ki‐67 immunostaining, indicating hepatocyte proliferation (Fig. 5A). Oil Red O staining was increased by cyclin D1, as were liver TG levels (Fig. 5B,C), indicating increased steatosis. Cyclin D1 also repressed the expression of autophagy‐related transcripts in fasting liver (Fig. 5D) as well as lipolysis and PPARα‐mediated fatty acid oxidation genes as we have previously shown.22 (Fig. 5E) Consistent with our finding that it represses de novo lipogenesis in hepatocytes,14 cyclin D1 diminished the expression of lipogenic transcripts pyruvate kinase L/R (Pklr) and fatty acid synthase (Fasn); this supports the concept that enhanced lipid synthesis was not responsible for the increased TG accumulation. Cyclin D1 also reduced the expression of Lamp1, LC3B‐II, Atgl, and LAL proteins, consistent with decreased autophagy and lipolysis (Fig. 5F). Immunofluorescence of PLIN 2, which stains the periphery of LDs, also documented the accumulation of LDs induced by cyclin D1 (Fig. 5G). LC3B immunostaining indicated that cyclin D1 markedly reduced the number of LC3B‐positive punctae in fasting liver, suggesting reduced autophagy (Fig. 5H). These studies support the concept that cyclin D1 represses hepatocyte lipolysis and autophagy in vivo under conditions that normally stimulate these processes.
Figure 5.
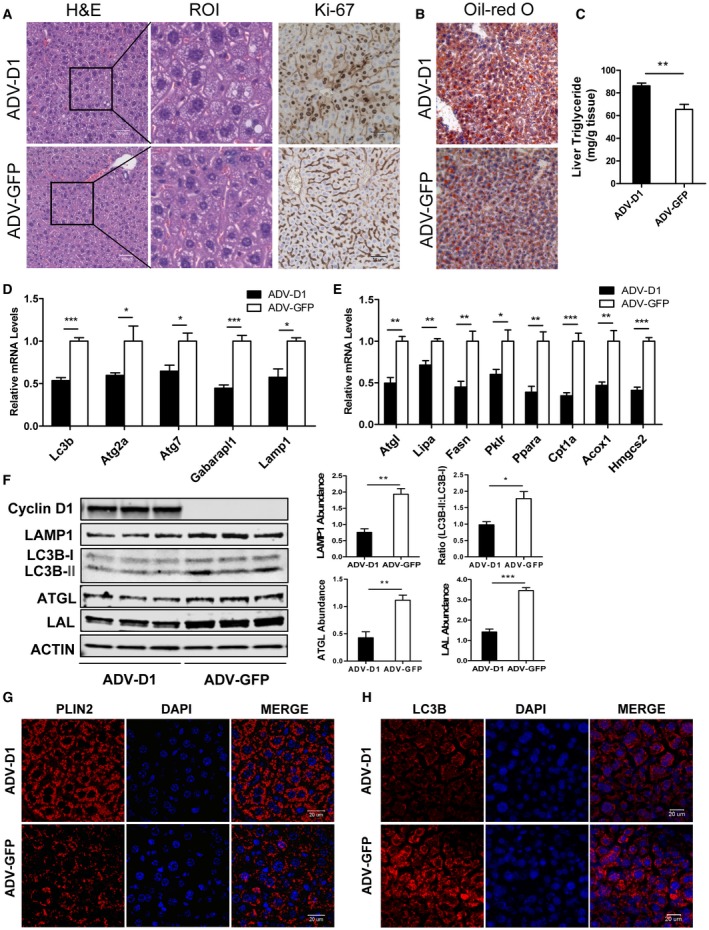
Cyclin D1 promotes LD accumulation and decreases autophagy induced by fasting in mice. BALB/c mice were transduced with a control or cyclin D1‐expressing ADV for 24 hours before harvest. They were fasted for the final 20 hours before harvest (n = 6 per group). (A) H&E staining and Ki‐67 immunohistochemistry of livers excised from two groups of mice. The ROIs are enlarged as shown. Mice expressing cyclin D1 had numerous Ki‐67‐positive hepatocyte nuclei (there is nonspecific staining in the sinusoids), whereas none were seen with the control vector. Scale bars, 50 µm. (B) Oil Red O staining in fasted mice injected with ADV‐D1 or ADV‐GFP. Cyclin D1‐transduced mice had increased LD staining with Oil Red O. (C) Hepatic triglycerides of these two groups were measured as described in Materials and Methods. (D) Expression of autophagy‐related mRNA transcripts in livers from the two groups of mice. (E) mRNA expression of lipolysis, lipogenesis, and fatty acid oxidation genes. (F) Expression of autophagy and lipolysis‐related proteins by western blot. The graphs show normalized expression of these proteins (n = 3). (G) Immunostaining of PLIN2 in liver sections. (H) Immunostaining of LC3B. Cyclin D1 induced LD accumulation (as delineated by PLIN2 staining) but reduced LC3B punctae, further indicating impaired autophagy. Data represent mean ± SEM; *P < 0.05; **P < 0.01; and ***P < 0.001. Abbreviations: Acox1, acyl‐coenzyme A oxidase 1; Cpt1α, carnitine palmitoyltransferase 1α; Fasn, fatty acid synthase; Gabarapl1, gamma‐aminobutyric acid receptor‐associated protein‐like 1; Hmgcs2, 3‐hydroxy‐3‐methylglutaryl‐coenzyme A synthase 2; Pklr, pyruvate kinase L/R.
ATGL, A Key Mediatory Of Lipolysis, Inhibits Hepatocyte Proliferation
The above data suggest that decreased lipolysis and increased LD accumulation are part of the normal proliferative program downstream of mitogens and cyclin D1 in hepatocytes. We wondered whether decreased lipolysis was required for normal cell cycle progression. Studies have shown that overexpression of ATGL is sufficient to trigger lipolysis and decreased lipid content in hepatocytes.16, 32 As expected, transduction with an ADV vector encoding ATGL (ADV‐ATGL) led to decreased LD content in mitogen‐stimulated hepatocytes (Supporting Fig. S3). Unexpectedly, ATGL transduction also led to decreased mitogen‐stimulated proliferation in hepatocytes (Fig. 6A). ATGL repressed the expression of cyclin D1 mRNA but not cyclin D1 protein (Fig. 6B,C). ATGL reduced the expression of cyclin D1’s main kinase partner, cdk4, suggesting a potential mechanism of cell cycle inhibition. Similarly, ATGL overexpression inhibited proliferation in AML12 cells and decreased the expression of cdk4 (Fig. 6D,E). These data indicate that ATGL, presumably by inducing lipolysis, controls a previously uncharacterized late G1 phase cell cycle checkpoint.
Figure 6.
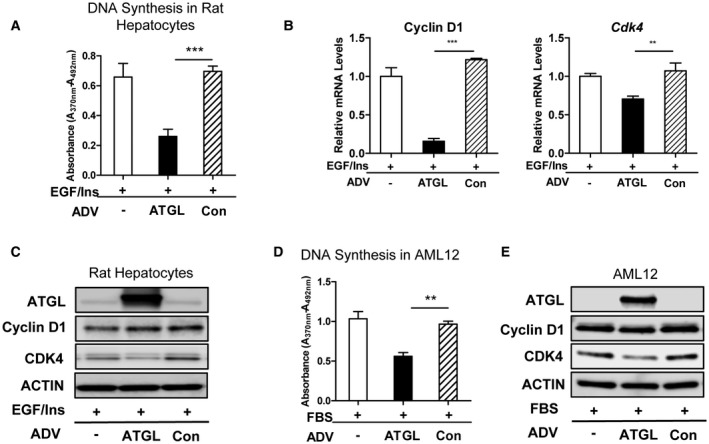
ATGL overexpression inhibits hepatocyte proliferation. (A‐C) Rat hepatocytes and (D,E) AML12 cells were cultured as in Fig. 1 and transduced with an ATGL‐expressing or control ADV. (A) DNA synthesis in rat hepatocytes. (B) mRNA expression of cyclin D1 and cdk4. (C) Western blot of rat hepatocytes. (D) DNA synthesis in AML12 cells. (E) Western blot of AML12 cells. Three independent experiments were performed, and representative blots are shown. Data represent mean ± SEM; **P < 0.01; and ***P < 0.001.
We then examined the effect of ATGL knockdown on cell cycle progression. In the absence of mitogens, ATGL siRNA did not affect DNA synthesis in hepatocytes (data not shown). In mitogen‐stimulated hepatocytes, ATGL knockdown mildly induced DNA synthesis (Fig. 7A,B). As shown above, cyclin D1 knockdown decreases DNA synthesis in hepatocytes. Interestingly, concurrent knockdown of ATGL along with cyclin D1 restored DNA synthesis. Similar findings were also observed in AML12 cells (Fig. 7C,D). These data further suggest that ATGL regulates a previously uncharacterized late G1 cell cycle checkpoint in hepatocytes.
Figure 7.
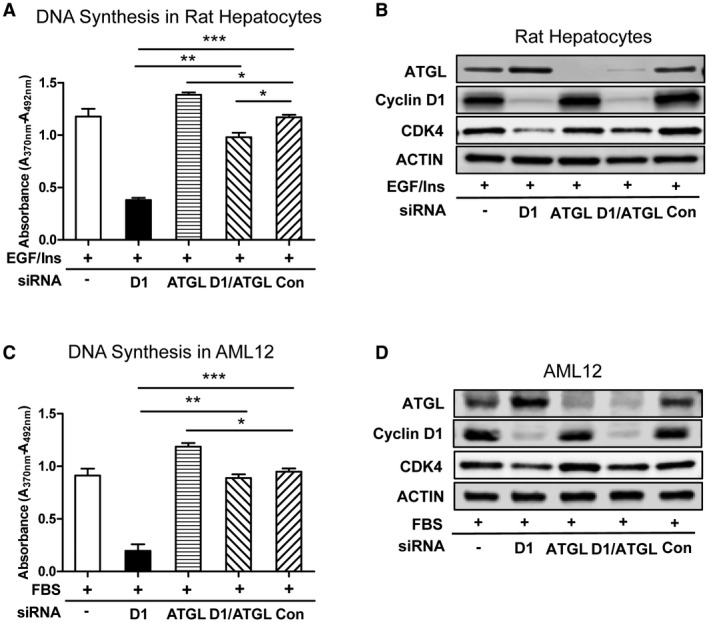
Knockdown of ATGL reverses the inhibition of DNA synthesis in the setting of cyclin D1 depletion. Rat hepatocytes and AML12 cells were transfected with siRNA directed against cyclin D1, ATGL, or both. (A) DNA synthesis in rat hepatocytes. (B) Western blot of rat hepatocytes. (C) DNA synthesis in AML12 cells. (D) Western blot of AML12 cells. Three independent experiments were performed, and representative blots are shown. Data represent mean ± SEM; *P < 0.05; **P < 0.01; and ***P < 0.001.
ATGL Inhibits Hepatocyte Proliferation And Triggers Injury In Regenerating Liver
The most commonly used model of liver regeneration is that of two thirds PH in rodents.1, 2 Following PH in mice, the majority of the remaining hepatocytes enter the cell cycle in a relatively synchronous fashion, and liver mass is restored within 1 to 2 weeks. To determine whether ATGL inhibited hepatocyte cell cycle progression in vivo, we performed PH and harvested livers 42 hours later, a time point that shows robust proliferation after this procedure. One hour after the procedure, mice were injected with a control ADV or ADV‐ATGL. Interestingly, increased early mortality was noted in the animals that were transduced with ATGL (Supporting Fig. S4). As expected, histologic examination of livers after PH with control ADV injection showed substantial hepatocyte Ki‐67 staining, mitoses, and LD accumulation (Fig. 8A,B). In contrast, livers from mice subjected to PH with ATGL transduction showed no steatosis and had large areas of confluent necrosis; Ki‐67 staining of intact‐appearing hepatocytes was minimal. Terminal deoxynucleotidyl transferase–mediated deoxyuridine triphosphate nick‐end labeling staining of the sections did not show increased staining in the PH‐ATGL group, suggesting that apoptosis was not the mechanism of cell death (data not shown). Western blot of liver lysates showed decreased expression of cyclin D1 and cdk1 (Fig. 8C), further suggesting cell cycle inhibition by ATGL. These data demonstrate that ATGL expression in the regenerating liver leads to a profound inhibition of proliferation and marked liver injury, supporting the hypothesis that down‐regulation of lipolysis is important for normal hepatocyte cell cycle progression in vivo.
Figure 8.
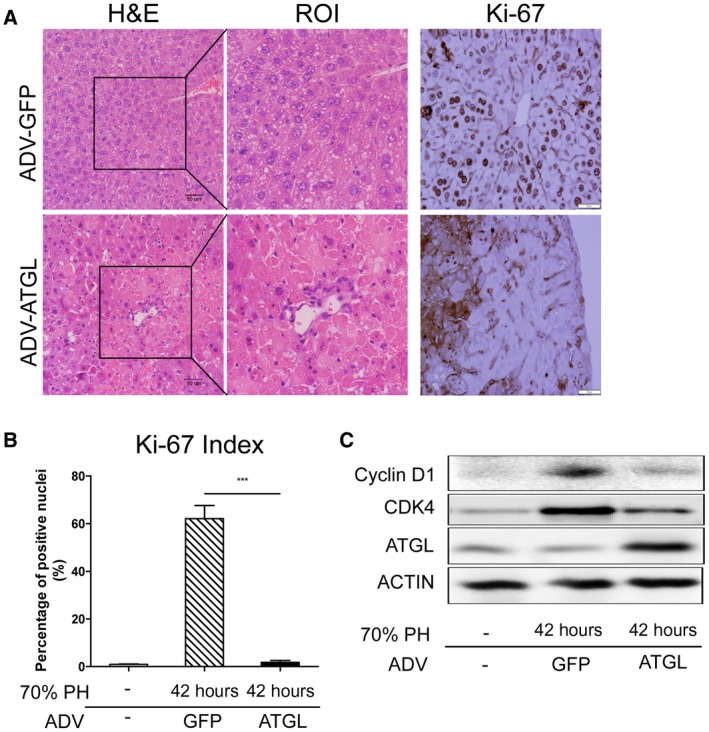
ATGL overexpression inhibits hepatocyte proliferation and promotes injury in regenerating liver. Mice were transduced with a control or ATGL‐expressing ADV and then underwent two thirds PH (n = 6 per group). Livers were harvested 42 hours after resection. (A) Liver histology and Ki‐67 immunohistochemistry after PH. The ROIs are enlarged as shown. ATGL transduction led to areas of necrosis and a marked decrease in Ki‐67 staining of viable hepatocytes. Areas of necrosis showed increased nonspecific staining. Scale bars, 50 µm. (B) Quantification of the number of intact‐appearing hepatocytes expressing Ki‐67. (C) Representative western blot of liver lysates at the indicated time points. Data represent mean ± SEM; ***P < 0.001.
Discussion
The results of this study present several new insights into the relationship between hepatocyte proliferation and LD metabolism in hepatocytes. First, cyclin D1, a key mediator of cell cycle progression in hepatocytes, is both necessary and sufficient to promote LD accumulation in response to mitogens. These results define another unexpected metabolic function that this cell cycle protein plays during hepatocyte proliferation. Second, mitogenic stimulation inhibits LD catabolism in hepatocytes, and this effect is mediated by cyclin D1. Combined with prior studies indicating that mitogens and cyclin D1 inhibit de novo lipogenesis,14, 20 these results suggest that the steatosis that occurs with hepatocyte proliferation is a result of decreased LD catabolism. Third, cyclin D1 appears to regulate LD breakdown by inhibiting lipophagy. Finally, triggering lipolysis by overexpression of ATGL inhibits hepatocyte cell cycle progression through a previously undefined late G1 phase checkpoint. Our findings suggest that decreased lipolysis is critical for normal hepatocyte proliferation.
Prior studies have indicated that cyclin D1 regulates several aspects of metabolism in hepatocytes. Transient expression of cyclin D1 in the liver led to marked alterations in the expression of genes involved in diverse metabolic processes.31 In male mice, hepatic expression of cyclin D1 promoted changes in sex steroid metabolism enzymes, leading to increased estrogen and decreased androgen levels.15 Cyclin D1 inhibited de novo lipogenesis in hepatocytes by reduced ChREBP and HNF4α activity.14 Cyclin D1 also repressed fatty acid oxidation and PPARα activity.22 Furthermore, cyclin D1 repressed hepatic gluconeogenesis, possibly through inhibition of the PPARγ coactivator‐1α (Pgc‐1α).33, 34 Thus, in addition to being a key mediator of hepatocyte proliferation,1, 2, 8, 9, 10, 11, 12 cyclin D1 regulates numerous aspects of hepatic metabolism.
The data shown here demonstrate that mitogenic stimuli reduce lipolysis in hepatocytes and that cyclin D1 is a pivotal mediator of this response. To further explore potential mechanisms, we examined the expression of several key mediators of cytoplasmic lipolysis, including ATGL, CGI‐58, G0S2, and Hig2. Cyclin D1 regulated the mRNA of each of these genes (in a pattern that would predict decreased lipolysis), but we did not observe a similar change in the expression of their respective proteins. The regulation of ATGL activity, which catalyzes a key initial step in cytoplasmic lipolysis, is complex and incompletely understood but appears to involve several factors, including phosphorylation, binding to associated regulator proteins, and intracellular trafficking.23, 24, 25 Further study will be required to determine whether cyclin D1 regulates ATGL activity through one of these mechanisms.
It is now recognized that LD catabolism in hepatocytes is also regulated by degradation through autophagic mechanisms (lipophagy), which recently has been mechanistically linked to ATGL.16, 25 We found that cyclin D1 inhibited autophagy in hepatic cells, as has been shown in other cell types.28, 29 Our studies also provide novel evidence that cyclin D1 inhibits lipophagy and LAL‐mediated lipolysis and that this is likely to be a key mechanism by which cyclin D1 promotes LD accumulation. In fasting mice, cyclin D1 induced hepatocyte steatosis and evidence of decreased lipolysis and autophagy, suggesting that these mechanisms also occur in vivo. In contrast to a recent study,29 we found that cyclin D1 did not appear to inhibit AMPK activation, indicating that a different mechanism of autophagy regulation occurs in hepatocytes. Dissecting the mechanistic links between cyclin D1 and lipophagy may provide insight into the regulation of LD accumulation in liver regeneration and fatty liver.
We unexpectedly found that ATGL inhibits hepatocyte proliferation, suggesting that down‐regulation of lipolysis may be required for normal cell cycle progression. In cultured rat hepatocytes and AML12 cells, overexpression of ATGL (which reduced LD content) markedly inhibited proliferation. Furthermore, in the presence of cyclin D1 knockdown, which inhibits mitogen‐induced hepatocyte and AML12 cell proliferation,14, 22 concurrent ATGL depletion restored DNA synthesis. In the regenerating liver after PH, ATGL transduction prevented LD accumulation (as expected), markedly inhibited hepatocyte proliferation, and led to significant necrosis within the liver. These studies indicate that the induction of ATGL‐mediated lipolysis regulates a previously uncharacterized late G1 phase cell cycle checkpoint.
The studies outlined here have not determined the mechanism(s) by which ATGL regulates proliferation. We speculate the products of lipolysis, which are known to regulate signaling pathways involved in hepatocyte metabolism, may regulate cell cycle mediators. We did find that ATGL reduced the expression of cdk4, although further studies are necessary to elucidate the mechanistic links between lipolysis and the cell cycle machinery. Interestingly, prior studies have suggested that proteins that promote lipolysis, such as ATGL and CGI‐58, may act as tumor suppressor proteins through unknown mechanisms.24 Recent studies have also begun to elucidate distinct lipid‐mediated cell cycle checkpoints in other systems,35, 36 and thus new interactions between lipid metabolism and cell proliferation are likely to be clarified by ongoing work.
In conclusion, our studies demonstrate that LD breakdown is inhibited by cyclin D1 during hepatocyte proliferation and that this is required for normal cell cycle progression. Thus, the need to repress lipolysis, rather than the accumulation of LDs per se, may be the important link between steatosis and liver regeneration.
Supporting information
FigS1
FigS2
FigS3
FigS4
Acknowledgment
We thank Megan Olander for excellent technical assistance.
Supported by the National Institutes of Health (R01DK54921 to J.H.A. and R01DK114401 and R01DK108790 to D.G.M.).
[Corrections made on 8 February, 2019 to the institution affiliations for Douglas G. Mashek and Mara T. Mashek.]
Potential conflict of interest: Nothing to report.
References
- 1. Michalopoulos GK. Liver regeneration. J Cell Physiol 2007;213:286‐300. [DOI] [PMC free article] [PubMed] [Google Scholar]
- 2. Michalopoulos GK. Principles of liver regeneration and growth homeostasis. Compr Physiol 2013;3:485‐513. [DOI] [PubMed] [Google Scholar]
- 3. Diehl AM, Day C. Cause, pathogenesis, and treatment of nonalcoholic steatohepatitis. N Engl J Med 2017;377:2063‐2072. [DOI] [PubMed] [Google Scholar]
- 4. Rudnick DA, Davidson NO. Functional relationships between lipid metabolism and liver regeneration. Int J Hepatol 2012;2012:549241. [DOI] [PMC free article] [PubMed] [Google Scholar]
- 5. Zou Y, Bao Q, Kumar S, Hu M, Wang G‐Y, Dai G. Four waves of hepatocyte proliferation linked with three waves of hepatic fat accumulation during partial hepatectomy‐induced liver regeneration. PLoS One 2012;7:e30675. [DOI] [PMC free article] [PubMed] [Google Scholar]
- 6. Sydor S, Gu Y, Schlattjan M, Bechmann LP, Rauen U, Best J, et al. Steatosis does not impair liver regeneration after partial hepatectomy. Lab Invest 2013;93:20‐30. [DOI] [PubMed] [Google Scholar]
- 7. Newberry EP, Kennedy SM, Xie Y, Luo J, Stanley SE, Semenkovich CF, et al. Altered hepatic triglyceride content after partial hepatectomy without impaired liver regeneration in multiple murine genetic models. Hepatology 2008;48:1097‐1105. [DOI] [PMC free article] [PubMed] [Google Scholar]
- 8. Albrecht JH, Hansen LK. Cyclin D1 promotes mitogen‐independent cell cycle progression in hepatocytes. Cell Growth Differ 1999;10:397‐404. [PubMed] [Google Scholar]
- 9. Hansen LK, Albrecht JH. Regulation of the hepatocyte cell cycle by type I collagen matrix: role of cyclin D1. J Cell Sci 1999;112:2971‐2981. [DOI] [PubMed] [Google Scholar]
- 10. Nelsen CJ, Rickheim DG, Timchenko NA, Stanley MW, Albrecht JH. Transient expression of cyclin D1 is sufficient to promote hepatocyte replication and liver growth in vivo. Cancer Res 2001;61:8564‐8568. [PubMed] [Google Scholar]
- 11. Nelsen CJ, Rickheim DG, Tucker MM, Hansen LK, Albrecht JH. Evidence that cyclin D1 mediates both growth and proliferation downstream of TOR in hepatocytes. J Biol Chem 2003;278:3656‐3663. [DOI] [PubMed] [Google Scholar]
- 12. Nelsen CJ, Rickheim DG, Tucker MM, McKenzie TJ, Hansen LK, Pestell RG, et al. Amino acids regulate hepatocyte proliferation through modulation of cyclin D1 expression. J Biol Chem 2003;278:25853‐25858. [DOI] [PubMed] [Google Scholar]
- 13. Hydbring P, Malumbres M, Sicinski P. Non‐canonical functions of cell cycle cyclins and cyclin‐dependent kinases. Nat Rev Mol Cell Biol 2016;17:280‐292. [DOI] [PMC free article] [PubMed] [Google Scholar]
- 14. Hanse EA, Mashek DG, Becker JR, Solmonson AD, Mullany LK, Mashek MT, et al. Cyclin D1 inhibits hepatic lipogenesis via repression of carbohydrate response element binding protein and hepatocyte nuclear factor 4a. Cell Cycle 2012;11:2681‐2690. [DOI] [PMC free article] [PubMed] [Google Scholar]
- 15. Mullany LK, Hanse EA, Romano A, Blomquist CH, Mason JI, Delvoux B, et al. Cyclin D1 regulates hepatic estrogen and androgen metabolism. Am J Physiol Gastrointest Liver Physiol 2010;298:G884‐G895. [DOI] [PMC free article] [PubMed] [Google Scholar]
- 16. Sathyanarayan A, Mashek MT, Mashek DG. ATGL promotes autophagy/lipophagy via SIRT1 to control hepatic lipid droplet catabolism. Cell Rep 2017;19:1‐9. [DOI] [PMC free article] [PubMed] [Google Scholar]
- 17. Wu H, Zhang T, Pan F, Steer CJ, Li Z, Chen X, et al. MicroRNA‐206 prevents hepatosteatosis and hyperglycemia by facilitating insulin signaling and impairing lipogenesis. J Hepatol 2017;66:816‐824. [DOI] [PMC free article] [PubMed] [Google Scholar]
- 18. Lee JM, Wagner M, Xiao R, Kim KH, Feng D, Lazar MA, et al. Nutrient‐sensing nuclear receptors coordinate autophagy. Nature 2014;516:112‐115. [DOI] [PMC free article] [PubMed] [Google Scholar]
- 19. Najt CP, Lwande JS, McIntosh AL, Senthivinayagam S, Gupta S, Kuhn LA, et al. Structural and functional assessment of perilipin 2 lipid binding domain(s). Biochemistry 2014;53:7051‐7066. [DOI] [PMC free article] [PubMed] [Google Scholar]
- 20. Michalopoulos G, Cianciulli HD, Novotny AR, Kligerman AD, Strom SC, Jirtle RL. Liver regeneration studies with rat hepatocytes in primary culture. Cancer Res 1982;42:4673‐4682. [PubMed] [Google Scholar]
- 21. Yoshimoto K, Nakamura T, Ichihara A. Reciprocal effects of epidermal growth factor on key lipogenic enzymes in primary cultures of adult rat hepatocytes. Induction of glucose‐6‐ phosphate dehydrogenase and suppression of malic enzyme and lipogenesis. J Biol Chem 1983;258:12355‐12360. [PubMed] [Google Scholar]
- 22. Kamarajugadda S, Becker JR, Hanse EA, Mashek DG, Mashek MT, Hendrickson AM, et al. Cyclin D1 represses peroxisome proliferator‐activated receptor alpha and inhibits fatty acid oxidation. Oncotarget 2016;7:47674‐47686. [DOI] [PMC free article] [PubMed] [Google Scholar]
- 23. Young SG, Zechner R. Biochemistry and pathophysiology of intravascular and intracellular lipolysis. Genes Dev 2013;27:459‐484. [DOI] [PMC free article] [PubMed] [Google Scholar]
- 24. Zechner R, Madeo F, Kratky D. Cytosolic lipolysis and lipophagy: two sides of the same coin. Nat Rev Mol Cell Biol 2017;18:671‐684. [DOI] [PubMed] [Google Scholar]
- 25. Schulze RJ, Sathyanarayan A, Mashek DG. Breaking fat: the regulation and mechanisms of lipophagy. Biochim Biophys Acta Mol Cell Biol Lipids 2017;1862:1178‐1187. [DOI] [PMC free article] [PubMed] [Google Scholar]
- 26. DiStefano MT, Danai LV, Roth Flach RJ, Chawla A, Pedersen DJ, Guilherme A, et al. The lipid droplet protein hypoxia‐inducible gene 2 promotes hepatic triglyceride deposition by inhibiting lipolysis. J Biol Chem 2015;290:15175‐15184. [DOI] [PMC free article] [PubMed] [Google Scholar]
- 27. Cingolani F, Czaja MJ. Regulation and functions of autophagic lipolysis. Trends Endocrinol Metab 2016;27:696‐705. [DOI] [PMC free article] [PubMed] [Google Scholar]
- 28. Brown NE, Jeselsohn R, Bihani T, Hu MG, Foltopoulou P, Kuperwasser C, et al. Cyclin D1 activity regulates autophagy and senescence in the mammary epithelium. Cancer Res 2012;72:6477‐6489. [DOI] [PMC free article] [PubMed] [Google Scholar]
- 29. Casimiro MC, Di Sante G, Di Rocco A, Loro E, Pupo C, Pestell TG, et al. Cyclin D1 restrains oncogene‐induced autophagy by regulating the AMPK‐LKB1 signaling axis. Cancer Res 2017;77:3391‐3405. [DOI] [PMC free article] [PubMed] [Google Scholar]
- 30. Singh R, Kaushik S, Wang Y, Xiang Y, Novak I, Komatsu M, et al. Autophagy regulates lipid metabolism. Nature 2009;458:1131‐1135. [DOI] [PMC free article] [PubMed] [Google Scholar]
- 31. Mullany LK, White P, Hanse EA, Nelsen CJ, Goggin MM, Mullany JE, et al. Distinct proliferative and transcriptional effects of the D‐type cyclins in vivo. Cell Cycle 2008;7:2215‐2224. [DOI] [PMC free article] [PubMed] [Google Scholar]
- 32. Sapiro JM, Mashek MT, Greenberg AS, Mashek DG. Hepatic triacylglycerol hydrolysis regulates peroxisome proliferator‐activated receptor alpha activity. J Lipid Res 2009;50:1621‐1629. [DOI] [PMC free article] [PubMed] [Google Scholar]
- 33. Lee Y, Dominy JE, Choi YJ, Jurczak M, Tolliday N, Camporez JP, et al. Cyclin D1‐Cdk4 controls glucose metabolism independently of cell cycle progression. Nature 2014;510:547‐551. [DOI] [PMC free article] [PubMed] [Google Scholar]
- 34. Bhalla K, Liu WJ, Thompson K, Anders L, Devarakonda S, Dewi R, et al. Cyclin D1 represses gluconeogenesis via inhibition of the transcriptional coactivator PGC1alpha. Diabetes 2014;63:3266‐3278. [DOI] [PMC free article] [PubMed] [Google Scholar]
- 35. Menon D, Salloum D, Bernfeld E, Gorodetsky E, Akselrod A, Frias MA, et al. Lipid sensing by mTOR complexes via de novo synthesis of phosphatidic acid. J Biol Chem 2017;292:6303‐6311. [DOI] [PMC free article] [PubMed] [Google Scholar]
- 36. Patel D, Salloum D, Saqcena M, Chatterjee A, Mroz V, Ohh M, et al. A late G1 lipid checkpoint that is dysregulated in clear cell renal carcinoma cells. J Biol Chem 2017;292:936‐944. [DOI] [PMC free article] [PubMed] [Google Scholar]
Associated Data
This section collects any data citations, data availability statements, or supplementary materials included in this article.
Supplementary Materials
FigS1
FigS2
FigS3
FigS4


