Abstract
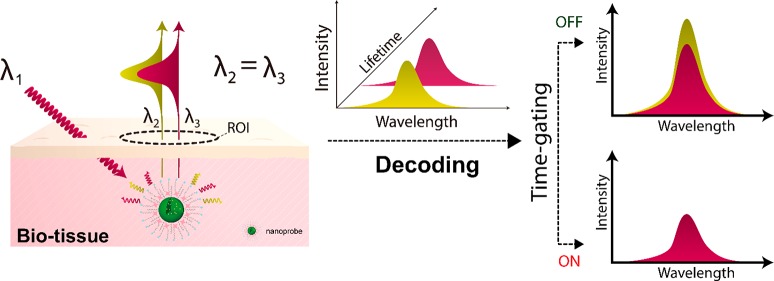
Luminescence imaging, exhibiting noninvasive, sensitive, rapid, and versatile properties, plays an important role in biomedical applications. It is usually unsuitable for direct biodetection, because the detected luminescence intensity can be influenced by various factors such as the luminescent substance concentration, the depth of the luminescent substance in the organism, etc. Ratiometric imaging may eliminate the interference due to the luminescent substance concentration on the working signal. However, the conventional ratiometric imaging mode has a limited capacity for in vivo signal acquisition and fidelity due to the highly variable and wavelength-dependent scattering and absorption process in biotissue. In this work, we demonstrate a general imaging mode in which two signals with the same working wavelength are used to perform ratiometric sensing ignoring the depth of the luminescent substance in the organism. Dual-channel decoding is achieved by time-gated imaging technology, in which the signals from lanthanide ions and fluorescent dyes are distinguished by their different luminescent lifetimes. The ratiometric signal is proven to be nonsensitive to the detection depth and excitation power densities; thus, we could utilize the working curve measured in vitro to determine the amount of target substance (hypochlorous acid) in vivo.
Short abstract
A time-gated ratiometric detection mode with the same working wavelength could minimize the interferences from photon attenuation, which makes sense for in vivo detection.
Introduction
The analysis of the concentration of specific biospecies, such as biological macromolecules,1−7 micromolecules,8−10 or ions,11,12 is important in disease research, clinical trials, and medical practice. As an essential technique in biological research and disease detection/diagnosis,13−19 luminescence imaging is welcomed for sensitive, noninvasive, economical, and rapid response. Obtaining quantitative information has always been the purpose of in vivo detection. In the imaging process, the detected luminescence intensity is markedly attenuated because of absorption and scattering in biotissue. Thus, the intensity signals are not only analyte-dependent but also influenced by the amount and depth of probe in tissue. As a result, in most luminescence imaging cases the single luminescence intensity signals measured through living tissue cannot be used to analyze the concentration of analytes.
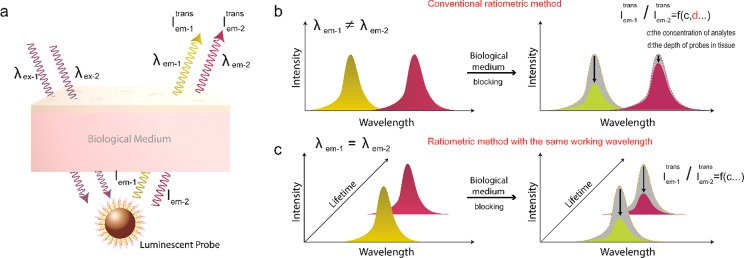
To address this issue, ratiometric imaging/detection is supposed to be an alternative method. In ratiometric imaging mode, one or two light beams penetrate biological tissue to excite two luminescence signals, and the ratio of the transmitted intensity of the two luminescence signals (Iem-1trans/Iem-2trans) is used to determine the concentration of analytes (Scheme 1a).20−22 The advantage is that in general the amount of probe does not interfere with the readout of ratiometric signals. However, the transmission abilities of light with different wavelengths differ.23,24 As previously mentioned, total attenuation of the photon is the sum of attenuation due to absorption and scattering in biological tissue (Figure S1). In photon transport theory, the absorption coefficient μa and scattering coefficient μs are used to represent the probability that a photon will be absorbed or scattered per unit length in tissue, and they depend on the species of matter and the incident wavelength. For example, when the wavelength of light increases from 665 to 960 nm, μs of human blood decreases from 1246 to 505 cm–1 while μa increases from 1.3 to 2.84 cm–1.25 In conventional ratiometric imaging, detection signals are located in different wavelength regions to facilitate the signals’ distinction, which caused a difference in degrees of intensity attenuation (Scheme 1b). Hence, the application in quantification is hampered by the uncertainty brought about by the different attenuations in different wavelength regions. There is a significant deviation in using the ratio values measured through tissue to denote the ratio values in situ.
Scheme 1. (a) Schematic Illustration of Ratiometric Imaging, and Ratiometric Imaging Mode in Which the Wavelengths of Emission Light Are (b) Different or (c) the Same.
The excitation light (a beam or two beams) penetrates the tissue to excite the luminescent probe (usually composed of two or more kinds of emissive materials). The intensities of the excitation and emission of light will be attenuated during the process of penetrating biological tissue. (Iem-1, Iem-2: the intensities of luminescence emitted by probe. Iem-1trans, Iem-2trans: the intensities of light after penetrating biological tissue).
The degrees of attenuation of the light intensities after the emission light penetrates the biological tissue are also (part b) different or (part c) the same.
Herein, we propose a ratiometric detection method collecting two luminescent signals with the same emission wavelength, separately, under one laser excitation (Scheme 1c), aiming at providing relatively accurate quantifiable information independent of the amount and the depth of probes in tissue. Light of the same wavelength shares identical physical rules in terms of wave propagation and scattering; thus, the ratio value of the measured emission intensities does not change when the thickness of tissue blocking the light path changes (Scheme 1c, Figure S2). On the basis of this principle, we assembled long-lifetime lanthanide-doped nanoparticles NaYF4:Nd (NPs) and organic dye Cy860 (absorption peaks at 860 nm in ethanol) molecules obtaining millesimal lifetime compared to that of the rare earth materials into one nanocomposite. Time-gated luminescence technology is used to decode the dual-channel signal. Using our self-designed time-gated (TG) imaging system, we distinguished the luminescence intensities of these two types of luminescent substances which emitted light at the same wavelength (893 nm). In the verification experiment, we accurately detected hypochlorous acid concentrations in 96-well plates covered with pork (2 and 3 mm thick). The further animal experiments also supported our conclusions. This detection mode eliminated the deviation caused by biological tissue blocking during signal acquisition making sense for accomplishing the quantitative detection in vivo.
Results and Discussion
Confirmation and Evaluation of Ratiometric Imaging Modes
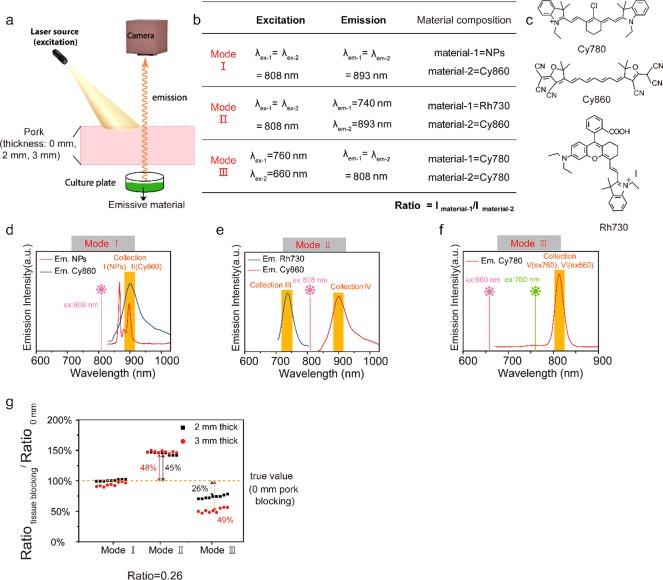
To confirm that our imaging mode has better accuracy in the measurement of in vivo luminescence ratio signals, we imaged the luminescence of four types of emissive materials (Figure 1b,c) through tissue (pork) of known thickness (0, 2, and 3 mm) (Figure 1a). To accomplish our ratiometric imaging mode (mode I), we chose two types of materials (NaYF4:5%Nd,26−29 organic dye Cy860) with luminescence emission in the same wavelength band. As shown in Figure 1d, the nanoparticle NaYF4:5%Nd and organic dye Cy860 could both be excited at 808 nm, and both have emission at 893 nm. The hydrophobic hexagonal oleate-coated NaYF4:5%Nd in diameter of ∼18 nm was synthesized via a modified solvothermal method with oleate as the surface ligand (Figure S3a,b), and the actual concentration of doped Nd3+ was confirmed by ICP-AES (Figure S3c). Figure S4, Supporting Information, shows that the X-ray powder diffraction peaks of the nanoparticles correlated well with the hexagonal structure of NaYF4 (JCPDS 16-0334). The comparison sets were chosen as follows. For mode II (Figure 1e), a beam of excitation light (808 nm) was used to excite Rh730 and NaYF4:Nd generating two luminescence signals at different wavelengths (730 and 893 nm). For mode III (Figure 1f), excitation light at different wavelengths (660 and 760 nm) was used to excite Cy780 generating two luminescence signals at the same wavelength (808 nm). The luminescence intensity increased with increasing material concentration and decreased with the increased thickness of the covered pork (Figure S5a–c). We calculated the ratios of the fluorescence intensities collected by two channels (Figure S5d–i) in each mode covering the same thickness of pork (Figure S5j–l). The ratios of the luminescence intensities of two emissive materials without covered tissue were called R0mm. Therefore, when the values of R2mm/R0mm (abbreviated as R2/0) and R3mm/R0mm (abbreviated as R3/0) are closer to 1, the ratio signal measured by this mode is closer to the true value, indicating that this method has higher fidelity when obtaining the in vivo ratio signal. As shown in Figure 1g, when the R0mm values measured by three modes were all fixed at 0.26, the average value of I-R2/0 (R2/0 measured by mode I) and I-R3/0 were 1.01 and 0.94, respectively. The average values of II-R2/0, II-R3/0, III-R2/0, and III-R3/0 are 1.45, 1.48, 0.74, and 0.51, respectively. Furthermore, we calculated the R2/0 and R3/0 values obtained in these three modes when the R0mm ranged from 0.05 to 0.3 (the specific values are shown in Figure S5j–l). As shown in Figure S5m, it could be found that mode I still had the higher accuracy. All test results differed from 1 by less than 20%. The average |R2/0 – 1| of mode I was only 5.7%. The value of |I-R2/0 – 1| was slightly higher, still less than 10% at only 7.9%. These data illustrate that our ratiometric mode can output the in situ ratio signals with high accuracy, especially in low depth. In comparison, the |R2/0 – 1| and |R3/0 – 1|of modes II and III were significantly higher. All the measured values were higher than 0.2. The |R2/0 – 1| values of mode II and mode III were 35% and 25%, respectively. The |R3/0 – 1| values were higher, reaching 36% and 48%, respectively. These results indicate that our ratiometric mode can output more accurate in situ signals than other ratiometric modes.
Figure 1.
(a) Schematic illustration of the imaging process. Different emissive materials were placed in the well plate in turn and covered with pork slices of different thicknesses. The specific materials and corresponding excitation and emission wavelengths are listed in part b. (b) Introduction of emissive materials used in comparison of three modes. (c) Chemical structures of Cy780, Cy860, and Rh730. (d–f) Schematic illustration of modes I, II, and III. (g) Ratio values of the ratio signals measured with pork blocking to ratio signals measured without pork blocking in three modes (tested nine times). The ratio signals measured without pork blocking were all fixed at 0.26. Then, the deviation was equal to |R2mm-or-3mm/R0mm – 1|.
Synthesis and Characterization of Hypochlorous-Acid-Responsive NPs@dye@PC
Hypochlorous acid is chosen as the model analyte in our experimental demonstration here. As one of the most important reactive oxygen species (ROS), hypochlorous acid can kill a wide range of pathogens in the innate immune system, but excessive production can also be harmful.30,31 Cy860 can react with hypochlorous acid selectively, forming corresponding oxindole derivatives. The reaction was investigated in EtOH/H2O solution (1:2, v/v). Both the luminescence intensity and absorbance of Cy860 gradually decreased with the titration of NaClO (Figure S6). To ensure the selectivity, other ROS, such as m-cpba, H2O2, •OH, NO, O2–, ROO•, and tBuOOH, were tested in the same reaction system. No significant variations of absorbance and luminescence intensity were observed (Figure S7). For detection applications in vivo, NaYF4:5%Nd and organic dye Cy860 were then enveloped by phosphatidylcholine (PC) through hydrophobic–hydrophobic interaction to form a water-soluble nanocomposite (NPs@dye@PC) (Figure 2a). PC is widely used to improve the hydrophilicity and biocompatibility of hydrophobic nanoparticles (Figure S8a). The final products could be well-dispersed in water (Figure 2b). The luminescence of lanthanide-doped nanoparticles can be quenched by organic dyes. When hypochlorous acid in the environment reacted with organic dyes, the quenching process was interrupted resulting in the reappearance of luminescence of lanthanide-doped nanoparticles. The effect of the amount ratio of nanoparticles to Cy860 on luminescence of the nanosystem and the detection process was also determined. Figure S8b shows that more dye was assembled into the final composites, and more hypochlorous acid was needed to react with Cy860 destroying its chemical structure and leading to the reappearance of the luminescence of NaYF4:Nd. To ensure that the nanoprobe could detect low concentrations of hypochlorous acid, the optimal input amount of Cy860 to assemble NaYF4:Nd (0.1 mmol) was 2 × 10 –7 mol, and 0.21 × 10⁻⁷ mol was actually encapsulated (Figure S8c,d). Changes in the luminescence emission spectra of NPs@dye@PC solution (water) following the gradual addition of NaClO are shown in Figure 2c. The fluorescence lifetime of Nd3+ at 893 nm was also tested. Both the FRET and inner filter effect occurred in the quenching process. The energy transfer from NPs to dye shortened the lifetime of Nd3+ from 51 to 16 μs (Figure S8e). The coexistence of FRET and inner filter effect could enlarge the changes of ratio signals when the hypochlorous acid is added meaning that the energy transfer process made the probe more sensitive.
Figure 2.
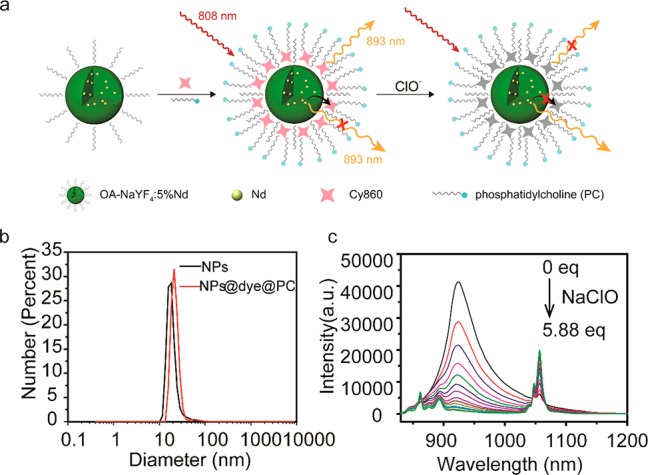
(a) Schematic illustration of the synthesis of NaYF4:Nd@Cy860@PC and its response to ClO– with a change in ratiometric luminescence emission. With the gradual addition NaClO destroying its chemical structure, the luminescence of organic dyes is turned off while nanoparticles’ emission is turned on. (b) Size distribution of NPs and NPs@dye@PC. (c) Luminescence emission spectra of NPs@dye@PC solution (water) upon gradual addition of NaClO.
Unlike common ratiometric luminescent probes providing the response signal and the reference signal with constant fluorescence intensity, the trend in luminescence intensity of NaYF4:5%Nd and Cy860 was the opposite following the addition of hypochlorous acid. The luminescence intensity at 893 nm decreased approximately 4-fold, and the luminescence intensity at 1057 nm increased 3-fold following the titration of hypochlorous acid (Figure 2c). Thus, the ratio values of luminescence intensity at these two wavelengths can change 12-fold, much more significantly than probes using fixed luminescence intensity as the reference, indicating that our probes were more sensitive.
TG Imaging System and Time-Gated Luminescence Imaging
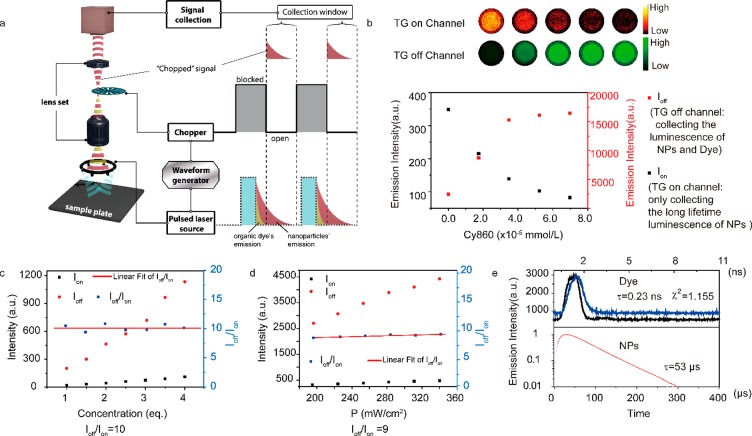
Conventional imaging systems cannot distinguish the signals from two different emissive materials with the same band emission by a filter or similar spectroscopic devices. We proposed a TG technology to decode dual-channel signals with the same band emission but different luminescent lifetimes. The lifetime of NaYF4:5%Nd is 53 μs, and the lifetime of Cy860 is 0.23 ns (Figure 3e), at the nanosecond level.32 The schematic of the TG animal imaging system is shown in Figure 3a. This TG imaging system comprises an imaging system and a time-gating unit.33 The time-gating unit was composed of an optical chopper and an arbitrary waveform generator. When the time-gating unit was in the closed state (off), and the control of the waveform generator to the lasers was canceled, this TG imaging system could be used as a common imaging system for small animals, and all luminescence (NaYF4:5%Nd and Cy860) was collected (TG off channel). When the time-gating unit was switched on (TG on channel), the time-gating function decayed the short-lifetime luminescence (Cy860) to a negligible level and only collected long-lifetime luminescence signals (NaYF4:5%Nd). The detailed instrument design and working principle are described in the Experimental Section. When the time-gating unit was switched off, the detected luminescence intensity of Cy860 was much stronger than that of NaYF4:5%Nd nanoparticles, but when the time-gating unit was switched on, the luminescence of nanoparticles was still easy to detect while the fluorescent signal of Cy860 has completely disappeared (Figure S9). The Cy860 solution in ethanol was gradually added to a solution of 100 mg of NPs in ethanol. Then, the emission intensity collected in the TG on channel gradually weakened while the emission intensity collected in the TG off channel gradually increased (Figure 3b). These ratio values are independent of the concentration of the composite material and the power density of the excitation light (Figure 3c,d). These phenomena mean that the ratio of the emission intensity of TG off channel and TG on channel is a one-to-one correspondence between the ratio of the amount of dye and NPs. This change principle in emission intensity is the basis for our follow-up hypochlorous acid detection.
Figure 3.
(a) Schematic illustration of TG imaging system. The system was composed of a time-gating unit and imaging unit. When the time-gating unit was on, the short-lifetime luminescence decayed completely after a delay we set. When the time-gating unit was off, all the luminescence could be collected. (b) Luminescence images of NaYF4:Nd solution with time-gating unit on and off upon the gradual addition of Cy860. (c, d) Intensities of the emission of TG off channel and TG on channel with the change of luminescent material concentration and power density of the excitation light. (e) Fluorescence decay curves of Nd3+ emission at 893 nm from NaYF4:5%Nd nanoparticles (red line) and Cy860 emission at 893 nm in EtOH (black line, instrument response function; blue line, decay of the luminescence of Cy860).
Monitoring Hypochlorous Acid in Vitro
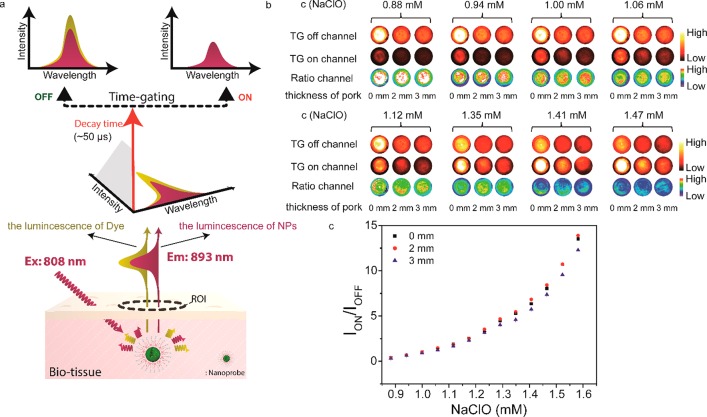
For proof of concept experiments, we first detected hypochlorous acid in a 96-well culture plate. We imaged the luminescence of NaYF4:Nd@Cy860@PC through tissue (pork) of known thickness using our TG imaging system to collect the luminescence signals of NaYF4:Nd with the time-gating unit on (TG on channel) and the luminescence signals of NaYF4:Nd and Cy860 with the time-gating unit off (TG off channel) (Figure 4a). Band-pass filters (880–900 nm) were used to collect the luminescence emission of NaYF4:Nd and Cy860 at 893 nm. NaYF4:Nd@Cy860@PC (0.3 mmol) was dispersed in 300 μL of deionized water in each well. Sodium hypochlorite (0.02 mol/L) was then added dropwise and allowed to fully react with NaYF4:Nd@Cy860@PC (the reaction time was set to 3 min confirmed by the reaction kinetics measurement, Figure S10a). Following the addition of NaClO, the luminescence of nanoparticles (Figure S10b) gradually increased, while the luminescence of the organic dye (Figure S10c) was weakened (Figure 4b). These findings showed that ClO– reacted with Cy860 efficiently in the nanosystem. As shown in Figure 4b, for any hypochlorous acid concentration, the emission intensity decreased with the increase of the thickness of the pork slice covered, in both the TG on channel and TG off channel. However, the images of ratiometric imaging were only related to the concentration of hypochlorous acid and not to the thickness of the pork slice. The luminescence intensity ratio values of nanoparticles to organic dyes measured through tissue with thickness of 0, 2, and 3 mm are shown in Figure S11. The Pearson correlation coefficient was used to evaluate the linear correlation between the ratio values measured with and without covered pork (2, 3 mm), giving a value between −1 and +1 inclusive, where 1 is a total positive correlation, 0 no correlation, and −1 a total negative correlation. The Pearson correlation coefficient between values measured through tissue of 0 and 2 mm was 0.9994, while the coefficient was 0.9997 when the tissue thicknesses were 0 and 3 mm. The average |R2/0 – 1| values and |R3/0 – 1| values were found to be 3.2% and 9.4%, respectively. These findings indicated that the ratio values measured through tissue were very similar to those without tissue in the light path. In the actual quantitative testing process, the concentration of analytes was calculated from the ratio values according to the standard calibration curve. The error range caused by using the calibration curve measured in vitro was calculated to determine the concentration of analytes in vivo. The average |R2/0 −1| values and |R3/0 – 1| values were 0.61% and 1.74%, respectively (Figure S12). These data demonstrate that our method of detecting analytes in organisms has high accuracy, especially in low-depth detection.
Figure 4.
(a) Schematic illustration of dual-channel decoding the same band luminescence. NPs and dye emitted luminescence at 893 nm under the excitation of an 808 nm laser. When the time-gating unit was on, the short-lifetime luminescence of dye decayed completely after a ∼50 μs delay, and only the long-lifetime luminescence of NPs could be collected by camera. When the time-gating was off, all the luminescence could be collected. (b) Luminescent images of a composite nanoprobe treated with different concentrations of hypochlorous acid at TG on, TG off, and ratio channel. A band-pass filter (880–900 nm) was used to collected luminescence. (TG on channel: gain 10, exposure time 5 s. TG off channel: gain 2, exposure time 1 s.) (c) Ratios of luminescence intensities of TG on channel to TG off channel. During the luminescence test of nanoparticles and organic dyes, all test conditions remain unchanged.
Monitoring Hypochlorous Acid in Vitro with Tissue Blocking
To further confirm the feasibility of detecting hypochlorous acid in vivo using our strategy, we applied it in balb/c mice (4 week old). First, we injected the mixture of NaYF4:Nd@Cy860@PC and sodium hypochlorite solution into the mouse’s right foot. As shown in Figure S13, the mouse (group 1 and group 2) injected with the 20 μL mixture (NaYF4:Nd@Cy860@PC, 1 mmol/L; sodium hypochlorite, 1.6 mmol/L) emitted a similar intensity as compared to luminescence signals collected in the TG on, TG off, and ratio channel. If the concentration of sodium hypochlorite (group 3) was decreased, we could observe the significant enhancement of signals in TG on channel and decrease in TG off channel. Thus, the ratio value of group 3 was higher than those of group 1 and group 2. If we did not change the concentration of sodium hypochlorite and only increased the amount of composite material (group 4), we could find that the signal intensities collected both in TG off channel and TG on channel were enhanced, but the intensity of ratio signal remained basically unchanged. These findings indicate that the ratio signals emitted by the composite material are only related to the concentration of sodium chlorite but not to the concentration of the composite material itself. Second, we filled capillaries with the mixture of NaYF4:Nd@Cy860@PC (1 mmol/L) and sodium hypochlorite (1.6 mmol/L), and then put three capillaries in different depths (surface, intradermal, subcutaneous) of the mouse’s abdomen (Figure 5a). As shown in Figure 5b, when the capillaries were buried deeper in the mouse, the collected luminescence intensity signals were weaker. Luminescence signals along the white line in Figure 5b were identified in Figure 5c. The peak fluorescence intensity calculated by GaussAmp fitting minus the background intensity was regarded as the signal intensity we extracted. As shown in Figure S13, the ratio values of number 1 capillary, number 2 capillary, and number 3 capillary were 1.2, 1.2, and 1.3, respectively. The proximity of the three ratio values proved once again that our ratiometric detection mode could provide in situ ratio signals. Then, the concentrations of NaClO were calculated from the working curve in Figure 4c. As shown in Figure 5d,e, the calculated concentrations were consistent with the actual concentration.
Figure 5.
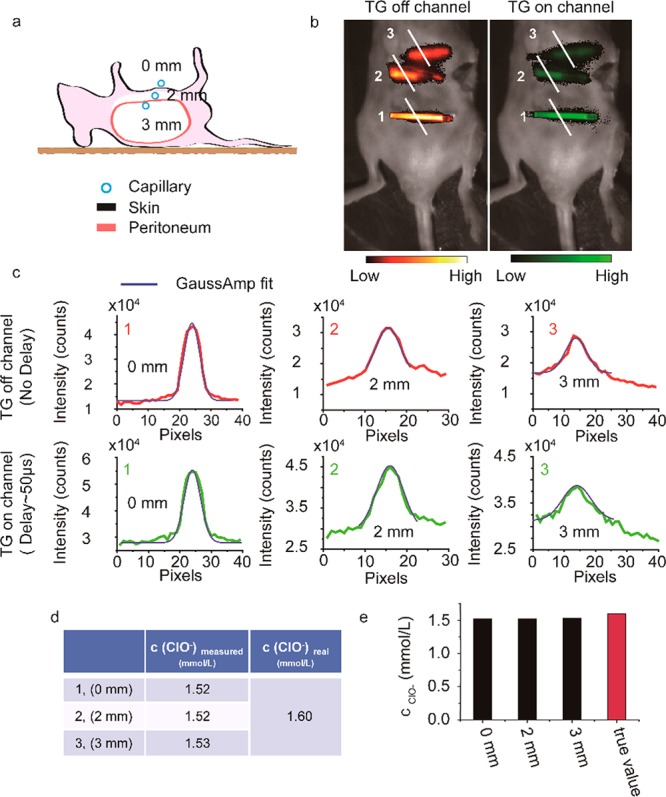
(a, b) Schematic illustration of imaging and images of capillaries filled with composite material buried in different depths of the mouse’s abdomen (gain 20, exposure time: TG on channel 10 s, TG off channel 5 s). The depths were 0, 2, and 3 mm. (c) Intensities of luminescence signals along the white line in part b. (d, e) Summary of the calculated and actual concentration of ClO–.
Monitoring Hypochlorous Acid in Vivo
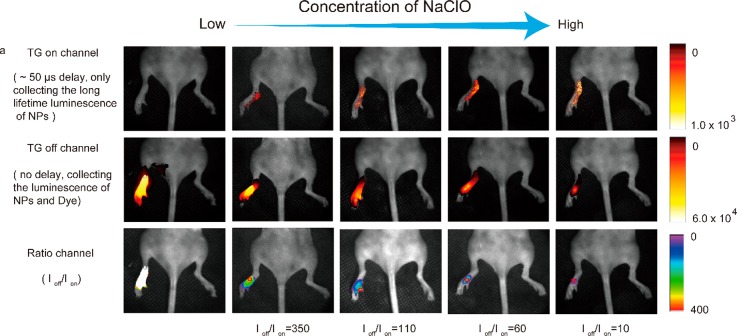
Lastly, sodium hypochlorite solution (25 μL) with different concentrations was injected into the right foot, followed by the injection of 25 μL of NaYF4:Nd@Cy860@PC. Then, 5 min after injection of the composite materials, the experimental mice were imaged using our TG imaging system. The luminescence images in vivo are shown in Figure 6a. Following the injection of hypochlorous acid, the detected luminescence increased or decreased when the time-gating unit was switched on or off, respectively. As proven by the in vitro experiments, we could use the working curve measured in vitro as the calibrated curve (Figure 4c) to calculate the concentration of hypochlorous acid in vivo with a small deviation. The ratios (Ioff/Ion) of the four dotted areas in Figure 6a were 350, 110, 60, and 10. To reduce burns in the mice during the imaging process, we reduced the excitation light power and increased the exposure time and gain factor. According to our conversion, the ratio value should be expanded by 25 times to match the calibration curve in Figure 4c. The signal intensity of the same area at the ankle of three mice was then calculated. The hypochlorous acid concentrations calculated from the ratio values were 0.75, 0.81, 0.87, and 1.18 mmol/L. These findings indicate that our detection method can determine the amount of analytes in vivo effectively.
Figure 6.
(a) In vivo images of living mice with injection of 25 μL of sodium hypochlorite solution and 25 μL of NaYF4:Nd@Cy860@PC aqueous solution (3 mol/L) (exposure time 10 s, gain 20). A band-pass filter (880–900 nm) was used to collect the luminescence emission from 880 to 900 nm (excitation laser power density: 300 mW/cm2).
Conclusion
In summary, this work proposes a ratiometric detection mode providing in situ ratio signals. The ratio signals come from lanthanide-doped nanoparticles (lifetime of 53 μs) and organic dyes (lifetime of 0.23 ns) with the same band emission, and could greatly eliminate the interference of biotissue located in the light path. We also developed a corresponding signal collection method utilizing a time-gated technique. Ultimately, we achieved hypochlorous acid luminescence ratiometric detection with tissue blocking up to 2 and 3 mm, with the average relative deviations of hypochlorous acid concentration of only 0.61% and 1.74%, respectively, demonstrating the accuracy of our method. This strategy had also proven to be effective in subsequent in vivo experiments.
Experimental Section
No unexpected or unusually high safety hazards were encountered.
Synthesis of Oleate-Coated NaYF4:Nd Nanoparticles
Spherical-like oleate-coated NaYF4:Nd nanoparticles were synthesized via a modified solvothermal method. Typically, 6 mL of oleic acid (OA), 1 mmol of lanthanide chloride (95% mol of Y, 5% mol of Nd), and 15 mL of 1-octadecene were added into a 100 mL three-necked flask. The mixture was degassed at 80 °C for 30 min, and then heated to 140 °C for 30 min to obtain a transparent solution. After that, the solution was cooled to room temperature. Subsequently NaOH (2.5 mmol) and NH4F (4 mmol) dissolved in 6 mL of methanol were slowly added into the transparent solution. The mixture was degassed at 90 °C for another 20 min, and then heated to 305 °C quickly and maintained for 1 h under an argon atmosphere. When the reaction was complete and cooled, 5 mL of ethanol was added to the flask. The products were collected by centrifugation and washed two times with cyclohexane/ethanol (1:2 v/v). Finally, the obtained products were dispersed into 10 mL cyclohexane for storing and the following assembly.
Synthesis of Compound 1
Sodium ethoxide (50 mg, 0.65 mmol), 3-hydroxy-3-methyl-2-butanone (450 mg, 4.4 mmol), malononitrile (600 mg, 9.05 mmol), and 0.5 mL of ethanol were added to a 10 mL single-necked flask. The mixture was stirred for 1 h at room temperature. The system was then heated to 90 °C for 2 h after the addition of 1.5 mL of ethanol. The mixture was cooled to 0 °C. The product was filtered and washed with anhydrous ether and then dried to give 700 mg (80%) of compound 1 as a solid. 1H NMR (400 MHz, CDCl3): δ 2.367 (s, 3H), 1.633 (s, 6H). MS (MALDI-TOF MS): calcd for C11H9N3O+, 199.07 [M]+; found, 199.04 [M]+.
Synthesis of Compound 2
Portions of 2,3,3-trimethylindole (7.96 g, 50 mmol), iodoethane (8.0 g, 50 mmol), and 40 mL of methylbenzene were added into a 100 mL single-necked flask. The mixture was stirred and dissolved under nitrogen protection. Then, the system was heated to 110 °C for 20 h. After the reaction was cooled down to room temperature, the product was filtered and washed with anhydrous ether and dried to give 15 g (95%) of compound 2 as a solid. 1H NMR (400 MHz, CDCl3): δ 7.75–7.66 (m, 1H), 7.66–7.55 (m, 3H), 4.79 (q, J = 7.4 Hz, 2H), 3.17 (s, 6H), 1.67 (s, 6H), 1.63 (t, J = 7.4 Hz, 3H). MS (MALDI-TOF MS): calcd for C13H18N+, 188.1 [M]+; found, 188.1 [M]+.
Synthesis of Compound 3
The mixture of phosphorus oxychloride (37 mL, 397 mmol) and CH2Cl2 (40 mL) was dropped into the mixture of DMF (40 mL, 516 mmol) and CH2Cl2 (40 mL) at 0 °C. Then, the mixed system was heated to 50 °C for 2 h after a dropwise addition of cyclohexanone (10 g, 100 mmol). After the reaction was cooled down 0 °C, some ice-water was poured in to consume the unreacted phosphorus oxychloride. The product was filtered and washed with petroleum ether and dried to give 10.4 g (60%) of compound 3 as a solid. 1H NMR (400 MHz, CDCl3): δ 2.46 (t, J = 6.2 Hz, 4H), 1.75–1.68 (m, 2H). MS (MALDI-TOF MS): calcd for C8H9ClO2, 172.03 [M]+; found, 172.00 [M]+.
Synthesis of Cy860
Compound 1 (100 mg, 0.5 mmol), pentenaldehyde diphenylamine hydrochloride (70 mg, 0.25 mmol), potassium acetate (50 mg), and acetic anhydride (1 mL) were added into a 10 mL single-necked flask. The mixture was degassed at 70 °C for 30 min. After the reaction was cooled down to room temperature, some NaHCO3 solution was added. Then dichloromethane was used to extract the product. The crude product was purified by silica gel chromatography (CH2Cl2/MeOH) to afford 100 mg (87%) of Cy860. 1H NMR (400 MHz, MeOD): δ 7.628 (t, J = 13.2 Hz, 2H), 7.204 (t, J = 12.8 Hz, 1H), 6.398 (t, J = 12.6 Hz, 2H), 6.016 (t, J = 13.6 Hz, 2H), 1.624 (s, 12H). MS (MALDI-TOF MS): calcd for C27H19N6O2, 459.16 [M]+; found, 459.09 [M]+.
Synthesis of Cy780
See ref (30). Compound 2 (6.3 g, 20 mmol), compound 3 (1.7 g, 10 mmol), potassium acetate (2.0 g, 20 mmol), and acetic anhydride (40 mL) were added into a 100 mL single-necked flask. The mixture was degassed at 70 °C under N2 protection in darkness for 30 min. After the reaction was cooled down to room temperature, some NaHCO3 solution was added and stirred for 2 h. The product was filtered and washed with water and dried to give 11.5 g (90%) of Cy780 as a solid. 1H NMR (400 MHz, MeOD): δ 8.437 (d, J = 14.4 Hz, 2H), 7.523 (d, J = 6.8 Hz, 2H), 7.439 (t, J = 8.0 Hz, 2H), 7.624 (m, 2H), 7.329 (d, J = 8.0 Hz, 2H), 7.295 (t, J = 7.6 Hz, 2H), 6.279 (d, J = 14.0 Hz, 2H), 4.198 (q, J = 14.4 Hz, 7.2 Hz, 4H), 2.747 (t, J = 6.4 Hz, 2H), 2.019–1.921 (m, 2H), 1.734 (s, 12H), 1.413 (t, J = 7.2 Hz, 6H). MS (MALDI-TOF MS): calcd for C34H40N2Cl+, 511.29 [M+1]+; found, 511.39 [M]+.
Synthesis of Rh730
The preparation of RH730 was developed via a reported literature procedure.111H NMR (400 MHz, d4-CD3OD): δ 8.65 (d, J = 13.5 Hz, 1H), 8.10 (d, J = 7.1 Hz, 1H), 7.64–7.57 (m, 2H), 7.53 (d, J = 7.3 Hz, 1H), 7.40 (d, J = 7.6 Hz, 1H), 7.31–7.24 (m, 2H), 7.18 (d, J = 7.1 Hz, 1H), 6.87 (d, J = 9.1 Hz, 1H), 6.79 (d, J = 8.9 Hz, 1H), 6.72 (s, 1H), 6.15 (d, J = 14.0 Hz, 1H), 4.17 (d, J = 7.0 Hz, 2H), 3.56 (d, J = 6.9 Hz, 4H), 2.67 (d, J = 10.6 Hz, 2H), 2.44–2.34 (m, 2H), 1.79 (s, 6 H), 1.63–1.54 (m, 2H), 1.41 (t, J = 6.7 Hz, 3H), 1.24 (d, J = 6.9 Hz, 6H). MS (MALDI-TOF MS): calcd for C38H41N2O3+, 573.3 [M]+; found, 573.2 [M]+.
Assembly of OA-Coated Nanoparticles, Cy860, and PC (Denoted as NPs@Cy860@PC)
A 1 mL cyclohexane solution containing OA-coated nanoparticles (synthesized in the previous procedure) was mixed with 4 mL of CH2Cl2 by ultrasonication, and then, Cy860 was added. The mixture was stirred for 30 min at room temperature to obtain a homogeneous phase. Finally, 30 mg of amphiphilic phosphatidylcholine (PC) dispersed in CH2Cl2 was added, and then, the mixture was stirred at 27 °C for 8 h to volatilize all organic solvents. The precipitated jelly was washed with water to remove excess Cy860. The final product was collected by centrifugation and could be well-redispersed in water.
Construction of the TG Imaging System
A schematic diagram of the TG imaging system for animal imaging is shown in Figure 3a. This TG imaging system was composed of an imaging system and a time-gating unit. In the imaging system, four external 0–10 W adjustable CW 808 nm lasers were used as the excitation sources, and an Andor iXon Ultra EMCCD instrument was used as the signal collector. A camera lens and an eyepiece were placed in the light path to collect signals. The time-gating unit consisted of an optical chopper (C-995, with a blade consisting of 10 slots with a duty cycle of 1:1 and maximum frequency of 5 kHz, Terahertz Technologies Inc.) and an arbitrary waveform generator (UTG2025A, Uni-Trend Technology Limited). When the time-gating unit was in the closed state (off), control of the waveform generator to the lasers was canceled. This TG imaging system could be used as a common imaging system for small animals. When the time-gating unit was switched on, the time-gating function was based on the instrument design described later. The waveform generator outputs TTL signals to synchronize the lasers. In addition, the TTL signals were synchronized with the chopper at the same frequency. The operating frequency of the chopper was set according to the desired signal collection period, and the duty cycle of TTL signals from the waveform generator was set to determine the length of time the lasers were switched on in a signal collection cycle. The initial phase of the TTL signals from the waveform generator was also flexible. On the basis of the above functions, appropriate time-gating unit operating parameters were set to decay short-lifetime luminescence to a negligible level and only collect long-lifetime fluorescence signals and ensure that the collected signals were strong enough.
In Vivo TG Imaging of Hypochlorous Acid
First, 25 μL of NaClO solution at different concentrations (0, 0.468, 0.585, 0.780, and 1.170 mol/L) was injected into the right foot of the mouse. Then, 25 μL of NaYF4:Nd@Cy860@PC (3 mol/L) was injected. Then, 5 min after injection of the composite materials, the experimental mouse was imaged using our TG imaging system when the time-gating unit was switched on and off (gain 20, exposure time 10s). The power density of the excitation light was 300 mW/cm2.
Acknowledgments
We thank the National Natural Science Foundation of China (21722101, 21527801, and 21671042), and the National Key R&D Program of China (Grant 2017YFA0205100) for financial support. We thank Prof. Dayong Jin from University of Technology Sydney for the help in setting up the TG imaging system. We thank Prof. Lingdong Sun and Xiaoyong Wang from Peking University for the testing of the dye’s lifetime. We thank Prof. Xueyuan Chen and Wenwu You from Fujian Institute of Research on the Structure of Matter for the testing of the NPs’ lifetime.
Supporting Information Available
The Supporting Information is available free of charge on the ACS Publications website at DOI: 10.1021/acscentsci.8b00763.
Chemical reagents, instruments, more detailed synthesis procedures, and characterization data including TEM images, ICP-AES, XRD, UV–vis absorption spectra, NMR, and images (PDF)
The authors declare no competing financial interest.
Supplementary Material
References
- Qian Z. S.; Chai L. J.; Huang Y. Y.; Tang C.; Shen J. J.; Chen J. R.; Feng H. A real-time fluorescent assay for the detection of alkaline phosphatase activity based on carbon quantum dots. Biosens. Bioelectron. 2015, 68, 675–680. 10.1016/j.bios.2015.01.068. [DOI] [PubMed] [Google Scholar]
- Soleymani L.; Fang Z.; Sargent E. H.; Kelley S. O. Programming the detection limits of biosensors through controlled nanostructuring. Nat. Nanotechnol. 2009, 4, 844–848. 10.1038/nnano.2009.276. [DOI] [PubMed] [Google Scholar]
- Storhoff J. J.; Lucas A. D.; Garimella V.; Bao Y. P.; Muller U. R. Homogeneous detection of unamplified genomic DNA sequences based on colorimetric scatter of gold nanoparticle probes. Nat. Biotechnol. 2004, 22, 883–887. 10.1038/nbt977. [DOI] [PMC free article] [PubMed] [Google Scholar]
- Wang J.; Ma Q.; Zheng W.; Liu H.; Yin C.; Wang F.; Chen X.; Yuan Q.; Tan W. One-dimensional luminous nanorods featuring tunable persistent luminescence for autofluorescence-free biosensing. ACS Nano 2017, 11, 8185–8191. 10.1021/acsnano.7b03128. [DOI] [PubMed] [Google Scholar]
- Wang Y.; Gan N.; Zhou Y.; Li T.; Cao Y.; Chen Y. Novel single-stranded DNA binding protein-assisted fluorescence aptamer switch based on FRET for homogeneous detection of antibiotics. Biosens. Bioelectron. 2017, 87, 508–513. 10.1016/j.bios.2016.08.107. [DOI] [PubMed] [Google Scholar]
- Wu J.; Balasubramanian S.; Kagan D.; Manesh K. M.; Campuzano S.; Wang J. Motion-based DNA detection using catalytic nanomotors. Nat. Commun. 2010, 1, 36–41. 10.1038/ncomms1035. [DOI] [PubMed] [Google Scholar]
- Wu X.; Xu L.; Ma W.; Liu L.; Kuang H.; Kotov N. A.; Xu C. Propeller-Like Nanorod-Upconversion Nanoparticle Assemblies with Intense Chiroptical Activity and Luminescence Enhancement in Aqueous Phase. Adv. Mater. 2016, 28, 5907–5915. 10.1002/adma.201601261. [DOI] [PubMed] [Google Scholar]
- Liu Y.; Chen M.; Cao T.; Sun Y.; Li C.; Liu Q.; Yang T.; Yao L.; Feng W.; Li F. A cyanine-modified nanosystem for in vivo upconversion luminescence bioimaging of methylmercury. J. Am. Chem. Soc. 2013, 135, 9869–9876. 10.1021/ja403798m. [DOI] [PubMed] [Google Scholar]
- Xu W.; Teoh C. L.; Peng J.; Su D.; Yuan L.; Chang Y. T. A mitochondria-targeted ratiometric fluorescent probe to monitor endogenously generated sulfur dioxide derivatives in living cells. Biomaterials 2015, 56, 1–9. 10.1016/j.biomaterials.2015.03.038. [DOI] [PubMed] [Google Scholar]
- Yuan L.; Wang L.; Agrawalla B. K.; Park S. J.; Zhu H.; Sivaraman B.; Peng J.; Xu Q. H.; Chang Y. T. Development of targetable two-photon fluorescent probes to image hypochlorous Acid in mitochondria and lysosome in live cell and inflamed mouse model. J. Am. Chem. Soc. 2015, 137, 5930–5938. 10.1021/jacs.5b00042. [DOI] [PubMed] [Google Scholar]
- Liu Y.; Su Q.; Chen M.; Dong Y.; Shi Y.; Feng W.; Wu Z. Y.; Li F. Near-Infrared Upconversion Chemodosimeter for In Vivo Detection of Cu2+ in Wilson Disease. Adv. Mater. 2016, 28, 6625–6630. 10.1002/adma.201601140. [DOI] [PubMed] [Google Scholar]
- Peng J.; Xu W.; Teoh C. L.; Han S.; Kim B.; Samanta A.; Er J. C.; Wang L.; Yuan L.; Liu X.; Chang Y. T. High-efficiency in vitro and in vivo detection of Zn2+ by dye-assembled upconversion nanoparticles. J. Am. Chem. Soc. 2015, 137, 2336–2342. 10.1021/ja5115248. [DOI] [PubMed] [Google Scholar]
- Weissleder R.; Pittet M. J. Imaging in the era of molecular oncology. Nature 2008, 452, 580–589. 10.1038/nature06917. [DOI] [PMC free article] [PubMed] [Google Scholar]
- Zhang J.; Campbell R. E.; Ting A. Y.; Tsien R. Y. Creating new fluorescent probes for cell biology. Nat. Rev. Mol. Cell Biol. 2002, 3, 906–918. 10.1038/nrm976. [DOI] [PubMed] [Google Scholar]
- Zhou J.; Liu Z.; Li F. Upconversion nanophosphors for small-animal imaging. Chem. Soc. Rev. 2012, 41, 1323–1349. 10.1039/C1CS15187H. [DOI] [PubMed] [Google Scholar]
- Zhu X.; Su Q.; Feng W.; Li F. Anti-Stokes shift luminescent materials for bio-applications. Chem. Soc. Rev. 2017, 46, 1025–1039. 10.1039/C6CS00415F. [DOI] [PubMed] [Google Scholar]
- Wang F.; Liu X. Recent advances in the chemistry of lanthanide-doped upconversion nanocrystals. Chem. Soc. Rev. 2009, 38, 976–989. 10.1039/b809132n. [DOI] [PubMed] [Google Scholar]
- Resch-Genger U.; Grabolle M.; Cavaliere-Jaricot S.; Nitschke R.; Nann T. Quantum dots versus organic dyes as fluorescent labels. Nat. Methods 2008, 5, 763–775. 10.1038/nmeth.1248. [DOI] [PubMed] [Google Scholar]
- Yang Y.; Zhao Q.; Feng W.; Li F. Luminescent chemodosimeters for bioimaging. Chem. Rev. 2013, 113, 192–270. 10.1021/cr2004103. [DOI] [PubMed] [Google Scholar]
- Zou X.; Liu Y.; Zhu X.; Chen M.; Yao L.; Feng W.; Li F. An Nd3+-sensitized upconversion nanophosphor modified with a cyanine dye for the ratiometric upconversion luminescence bioimaging of hypochlorite. Nanoscale 2015, 7, 4105–4113. 10.1039/C4NR06407K. [DOI] [PubMed] [Google Scholar]
- Zhang G.; Palmer G. M.; Dewhirst M. W.; Fraser C. L. A dual-emissive-materials design concept enables tumour hypoxia imaging. Nat. Mater. 2009, 8, 747–751. 10.1038/nmat2509. [DOI] [PMC free article] [PubMed] [Google Scholar]
- Zhao Q.; Zhou X.; Cao T.; Zhang K. Y.; Yang L.; Liu S.; Liang H.; Yang H.; Li F.; Huang W. Fluorescent/phosphorescent dual-emissive conjugated polymer dots for hypoxia bioimaging. Chem. Sci. 2015, 6, 1825–1831. 10.1039/C4SC03062A. [DOI] [PMC free article] [PubMed] [Google Scholar]
- De Grand A. M.; Lomnes S. J.; Lee D. S.; Pietrzykowski M.; Ohnishi S.; Morgan T. G.; Gogbashian A.; Laurence R. G.; Frangioni J. V. Tissue-like phantoms for near-infrared fluorescence imaging system assessment and the training of surgeons. J. Biomed. Opt. 2006, 11, 014007. 10.1117/1.2170579. [DOI] [PMC free article] [PubMed] [Google Scholar]
- Cheong W. F.; Prahl S. A.; Welch A. J. A review of the optical properties of biological tissues. IEEE J. Quantum Electron. 1990, 26, 2166–2185. 10.1109/3.64354. [DOI] [Google Scholar]
- Niemz M. H.Light and matter. In Laser-Tissue Interactions, 3rd ed.; Greenbaum E., Ed.; Springer-Verlag Berlin Heidelberg Press: Berlin, Heidelberg, 2003; pp 9–35. [Google Scholar]
- Cao C.; Xue M.; Zhu X.; Yang P.; Feng W.; Li F. Energy Transfer Highway in Nd3+-Sensitized Nanoparticles for Efficient near-Infrared Bioimaging. ACS Appl. Mater. Interfaces 2017, 9, 18540–18548. 10.1021/acsami.7b04305. [DOI] [PubMed] [Google Scholar]
- Chen G.; Ohulchanskyy T. Y.; Liu S.; Law W.-C.; Wu F.; Swihart M. T.; Agren H.; Prasad P. N. Core/Shell NaGdF4:Nd3+/NaGdF4 Nanocrystals with Efficient NearInfrared to Near-Infrared Downconversion Photoluminescence for Bioimaging Applications. ACS Nano 2012, 6, 2969–2977. 10.1021/nn2042362. [DOI] [PMC free article] [PubMed] [Google Scholar]
- Xie X.; Gao N.; Deng R.; Sun Q.; Xu Q.-H.; Liu X. Mechanistic Investigation of Photon Upconversion in Nd3+-Sensitized Core–Shell Nanoparticles. J. Am. Chem. Soc. 2013, 135, 12608–12611. 10.1021/ja4075002. [DOI] [PubMed] [Google Scholar]
- Bednarkiewicz A.; Wawrzynczyk D.; Nyk M.; Strek W. Synthesis and spectral properties of colloidal Nd3+ doped NaYF4 nanocrystals. Opt. Mater. 2011, 33, 1481–1486. 10.1016/j.optmat.2011.01.006. [DOI] [Google Scholar]
- Cheng X.; Jia H.; Long T.; Feng J.; Qin J.; Li Z. A ″turn-on″ fluorescent probe for hypochlorous acid: convenient synthesis, good sensing performance, and a new design strategy by the removal of C = N isomerization. Chem. Commun. 2011, 47, 11978–11980. 10.1039/c1cc15214a. [DOI] [PubMed] [Google Scholar]
- Wei P.; Yuan W.; Xue F.; Zhou W.; Li R.; Zhang D.; Yi T. Deformylation reaction-based probe for in vivo imaging of HOCl. Chem. Sci. 2018, 9, 495–501. 10.1039/C7SC03784H. [DOI] [PMC free article] [PubMed] [Google Scholar]
- Meyer-Almes F.-J. Fluorescence lifetime based bioassays. Methods Appl. Fluoresc. 2017, 5, 042002–042032. 10.1088/2050-6120/aa7c7a. [DOI] [PubMed] [Google Scholar]
- Zheng X.; Zhu X.; Lu Y.; Zhao J.; Feng W.; Jia G.; Wang F.; Li F.; Jin D. High-Contrast Visualization of Upconversion Luminescence in Mice Using Time-Gating Approach. Anal. Chem. 2016, 88, 3449–3454. 10.1021/acs.analchem.5b04626. [DOI] [PubMed] [Google Scholar]
Associated Data
This section collects any data citations, data availability statements, or supplementary materials included in this article.


