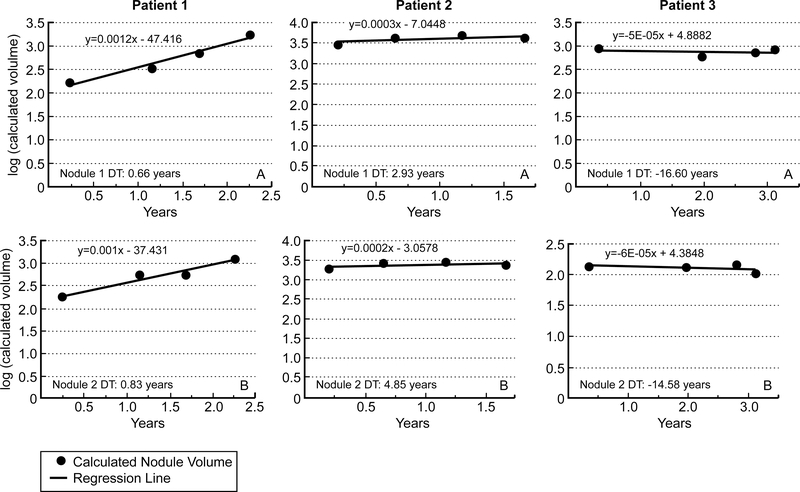
Figure 1: Representative regression lines of the two largest nodules in 3 patients with lung metastasis from thyroid cancer.
Panels A represents regression lines of the largest measured nodule while Panel B represents regression lines in the second largest nodule measured. Patient 1 presents with rapid tumor growth rate in both lung lesions, Patient 2 with slow lung lesions structural progression and patient 3 with decline in lung lesion volume with time. DT= Tumor Volume Doubling Time.

