Abstract
A pair of functional radiographs, taken at each end of the range of motion, are used to determine spinal motions. Graphic construction and computer-assisted methods are available for the radiographic analysis. The latter provides many more motion parameters. A study of lumbar spine lateral radiographs was conducted to determine errors in the motion parameters due to spinal level, radiographic quality, and errors in the two digitizing instruments. Significant differences were found in the errors due to the two digitizers when the same radiographic pair was redigitized several times. There were only minimal differences, however, between the digitizers when the radiographic films were remarked and redigitized. The error ranges (2 × SD) for the motion parameters were 1) rotation = ± 1.25°; 2) translation of the inferior posterior vertebral body corner = ± 0.86°; and 3) coordinates for the center of rotation = ± 4.3 mm. Both the spinal level and radiographic quality affected the magnitude of errors in all motion parameters.
Keywords: errors in kinematics, functional radiographs, spinal kinematics, spinal instability
In vivo functional radiographs are often used to document the kinematic measurements of spinal motion. The functional films consist of a pair of views taken at each end of a range of motion. For example, flexion–extension functional views may consist of a pair of lateral radiographs taken at full flexion and full extension. The kinematic parameters for each spinal level may include rotatory range of motion, translatory range of motion of a point on a vertebra, and the location of the center of rotation. Such data are generally obtained by graphic construction.8 Recently, mathematical formulations and computer programs have been used as an alternative to graphic construction. 1,3,5 The computer method is often more efficient and provides a comprehensive set of results. Among the three types of kinematic parameters mentioned, the center of rotation has been shown to be the most error-prone measurement, by theoretical analysis3,11 as well as by experimental determinations.4 Recently, errors present in the kinematic parameters in an in vivo functional radiographic study of the lumbar spine have been carefully analyzed.6
The purpose of the present study was to quantify the errors in a specific computer-analysis method. In this method, each vertebral body contour was identified and reduced to four corner points of a quadrangle surrounding the vertebral body. Using the principles of superposition and kinematics, the joint motions were determined. In particular, we were interested in quantifying the effects on errors in the kinematic parameters due to several factors, such as digitizer quality, radiographic quality, and vertebral level. Additionally, a manual graphic method was compared to the computer method for rotation measurement.
MATERIALS AND METHODS
Materials.
Functional lateral radiographic views of lumbar spines of healthy normal individuals were taken in passive flexion and extension.1 Of 41 radiographic sets of an equal number of healthy individuals, three sets were chosen: “normal,” “good,” and “poor.” These three pairs of films spanned the range of radiographic quality that can be expected in an everyday clinical environment. All three pairs of radiographs imaged the entire lumbar spine from L1 to L5.
Marking the Radiographic Films.
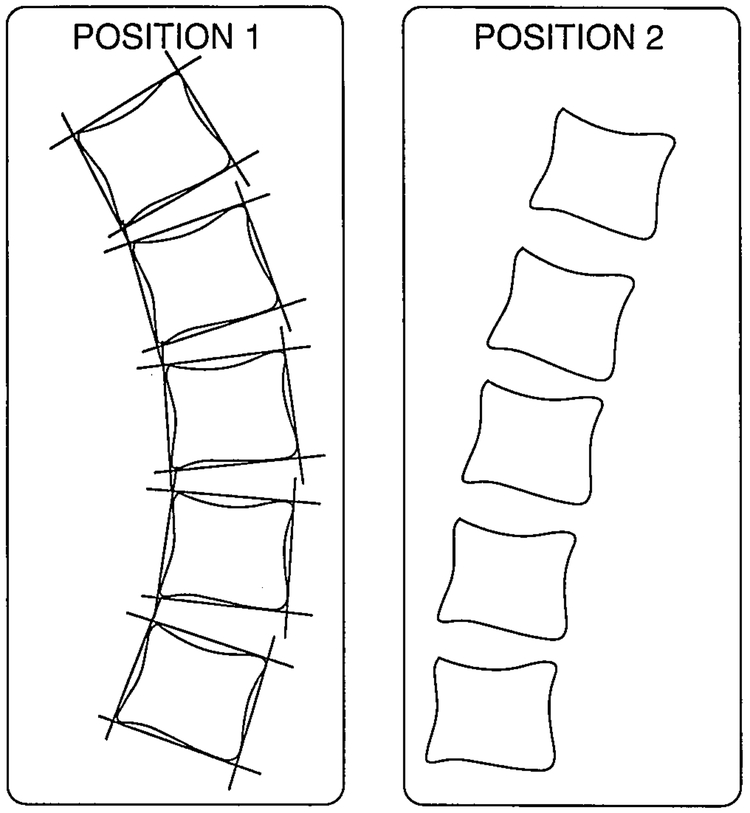
The method of marking the films was chosen with the idea that the landmarks seen on radiographic films will be easy to recognize and will have minimum variation in the two images of the same vertebra. Vertebral bodies were chosen for this purpose. Four lines, each tangential to one of the faces of the vertebral body image, were chosen to represent the vertebral body (Figure 1, Position 1). Each line was drawn with a fine pencil as a tangent to the two most prominent points on the vertebral body edge. The intersection of these lines formed a quadrangle and provided the four points that quantitatively represented the vertebral body contour for each vertebra. Next, all vertebral images seen on one radiographic film (Position 1) were marked in the described manner. Then, the second radiographic film (Position 2) was placed on the top of the marked film over a view box. The two images of the lowest vertebra were carefully superimposed, and its four points were copied over to the second view. This process was repeated for each of the five lumbar vertebrae. The end result was 20 points marked on each radiograph.
Fig 1.
Each vertebra was transformed into four points, the intersections of four tangents on each side of the vertebral body. Thus, a pair of flexion–extension radiographs of the lumbar spine was reduced to 40 points (4 points × 5 vertebrae × 2 positions). See text for details.
The Kinematic Parameters.
The basic principle for measuring kinematic parameters of intervertebral motion is the following. Consider the division of the spinal region of interest into functional spinal units (FSU). Each FSU consists of two adjacent vertebrae. Thus, the number of FSUs is one less than the number of vertebrae in the region. We will describe the method of obtaining motion of one FSU. The same technique is repeated for each FSU, thus obtaining motions of the entire spinal region. It is assumed that the motion takes place on an airplane.
Consider two vertebrae forming an FSU imaged in two positions (Figure 2A). The four points representing the contour of the lower vertebra in Position 2 are superimposed onto their corresponding points in Position 1. While doing this, the upper vertebra is also displaced from Position 2 to Position 1, but as a rigidly connected unit to the lower vertebra.
Fig 2.
A, A functional spinal unit represented by eight points is shown in two positions. B, The lower vertebral image of Position 2 is superposed on the same in Position 1. Then the two images of the upper vertebra show the intervertebral displacements represented by the seven kinematic parameters: Rx, Az, Ay, Bz, By, Cy, Cz.
The displacement indicated by the two positions of the upper vertebra is the relative intervertebral motion for this FSU (Figure 2B). In the present study, seven kinematic parameters were obtained (Figure 2B). The intervertebral rotation is designated as Rx. Az is the translation of Point A along the z-axis (posterior–anterior direction), and Ay is the translation along the y-axis (inferior–superior). Bz and By are the translations for Point B. Finally, Cz and Cy are the location coordinates for the center of Rotation C of the intervertebral motion. It may be emphasized that all kinematic parameters, except for Rx, are dependent on the coordinate system. Our coordinate system was fixed to the lower vertebra of the FSU. It was oriented so that the positive z-axis would be formed by joining the two inferior points and directed anteriorly, with the origin fixed at the posteroinferior point.2 The positive y-axis is perpendicular to the z-axis and superiorly directed. The positive x-axis is perpendicular to both the y and z axes and directed to the left.
The Procedure.
The 20 marked points on each radiograph, representing L1–L5 vertebrae, were digitized. Using a previously developed mathematical formulation,5 a computer program was written to calculate the seven kinematic parameters for each intervertebral motion, as described above. We have called this procedure the computer-assisted method.1
We used two different digitizing instruments connected, one at a time, to a personal computer (International Business Machines, Armonk, NY). The two digitizers were Scriptel (SPD-1212T, Scriptel Corp., Columbus, Ohio) and Altek (ACT22, Altek Corp., Silver Spring, Maryland). These two digitizers were chosen because they had distinctly different accuracies (0.64 mm and 0.08 mm, respectively, provided by the manufacturers) and different prices. The Altek digitizer was about five times as expensive as the Scriptel. Therefore, they represented the wide range of digitizers presently available. Both digitizers were back-lit so that the radiographs could be directly placed on the digitizing surface and the points digitized.
Definition of Error.
In every study or test conducted, repeated measures were taken of either coordinates or kinematic parameters. By plotting the data as histograms, the distribution of the observations was established to be normal. Means and standard deviations of each set of repeated measures were calculated. In the present study, one standard deviation is used to quantify the errors, and is termed the error. The error range is defined as ± 2 × SD.
Studies Conducted.
Errors in digitizers and digitizing process.
The cursor of the digitizing tablet was taped securely to the table surface, and the cursor button was delicately and repeatedly pressed. This revealed information about the inherent accuracy of the digitizer. Next, a pinprick was made in a piece of paper, and this point was repeatedly digitized. This test revealed information on the overall errors in the digitizing process of a point on an radiograph, including errors due to human effort in locating the point.
In the following studies, errors in kinematic parameters are documented using the normal set of radiographs, except when noted otherwise.
Errors Due to Redigitization.
The pair of radiographs was marked, and the marked points were digitized. Two types of studies were conducted.
The goal of the first study was to see whether there was any improvement (ie, the errors reduced) when the four points, representing each vertebra, were digitized multiple times. Each set of the four points was digitized in several ways: 1) once; 2) twice and averaged; 3) three times and averaged; 4) four times and averaged; and 5) five times and averaged. Each procedure was repeated five times. This study was conducted using only the Altek digitizer. Means and standard deviations of the coordinates of the points were computed.
In the second study, we used Method 4 from the first study as the standard procedure. The procedure was repeated five times. Means and standard deviations of the kinematic parameters were computed. This study was conducted with both the Scriptel and the Altek digitizers.
Errors Due to Remarking of the Radiographs.
The pair of radiographs was marked and digitized five times. The marks were cleaned with alcohol, and radiographs were remarked and redigitized another five times. The process was repeated for a total of seven times. Thus, a pair of radiographs was digitized 35 times (seven markings and five digitizations of each marking). Means and standard deviations of the kinematic parameters were computed.
Errors Associated with Reference Lines.
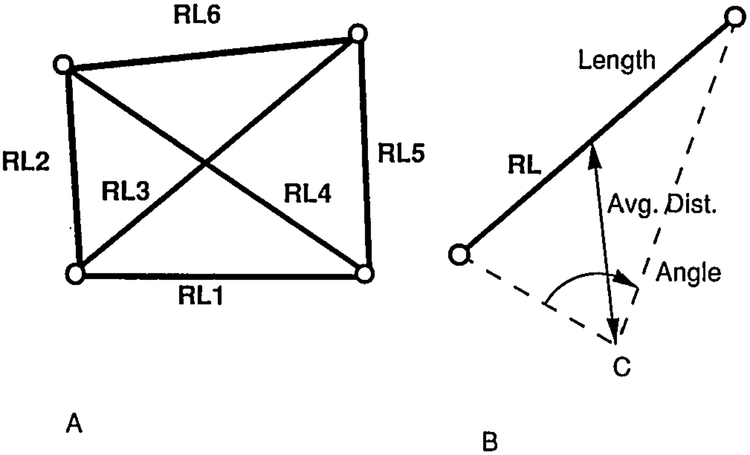
For kinematic measurements of planar motion, only two points forming a line on the vertebral body are needed. We call this line a reference line (RL). Four points were marked on each vertebral body contour, providing a total of six reference lines on the upper vertebra (Figure 3A). One answer was calculated based on data obtained from each of the six reference lines. This information gave us measures of errors associated with different reference lines, each defined by its length, orientation, and distance from the center of rotation (Figure 3B). Motivation for this documentation was a suggestion in the literature that these line parameters affect the errors in the kinematic parameters.3,4
Fig 3.
A, Six reference lines representing the four sides and two diagonals of a vertebral body. B, Each reference line is defined by three parameters: length, average distance from the center of rotation, and the angle extended at the center of rotation.
Errors Associated with the Quality of Radiographs.
In addition to the normal-quality films, the good- and poor-quality films were digitized with the higher quality Altek digitizer only. Each set was marked seven times to bring out the variation due to remarking of different-quality radiographic images; however, each marking was digitized only once because the variation, due to redigitizing any given set of marked points, is expected to be the same regardless of the radiographic quality.
Errors in the Manual and Computer Methods.
The method of graphic construction is often used to obtain the rotatory ranges of intervertebral motions from functional radiographs.8 Using the normal set of radiographs, results obtained by the manual and computer-assisted methods were compared.
RESULTS
Errors in Digitizers and the Digitizing Process (Table 1)
Table 1.
Digitizer and Point Redigitizing Errors
| Scriptel (mm) | Altek (mm) | |
|---|---|---|
| Fixed Cursor | ||
| Horizontal | 0.030 | 0.00003 |
| Vertical | 0.054 | 0.00002 |
| Average | 0.042 | 0.000025 |
| Cursor moved and relocated over a pin prick | ||
| Horizontal | 0.503 | 0.020 |
| Vertical | 0.311 | 0.024 |
| Average | 0.407 | 0.022 |
Note: The values represent standard deviations in the horizontal and vertical coordinates for the two digitizers. See text for details of tests.
The results are based on 100 digitizations on the Scriptel digitizer and 23 digitizations on the Altek digitizer. In evaluating the values given in Table 1, it is to be noted that the resolution of these two digitizers, as provided by the respective manufacturers, was 0.1 mm for Scriptel and 0.025 mm for Altek.
In the fixed cursor test, the Scriptel digitizer had a pooled standard deviation of0.04 mm, whereas that for the Altek was not measurable. In the relocation and repositioning cursor test, however, the Scriptel had a pooled standard deviation of 0.4 mm, whereas the Altek was this amount.
Redigitization of a Marked Pair of Radiographs (Table 2)
Table 2.
Redigitizing Errors
| Scriptel |
Altek |
|||
|---|---|---|---|---|
| SD | Mean | SD | Mean | |
| Rx | 0.56 | 12.7 | 0.13 | 13.5 |
| Ay | 0.32 | 3.6 | 0.06 | 4.7 |
| Az | 0.25 | 1.5 | 0.04 | 2.0 |
| By | 0.40 | 3.9 | 0.07 | 6.1 |
| Bz | 0.81 | 9.3 | 0.10 | 10.1 |
| Cy | 2.02 | 31.9 | 0.18 | 31.6 |
| Cz | 1.72 | 9.4 | 0.17 | 16.0 |
Note: Comparisons of the standard deviations and means obtained by the Scriptel and Altek digitizers. The results are based on five redigitizations of the normal radiographic pair at the L3–L4 level, using reference line RL1 for the computations.
These were based on five redigitizations of the normal radiographic pair. It was noted that, although the mean values due to the two digitizers were not very different, there were significant differences in the standard deviations. On average, the error seemed to be about 10 times worse for the less accurate digitizer.
Errors Due to Remarking of Radiographs (Table 3)
Table 3.
Remarking Errors
| Scriptel |
Altek |
|||
|---|---|---|---|---|
| SD | Mean | SD | Mean | |
| Rx | 0.71 | 13.1 | 0.63 | 12.5 |
| Ay | 0.71 | 4.1 | 0.43 | 3.8 |
| Az | 0.64 | 2.0 | 0.43 | 2.4 |
| By | 0.82 | 4.9 | 0.51 | 5.1 |
| Bz | 0.98 | 9.8 | 0.56 | 9.9 |
| Cy | 1.80 | 31.6 | 2.68 | 28.9 |
| Cz | 2.68 | 12.4 | 1.58 | 12.9 |
Note: Comparisons of the standard deviations and means obtained by the Scriptel and Altek digitizers. The results are based on seven remarkings and five redigitizations of each marking of the normal radiographic pair at the L3–L4 level, using reference line RL1 for the computation.
The major point to note in these results for the two digitizers is the similarity between the magnitude of the standard deviations. For most kinematic parameters, the errors in the less accurate digitizer were only about 50% more than those for the more accurate digitizer. In the case of rotation, the Scriptel errors were only 10% more.
Errors Associated with Reference Lines
The results due to each of the six reference lines were such that they may be pooled into two groups. The group with the least errors in most kinematic parameters contained lines RL1, RL3, RL4, and RL6; the second group, containing lines RL2 and RL5, resulted in significantly larger errors. Sometimes the computation procedure for lines RL2 and RL5 completely broke down, resulting in unreasonable values.
Variation with the Level (Table 4)
Table 4.
Error Variation with Level
| L1–L2 |
L2–L3 |
L3–L4 |
L4–L5 |
|||||
|---|---|---|---|---|---|---|---|---|
| SD | Mean | SD | Mean | SD | Mean | SD | Mean | |
| Rx | 1.21 | 8.2 | 0.75 | 11.8 | 0.63 | 12.5 | 1.33 | 16.7 |
| Ay | 0.74 | 3.5 | 0.79 | 4.2 | 0.43 | 3.8 | 0.72 | 6.0 |
| Az | 0.59 | 1.4 | 0.39 | 2.3 | 0.43 | 2.4 | 0.36 | 2.1 |
| By | 1.07 | 3.1 | 0.63 | 4.3 | 0.51 | 5.1 | 0.75 | 8.0 |
| Bz | 1.07 | 6.5 | 0.48 | 9.3 | 0.56 | 9.9 | 0.86 | 11.3 |
| Cy | 3.63 | 31.1 | 2.33 | 31.1 | 2.68 | 28.9 | 1.56 | 31.9 |
| Cz | 3.66 | 22.8 | 3.00 | 15.8 | 1.58 | 12.9 | 1.32 | 16.0 |
Note: Standard deviations and means varying with spinal level. The results are based on seven remarkings and five redigitizations of each marking of the normal radiographic pair at the L3–L4 level, using reference line RL1 for the computation.
Based on seven remarkings, each remarking digitized five times, the means and standard deviations were shown as functions of the four lumbar spine levels. The results seemed to improve from L1–L2 to L3–L4.
Errors Associated with the Quality of Radiographs (Table 5)
Table 5.
Error Variation with Quality of Radiograph
| Good |
Normal |
Poor |
||||
|---|---|---|---|---|---|---|
| SD | Mean | SD | Mean | SD | Mean | |
| Rx | 0.56 | 15.4 | 0.63 | 12.5 | 0.98 | 17.19 |
| Ay | 0.39 | 4.4 | 0.43 | 3.8 | 0.87 | 4.64 |
| Az | 0.45 | 2.5 | 0.43 | 2.4 | 0.86 | 4.43 |
| By | 0.36 | 5.5 | 0.51 | 5.1 | 0.79 | 6.17 |
| Bz | 0.53 | 11.9 | 0.56 | 9.9 | 0.81 | 14.73 |
| Cy | 1.96 | 29.7 | 2.68 | 28.9 | 3.37 | 29.10 |
| Cz | 0.86 | 12.7 | 1.58 | 12.9 | 1.85 | 9.90 |
Note: Standard deviations and means varying with radiographic quality. The results are based on seven remarkings and five redigitizations (only one digitization of "good" and "poor" radiographs) of each marking of the normal radiographic pair at the L3–L4 level, using reference line RL1 for the computation.
The quality of the radiographic images played a significant role in the magnitude of the associated errors. Poor radiographic films had 50–100% more errors than the normal radiographs, whereas the improvement from normal to good was small.
Errors in the Manual and Computer Methods for the Angle of Rotation (Table 6)
Table 6.
Errors in Manual and Computerized Methods
| Graphical Construction Method |
Computer-Assisted Method |
|||
|---|---|---|---|---|
| SD | Mean | SD | Mean | |
| L1–L2 | 1.0 | 8.0 | 1.21 | 8.2 |
| L2–L3 | 1.1 | 10.9 | 0.75 | 11.8 |
| L3–L4 | 0.5 | 13.1 | 0.63 | 12.5 |
| L4–L5 | 0.7 | 16.5 | 1.33 | 16.7 |
| Average | 0.83 | 12.1 | 0.98 | 12.2 |
Note: Standard deviations and means of the angle of rotation (Rx) using the graphical construction method and computer-assisted method.
The standard deviations in the computer-assisted and manual methods were of the same magnitude.
DISCUSSION
Radiographic methods are used clinically to monitor spinal motions, with the purpose of determining abnormal motion patterns that may be indicators of spinal instability. In general, the spinal motion is three-dimensional, and therefore stereoradiography has been used both with9 and without7,10 the implanted metallic markers for the measurements of spinal motion. The motion measurement accuracy is certainly enhanced with the use of metal markers, but at the cost of invasiveness. The most common radiographic method, however, although limited to quantifying the intervertebral motions in one plane, remains the functional radiographs.
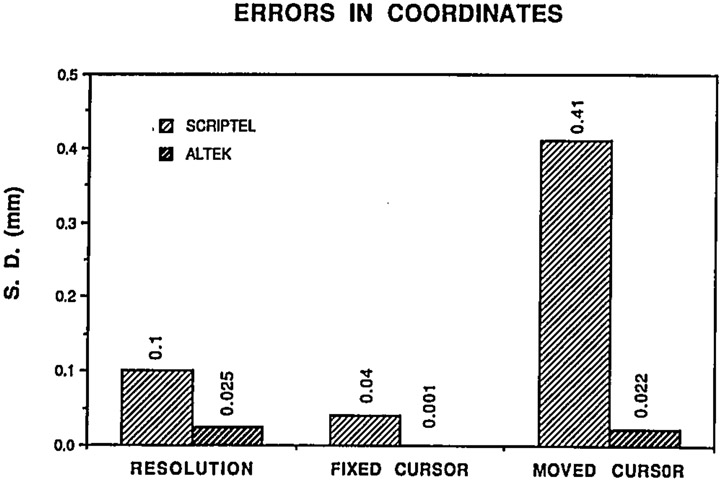
One of the goals of the present study was to evaluate the quality of the digitizers and its effect on the magnitude of errors in the kinematic parameters computed from the functional radiographs. It is interesting to note that the resolution values provided by the manufacturers of digitizers have little to do with the digitizers’ accuracies (Figure 4). Repeatability of the coordinate measurements with the cursor of the digitizer fixed in position was rather good. When the point was redigitized, however, after moving and relocating the cursor, the error in the less accurate digitizer was four times as much as the resolution, whereas the more accurate digitizer reached its resolution value.
Fig 4.
Errors in the form of standard deviations in repeated measurements of a point digitized with the digitizing cursor either fixed or moved and repositioned. Comparison is made between the results of the Scriptel and Altek digitizers. Also shown are the resolution values.
But how do the digitizers’ accuracies affect the kinematic parameters? We attempted to answer this question in two parts:
1. Redigitization. The normal pair of radiographic films was marked, and each was digitized five times. The variation in all the kinematic parameters, using the two digitizers, was determined.
2. Remarking. The procedure outlined in Step 1 was repeated seven times (each radiograph remarked seven times and each remarking digitized five times).
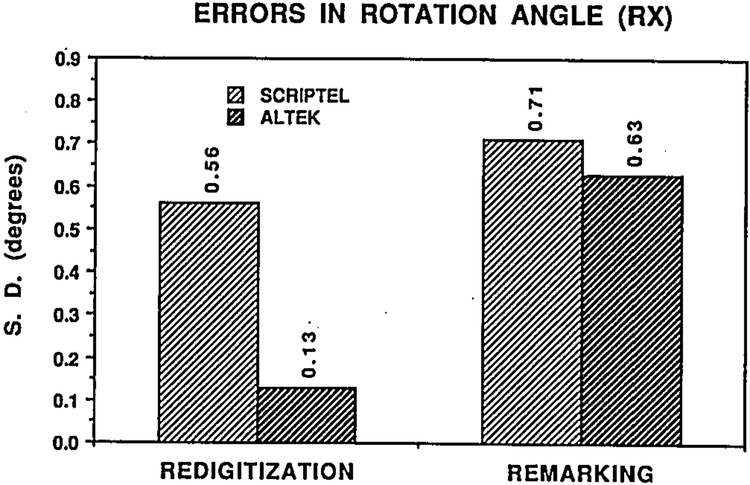
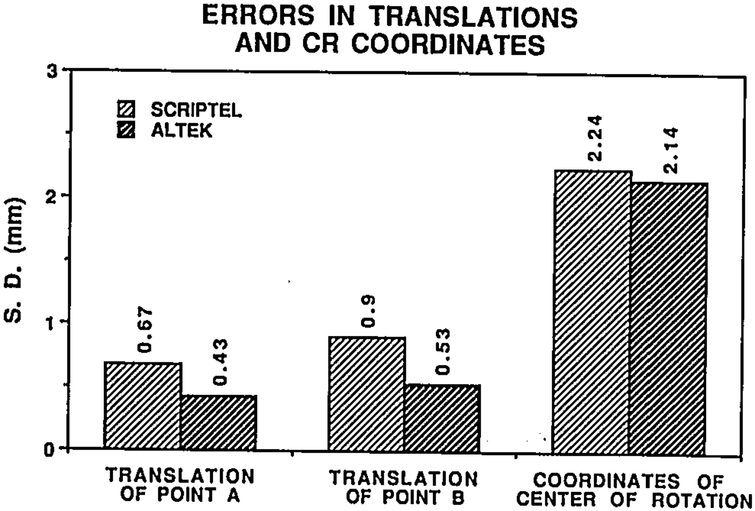
The comparisons in the results for rotation Rx are shown in Figure 5. It was noted that when a pair of radiographic films was redigitized, the differences between the two digitizers were quite significant. The differences were insignificant, however, when the results of the remarkings were compared. Another comparison of the two digitizers, based on averages of seven remarkings and five redigitizations, is shown in Figure 6. In this figure, the errors in the linear kinematic parameters are compared. The Scriptel errors seem to be larger than the Altek errors, but the Student t-test comparison did not disprove the null-hypothesis at 95% confidence level. Thus, the major source of errors in the computed kinematic parameters seems to be the manual process of radiographic film superimposition and marking of films, not the accuracy of the digitizer. This also has been found in a previous study.6 Therefore, great care should be taken in superimposing the two radiographic films so that the two images of the same vertebra are as closely matched as possible. This will minimize the remarking errors in the computed kinematic parameters.
Fig 5.
Errors in the form of standard deviations for the angle of rotation computed from normal lumbar spine radiographs. Redigitization errors are for five repetitions; the remarking errors are for seven repetitions.
Fig 6.
Errors in the form of standard deviations of translations of Points A and B, and the errors in the coordinates of the center of rotation, are given for the Scriptel and Altek digitizers.
Larger errors were associated with the end functional spinal units (L1–L2 and L4–L5) compared with those in the middle. This may be explained on the basis that, as the radiographic beam was centered in the middle of the lumbar spine, the quality of the images in that region was optimal.
We defined the error as one standard deviation. Unfortunately, the errors are seldom defined in in vivo studies. Often it is simply stated that the error or accuracy in the study was so many degrees, millimeters, or percentages. Because the words “error” and “accuracy” mean different things to different people, the lack of specific definition makes it difficult to compare our results to those of other studies.
How can our findings be used clinically? We attempted to use the results in interpreting clinical measurements of spinal motion and found a 0.63° standard deviation of the angle of rotation. This can be interpreted in two ways. First, if one takes a pair of functional radiographs and computes the intervertebral motion at a given level, the true value will lie ±1.25° with 95% certainty. Second, the minimum change in the angle of rotation that is significant must be greater than 1.25°. For example, if we were to use the functional radiographs to monitor the progress of treatment in a patient, then the measured change must be greater than the error itself. Similar arguments hold for other kinematic parameters. Thus, for the measurement of translation of a point on the vertebra, the measured change must be greater than ±0.86 mm and ± 1.07 mm for Point A and Point B, respectively. Similarly, the location of the center of rotation in the inferosuperior direction carries with it a maximum error of ±5.4 mm, and a similar value for the anteroposterior direction is ±3.2 mm. It should be emphasized that the repeated measures in the present study were the remarkings of the same pair of radiographs. This is not the case in the clinical situation where radiographic sets are taken at two different times. Therefore, our measurements of errors do not include the “biological” variability that is present when the functional test is repeated on the same patient at different times. The estimate of this variation is presently unknown. Thus, our estimates provide the lower limit of errors associated with each kinematic parameter.
CONCLUSIONS
Based on the study of three qualities of lumbar spine functional radiographs, two qualities of digitizers, four spinal levels, and use of a computer-assisted method of kinematic analysis of lateral radiographic views, the following conclusions may be drawn.
1. Redigitizing the same radiographic pair results in very small errors.
2. Remarking the radiographs results in significantly larger errors.
3. A major component in the errors of the kinematic parameters is the manual superposition and marking of radiographic films.
4. Larger errors are associated with motions of end spinal levels in the lumbar spine, namely L1–L2 and L4–L5.
5. The quality of the radiographic films affects the errors in kine-, matic parameters.
6. The graphic construction method and the computer-assisted method were equally good at determining the angle of rotation.
Acknowledgments
Supported in part by Schulthess Klinik Research Fund, NIH Grants AR3036I and AR39209, and CDC Injury Grant R49/CCR103551.
REFERENCES
- 1.Dvořák J, Panjabi MM, Chang DG, Theiler R, Grab D. Functional radiographic diagnosis of the lumbar spine: Flexion/extension and lateral bending. Spine 16:562–571, 1991 [DOI] [PMC free article] [PubMed] [Google Scholar]
- 2.Panjabi MM, White AA, Brand RA: A note on defining body part configurations. J Biomech 7:385–387, 1974 [DOI] [PubMed] [Google Scholar]
- 3.Panjabi MM: Centers and angles of rotation of body joints: A study of errors and optimization. J Biomech 12:911–920, 1979 [DOI] [PubMed] [Google Scholar]
- 4.Panjabi MM, Goel VK, Walters, Schick S: Errors in the center and angle of a joint: An experimental study. J Biomech Eng 104:232–237, 1982 [DOI] [PubMed] [Google Scholar]
- 5.Panjabi MM, Summers DJ, Duranceau JS, et al. : Evaluation of the radiographic methods of flexion–extension spinal motion analysis. Presented at the 13th Annual Cervical Spine Research Society Meeting, Cambridge, MA, 1985 [Google Scholar]
- 6.Pearcy MJ, Bogduk N: Instantaneous axes of rotation of the lumbar intervertebral joints. Spine 13:1033–1041, 1988 [DOI] [PubMed] [Google Scholar]
- 7.Pearcy M, Portek I, Shepherd J: Three-dimensional x-ray analysis of normal movement in the lumbar spine. Spine 9:294–297, 1984 [DOI] [PubMed] [Google Scholar]
- 8.Penning L: Functional pathology of the cervical spine. Vol 59, Amsterdam, Excerpta Mcdica, 1968, pp 1–25 [Google Scholar]
- 9.Selvik G, Olssen TH, Willner S: High accuracy analysis of movements of the spine with the aid of a roentgen stereophotogrammetric method Biomechanics V-B. Edited by Komi PV. Baltimore, University Park Press, 1976, pp 502–507 [Google Scholar]
- 10.Stokes IAF, Wilder DG, Frymoyer JW, Pope MH: Assessment of patients with low back pain by biplanar radiographic measurement of intervertebral motion. Spine 6:233–240, 1980 [DOI] [PubMed] [Google Scholar]
- 11.Walter SD, Panjabi MM: Experimental errors in the observation of joint mechanics. Technometrics 30 (1):71–78, 1988 [Google Scholar]


