Abstract
We combined spectroscopic ellipsometry, Raman scattering spectroscopy, and first-principles calculations to explore the optical properties of YBaCuFeO5 single crystals. Measuring the optical absorption spectrum of YBaCuFeO5 at room temperature revealed a direct optical band gap at approximately 1.41 eV and five bands near 1.69, 2.47, 3.16, 4.26, and 5.54 eV. Based on first-principles calculations, the observed optical excitations were appropriately assigned. Analysis of the temperature dependence of the band gap indicated anomalies in antiferromagnetic phase transition at 455 and 175 K. Additionally, a hardening in the frequency of the Eg phonon mode was observed at 175 K. The value of the spin–phonon coupling constant was 15.7 mRy/Å2. These results suggest a complex nature of spin–charge–lattice interactions in YBaCuFeO5.
Introduction
Since YBaCuFeO5 was synthesized in 19881 and treated as an impurity phase in the Fe-doped high-temperature copper oxides of YBa2Cu3O7, this compound has received substantial research attention because of its complex physical properties and potential practical applications2–14. YBaCuFeO5 is tetragonal in structure and belongs to the P4/mmm space group1,4,6,7. The building block consists of a CuFeO10 bilayer of corner-sharing CuO5 and FeO5 square pyramids. Y3+ cations separate the CuFeO10 bilayer, and the Ba2+ ions are located within the bilayer; this structure resembles the crystal structure in YBa2Cu3O7. Much of the research interest concerning YBaCuFeO5 has been focused on the compound’s complex magnetic structures2,4–9. YBaCuFeO5 displays a commensurate antiferromagnetic structure at approximately TN1 = 440 K and an incommensurate spiral antiferromagnetic structure at temperatures below TN2 = 230 K. Recent reports of magnetism-driven ferroelectricity at TN2 = 230 K and a large electric polarization (0.4 μC/cm2) observed in YBaCuFeO510,11,13 have led to further explorations of the possibilities for new functional devices based on the magnetoelectric effect of this material15–18.
Numerous studies have examined magnetization, Mossbauer, neutron powder diffraction, and dielectric measurements, but the optical and phonon properties of YBaCuFeO5 have remained largely unexplored3. Moreover, previous studies on YBaCuFeO5 have been limited to powder samples. Recently, we modified the traveling-solvent floating-zone technique and used it to synthesize high-quality YBaCuFeO5 single crystals19. Consecutive anisotropic antiferromagnetic phase transitions were observed at approximately 455 and 170 K19,20. In the present study, we combined spectroscopic ellipsometry, Raman scattering spectroscopy, and first-principles calculations to determine the electronic structure and lattice dynamics of YBaCuFeO5. Clarification of the microscopic characteristics that govern the material’s optical and phononic excitations is critical for further development of device applications. In this study, we also examined the correlation of the optical response with the magnetic phase transitions of YBaCuFeO5. The findings of this investigation may help elucidate the nature of spin–charge–lattice coupling in this system and in related multiferroic materials.
Technical Details
Experiment
YBaCuFeO5 single crystals were grown using a modified traveling-solvent floating-zone method. The details of sample preparation were as reported previously19. The crystals that formed on the bc-surface exhibited disk shapes of 5-mm diameter and 2-mm thickness. The (100) axis is the floating-zone growth direction. For each batch, crystals were characterized using synchrotron x-ray powder diffraction, dc resistivity, and magnetization measurements19,20. Figure 1 presents the profiles for x-ray powder diffraction of YBaCuFeO5 at 300 and 90 K. The spectra did not change significantly with temperature, which implied that no structural phase transition occurred within the temperature range investigated. Only after cooling below 300 K did YBaCuFeO5 exhibit a decrease in the a and c lattice constants.
Figure 1.
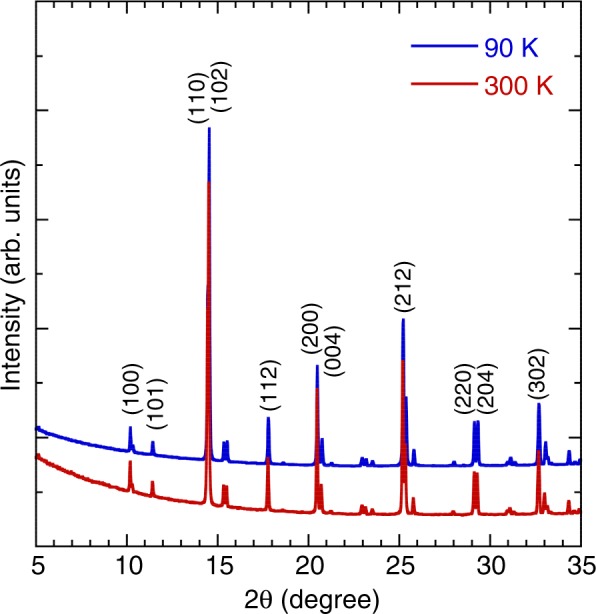
X-ray powder diffraction patterns of YBaCuFeO5 at 300 and 90 K.
Spectroscopic ellipsometric measurements were conducted under angles of incidence between 60° and 75° and over a spectral range of 0.73 to 6.42 eV using a Woollam M-2000U ellipsometer. For temperature-dependent measurements between 4.3 and 500 K, the ellipsometer was equipped with an ultrahigh-vacuum cryostat. Raman scattering experiments were performed in a backscattering geometry with a laser-excitation wavelength of 532 nm. The linearly polarized light was focused to a 3-μm-diameter spot on the sample surface, and the scattered light was collected and dispersed using a SENTERRA spectrometer equipped with a 1024-pixel-wide charge-coupled detector. The polarizations of incident and scattered light were set such that the incident and scattered lights were parallel and perpendicular (cross) to each other. The spectral resolutions achieved using these instruments are typically less than 1 cm−1. To avoid heating effects, the laser power was set to 0.2 mW. The sample was placed in a continuous-flow helium cryostat and Linkam heating stage, enabling measurements of the sample under temperatures of 10–700 K.
Theoretical methods
To investigate the electronic structure of YBaCuFeO5, we modeled several YBaCuFeO5 systems using density functional theory (DFT) calculations in the Vienna ab initio Simulation Package (VASP)21,22. The electron wavefunctions were expanded in plane wave basis sets with an energy cutoff of 550 eV. Perdew–Burke–Ernzerhof (PBE) functional approximation was applied to the electron exchange correlation energy23. The 5s4p4d4s, 6s5s5p, 4s3d, 4s3d, and 2s2p orbitals of Y, Ba, Cu, Fe, and O atom species were treated as valence electrons, and the pseudopotentials of core electrons were generated using the projector augmented-wave method24,25. A 5 × 5 × 3 gamma-centered k-point mesh was applied to establish the optimized structures and absorption coefficients. The bandgap sizes of metal oxides are underestimated in DFT calculations; therefore, additional Hubbard-U potentials26 were applied to Cu (U = 1 eV, J = 0 eV) and Fe (U = 6 eV, J = 0 eV) atom species. To enable observation of the G-type antiferromagnetic feature and of variation in the arrangement of Cu and Fe atoms, models with supercells comprising 2 × 2 × 2 formula cells were constructed (see supplementary information). In terms of one formula cell, the optimized lattice constants, a and c, ranged from 3.884 to 3.917 Å and 7.786 to 7.847 Å; these values were in favorable agreement with the experimental data20.
Results and Discussion
Electronic excitations
Figure 2(a) presents the room-temperature real ε1 and imaginary ε2 parts of the dielectric function ε(ω) of YBaCuFeO5 obtained from spectroscopic ellipsometry analysis. We observed a dispersive response in ε1 with an overall positive value, which reflected typical behavior for a semiconductor. Optical transitions were identifiable in the spectra based on resonance and antiresonance features, which appeared at the same energy in ε2 and ε1, respectively. Notably, the spectrum ε2 of YBaCuFeO5 was dominated by optical transitions, for which detailed analysis is presented subsequently. We fitted the spectra reasonably well using a classical Lorentzian model for the complex dielectric function27
| 1 |
where ωj, γj, and ωpj represent the frequency, damping, and oscillator strength of the jth Lorentzian contribution. ε∞ is the permittivity due to high-frequency electronic excitations. Figure 2(b) illustrates the room-temperature optical absorption spectrum. This absorption spectrum can also be modeled reasonably well by using Lorentzian oscillators. As the photon energies increased, the absorption gradually increased; three bands were manifested near 1.69, 2.47, and 3.16 eV; a maximum value was reached at approximately 4.26 eV, and a higher band was manifested at approximately 5.54 eV. In a normal solid, the absorption coefficient α(E) is accepted and is based on contributions from both direct and indirect band gap transitions28. The absorption coefficient is given by
| 2 |
where Eg,dir and Eg,ind are the magnitudes of direct and indirect gaps, respectively; Eph is the emitted (absorbed) phonon energy, and A and B are constants. This model, which assumes a simple band shape, enables extraction of the direct energy gap when α2 is plotted as a function of photon energy. The inset of Fig. 2(b) illustrates the direct band gap of 1.41 ± 0.01 eV at 300 K.
Figure 2.
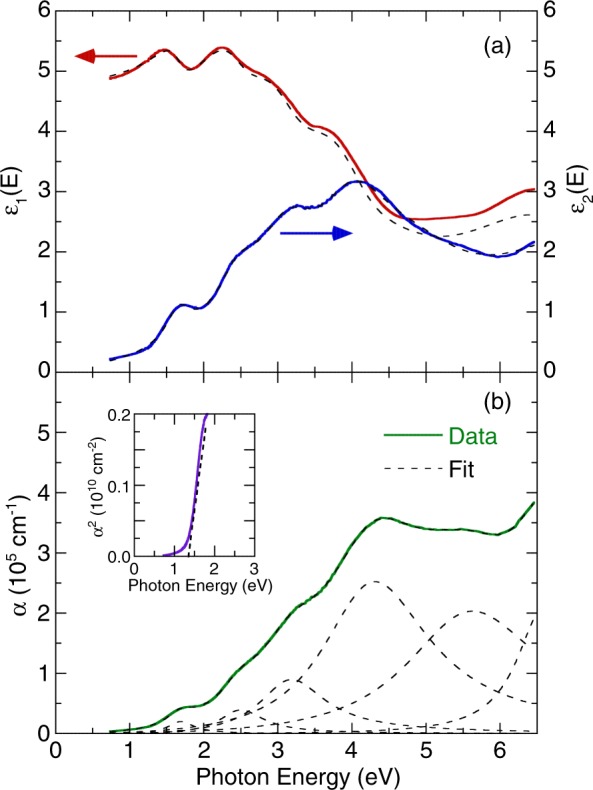
(a) Dielectric function for YBaCuFeO5 at room temperature. (b) Optical absorption coefficient of YBaCuFeO5 at room temperature. The dashed lines indicate the best fit from the Lorentzian model. The inset illustrates the direct band gap analysis of YBaCuFeO5.
Figure 3 illustrates the temperature dependence of the optical absorption spectra. As the temperature was lowered, all optical absorptions exhibited shifts of the peak positions to higher energies and narrowing of linewidths. Figure 4 indicates the temperature dependence of the energy band gap. The gap became hardening as the temperature decreased. In principle, the observed blueshift value of the band gap energy with decreasing temperature in semiconductors can be described using the Bose–Einstein model29
| 3 |
where Eg(0) is the band gap energy at 0 K; aB represents the strength of the electron–phonon interactions; and ΘB is the average phonon temperature. Our fitting results indicated that the band gap energy toward 0 K was approximately 1.45 ± 0.01 eV. The strength of the electron–phonon interactions aB and the average phonon temperature ΘB were 102 meV and 496 K, respectively. These values are larger than those obtained for other multiferroic oxides, such as BiFeO330,31, thus reflecting a strong electron-phonon interaction in YBaCuFeO5. As is evident from Fig. 4, the Bose–Einstein model reproduced the overall temperature dependence of the band gap in YBaCuFeO5 satisfactorily. However, the band gap deviated from the theoretical prediction at 455 and 175 K, which suggested spin–charge interactions. Similar coupling behavior has been observed in other multiferroic materials, such as BiFeO331,32, h-LuFeO333, and LuFe2O434.
Figure 3.
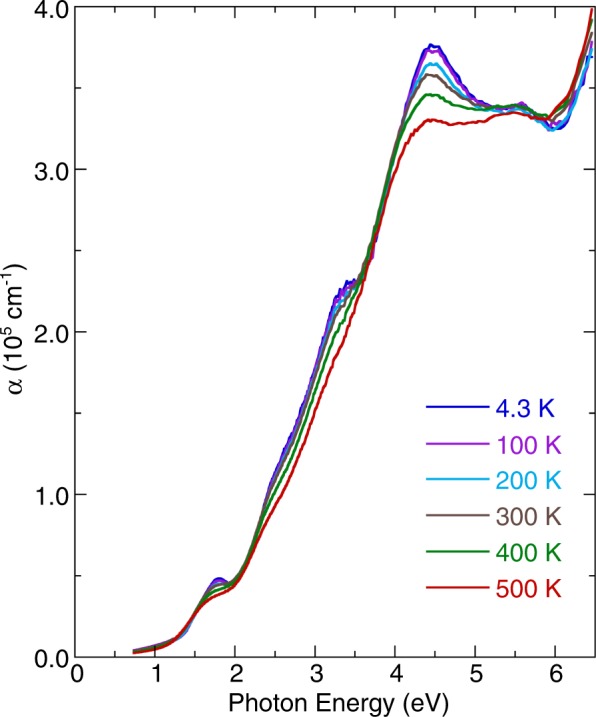
Temperature dependence of the optical absorption spectra of YBaCuFeO5.
Figure 4.
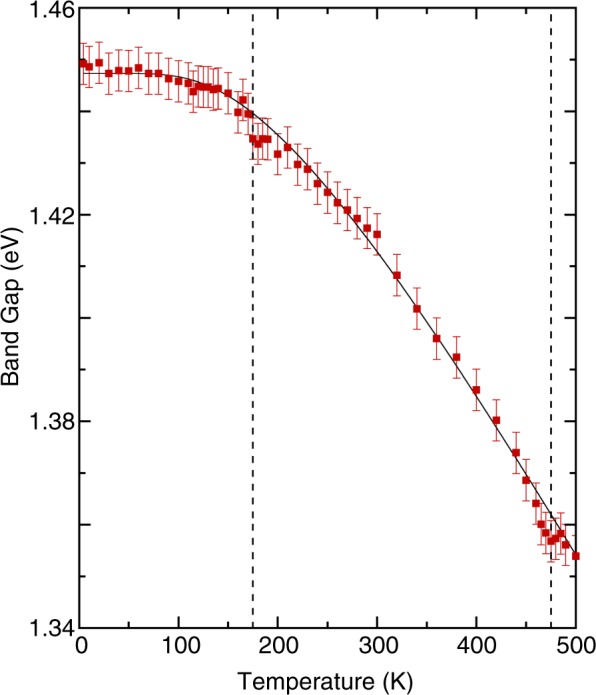
The energy band gap as a function of temperature for YBaCuFeO5. The thin solid line indicates the result of the fitting using the Bose–Einstein model. Vertical dashed lines denote transition temperatures.
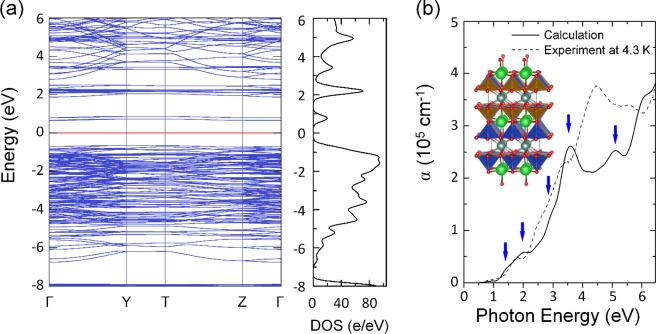
To understand the nature of the observed absorption peaks in YBaCuFeO5, we calculated the electronic band structure, density of states (DOS), and optical absorption coefficient, and the results are presented in Fig. 5. In a previous report13, Morin et al. simulated YBaCuFeO5 models using DFT calculations with 10 arrangements of Cu and Fe atoms. However, optical absorption spectra and electronic band structure were not assessed in their work, and these properties are critical for analyzing the optical properties of YBaCuFeO5. We reinspected the crystal structure and electronic properties of the five models with the lowest energies from those in the study of Morin et al.13. In addition, we examined two models of slightly higher energies than the five previously mentioned models (see supplementary information). These two models were not investigated by Morin et al. We discovered that only one of the new models could reproduce the absorption spectrum presented in Fig. 2(b). The structure of the simulation model is depicted in Fig. 5(b).
Figure 5.
(a) Calculated electronic band structure, density of states (DOS), and (b) calculated and experimental optical absorption coefficient of YBaCuFeO5. The inset in (b) depicts the atomic structure of the simulation model with dark cyan, green, blue, brown, and red spheres representing the Y, Ba, Cu, Fe, and O atoms, respectively. The pyramids formed by oxygen atoms embracing Cu and Fe atoms are also highlighted.
The electronic band structure of YBaCuFeO5 (Fig. 5(a)) revealed that both the valence-band maximum and the conduction-band minimum were flat from the Γ to Y points of the Brillouin zone. The calculated direct band gap of YBaCuFeO5 was approximately 1.36 eV, which was consistent with the experimental results. Furthermore, the shape and peak positions of the calculated optical coefficient spectrum (Fig. 5(b)) exhibited favorable agreement with the experimental data. Electronic excitations occurred at approximately 1.45, 2.0, 2.9, 3.5, and 5.1 eV. According to the DOS analysis (see supplementary information), the observed excitation near 1.45 eV was due to transitions from the 3dxy orbitals of Cu or Fe atoms to the 3dx2−y2 orbitals of Cu or Fe atoms. The absorption peak near 2.0 eV was attributed to transitions from the 3dxz/yz orbitals of Cu or Fe atoms to the 3dx2−y2 orbitals of Cu or Fe atoms. These symmetry-forbidden d-d transitions were possible due to strong hybridization of Cu or Fe 3d and O 2p states. The observed 2.9-, 3.5-, and 5.1-eV absorption peaks were assigned to the charge–transfer excitations from the 2p orbitals of O atoms to the 3d orbitals of Cu or Fe atoms.
Vibrational properties
Figure 6(a) depicts the room-temperature Raman scattering spectrum of YBaCuFeO5. The spectrum comprised six first-order Raman phonon modes. We fitted these phonon peaks using a standard Lorentzian profile. According to factor group analysis, the structure of YBaCuFeO5 is tetragonal (space group P4/mmm) with one formula unit per primitive cell. The irreducible representation of the phonon modes at the center of the Brillouin zone is given by Γ = 2A1g + B1g + 3Eg + 5A2u + 6Eu + B2u3. These modes are classified as Raman active (2A1g + B1g + 3Eg), infrared active (4A2u + 5Eu), acoustic (A2u + Eu), and silent (B2u). The inset of Fig. 6(a) illustrates polarized Raman scattering spectra of parallel and cross measurements. The 456 and 675 cm−1 modes exhibited stronger intensities in the parallel configuration, indicating that they were of A1g characters. By contrast, the 579 cm−1 mode in cross geometry was stronger than other phonon peaks, thus demonstrating Eg symmetry. The Eg mode involves in-plane O-Cu/Fe-O bending motions, whereas the A1g mode results from out-of-plane Cu/Fe-O stretching motions3. Additionally, the low-intensity broad phonon mode observed at approximately 1267 cm−1 should be ascribed to multiphonon processes35–37. In the present study, the 675 cm−1 A1g phonon mode exhibited an asymmetric line shape, indicating a strong interaction between the lattice vibrations and a magnetic continuum. As presented in the inset of Fig. 6(b), this mode was fitted using a standard Fano profile38 as follows: I(ω) = I0 (ε + q)2/(1 + ε2), where ε = (ω – ω0)/Γ; ω0 is the phonon frequency; Γ is the linewidth; and q is the asymmetry factor of the phonon mode.
Figure 6.
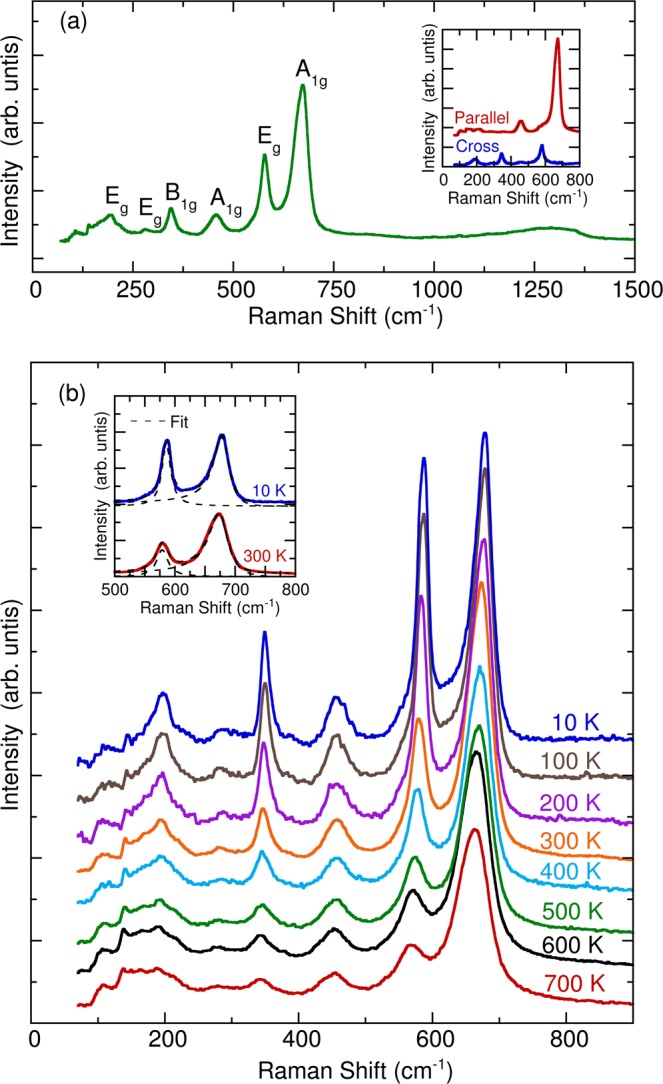
(a) Unpolarized Raman scattering spectrum of YBaCuFeO5 at room temperature. The inset illustrates the Raman scattering spectra in parallel and cross scattering geometries. (b) Temperature dependence of unpolarized Raman scattering spectra of YBaCuFeO5. The inset denotes the fitting results of spectra at 300 and 10 K using the Lorentzian and Fano models.
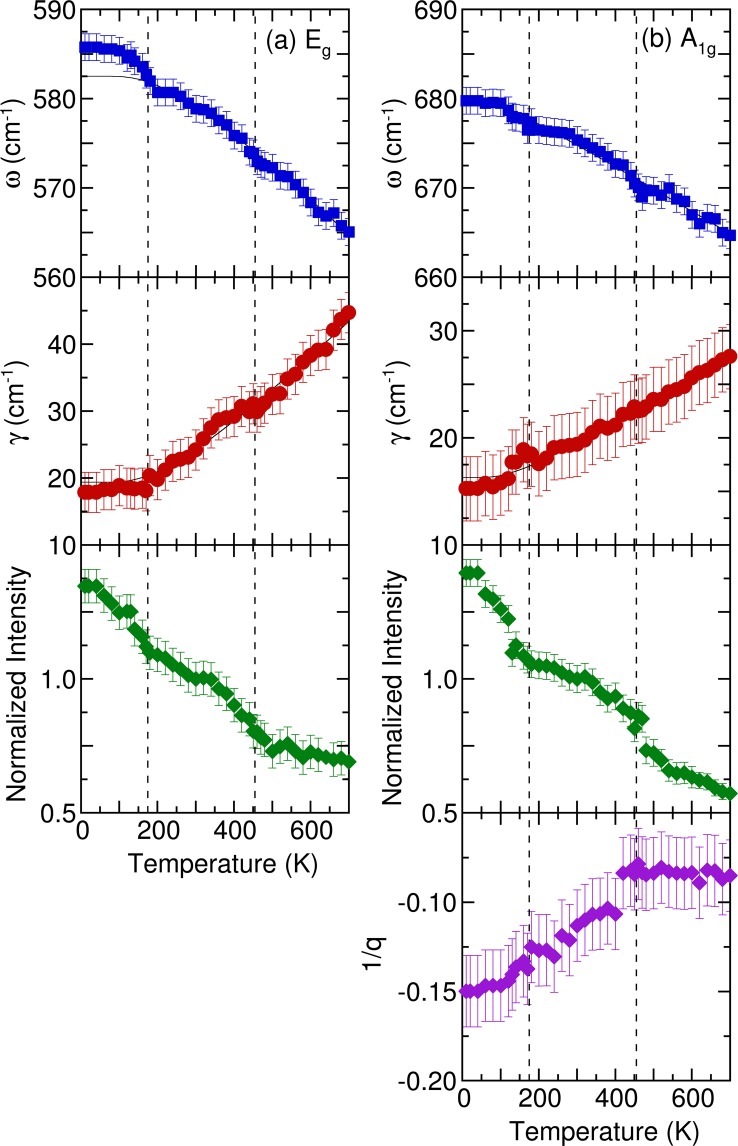
Figure 6(b) indicates the temperature dependence of the Raman scattering spectra of YBaCuFeO5. With decreasing temperatures, the peak positions of all phonon modes shifted to higher frequencies, and the resonance linewidth narrowed. However, the phonon parameters of the 579 cm−1 Eg and 675 cm−1 A1g modes behaved peculiarly at 455 and 175 K. Figure 7 further illustrates the frequency, linewidth, normalized intensity, and asymmetry factors of these two modes as functions of temperature. The frequencies and linewidths of the 579 cm−1 Eg and 675 cm−1 A1g modes changed discontinuously at 455 and 175 K. Furthermore, the oscillator strengths of the two modes increased below 455 K. In a normal anharmonic solid, a nearly temperature-independent oscillator strength is expected, and at decreasing temperature, the phonon frequency should increase while linewidth decreases. Anharmonic interactions are relevant to high-order terms of atomic vibrations, which are beyond traditional harmonic terms. The temperature-dependent phonon frequency and linewidth can be written as39
| 4 |
and
| 5 |
where ωo and γo are the intrinsic frequency of the optical phonon mode and the linewidth broadening that results from defects. Parameters A and B are the anharmonic coefficients, and corresponds to the thermal population factor of acoustic modes. For analysis of anharmonic contributions to the 579 cm−1 Eg mode, the values of ωo (≈582.5 cm−1), γo (≈19 cm−1), A (≈−4.5), and B (≈1.8) were determined. For the 675 cm−1 A1g mode, the values of ωo (≈682.9 cm−1), γo (≈16 cm−1), A (≈−4.9), and B (≈1.2) were determined. Parameter A was negative, indicating that with an increase in temperature, the peak shifted to a lower frequency because of anharmonic phonon decay. By contrast, parameter B was positive, reflecting linewidth narrowing with a decrease in the temperature. The thin solid lines in Fig. 7(a,b) represent theoretical predictions based on Eqs (4, 5). The 675 cm−1 A1g mode exhibited a slight deviation from the usual anharmonic contribution to the temperature dependence of the phonon frequency and linewidth through the 455 and 175 K antiferromagnetic ordering transitions. By contrast, the 579 cm−1 Eg mode hardened significantly below 175 K. Because the YBaCuFeO5 exhibited no drastic temperature dependence in terms of crystal structure and lattice parameters, the phonon anomalies below the antiferromagnetic ordering temperature were attributed to spin–phonon interactions. Similar magnetoelastic coupling has been detected in other multiferroic materials, such as HoMnO340, BiFeO341, and Y2CoMnO642.
Figure 7.
Temperature dependence of the frequency, linewidth, normalized intensity, and asymmetry factors of (a) Eg and (b) A1g phonon modes of YBaCuFeO5. The thin solid lines indicate the results of the fitting from the anharmonic model. Vertical dashed lines denote transition temperatures.
As indicated in Fig. 7(a), the frequency of the 579 cm−1 Eg mode deviated considerably from the theoretical predictions to below the antiferromagnetic phase transition temperature of 175 K. This effect was attributed to the renormalization of the in-plane Eg phonon induced by magnetic ordering, usually understood as a sign of coupling between the lattice and spin degrees of freedom. The spin–phonon coupling constant can be calculated from frequency–shift data using the expression43
| 6 |
where (Δω)SP is the difference between the phonon frequency values at 10 K from the theoretical prediction and experimental data; ωo is the value from Eq. (4); Msub(T) is the sublattice magnetic susceptibility with the external magnetic field along the ab plane; and λeff is the spin–phonon coupling constant. In the present study, we used the magnetic susceptibility with the external magnetic field along the ab plane and estimated the spin–phonon coupling constant to be 15.7 mRy/Å2. The magnitude of this value was comparable to those obtained for other multiferroic manganites44–46.
Summary
We employed both spectroscopic ellipsometry and Raman scattering spectroscopy to investigate the electronic structure and lattice dynamics of YBaCuFeO5 single crystals. We also characterized the optical transitions by comparing the experimental data and the results of first-principles calculations. The optical absorption spectrum of YBaCuFeO5 at room temperature revealed Cu/Fe d to d on-site transitions at approximately 1.69 and 2.47 eV and O 2p to Cu/Fe 3d charge–transfer transitions at approximately 3.16, 4.26, and 5.54 eV. YBaCuFeO5 exhibited a direct band gap of 1.41 ± 0.01 eV at 300 K. The band gap presented anomalies through antiferromagnetic phase transition temperatures at 455 and 175 K. Moreover, the temperature dependence of in-plane Eg phonon mode exhibited a hardening below 175 K. The spin–phonon coupling constant was estimated to be 15.7 mRy/Å2. These results confirmed a strong coupling of spin, charge, and lattice degrees of freedom in YBaCuFeO5.
Supplementary information
Acknowledgements
H.L.L. thanks financial support from the Ministry of Science and Technology of Republic of China under Grants No. MOST 105-2112-M-003-013-MY3 and Academia Sinica under thematic project Grant No. AS-105-TP-A03. J.L.K. thanks financial support from the Ministry of Science and Technology of Republic of China under Grants No. MOST 105-2119-M-001-040-MY3 and MOST 107-2923-M-001-008-MY2. F.C.C. thanks financial support from the Ministry of Science and Technology of Republic of China under Grants No. MOST 103-2119-M-002-020-MY3. C.H.D. thanks financial support from the Ministry of Science and Technology of Republic of China under Grants No. 105-2119-M-032-002-MY2.
Author Contributions
H.L.L. conceived the idea and designed the experiments. H.W.C. performed the experiments. Y.C.L., F.C.C., and C.H.D. prepared the samples. Y.W.C. and J.L.K. performed the first-principles calculations and theoretical analyses. H.W.C., Y.W.C., and H.L.L. wrote the paper. All the authors discussed the results and commented on the manuscript.
Competing Interests
The authors declare no competing interests.
Footnotes
Publisher’s note: Springer Nature remains neutral with regard to jurisdictional claims in published maps and institutional affiliations.
Electronic supplementary material
Supplementary information accompanies this paper at 10.1038/s41598-019-39031-6.
References
- 1.Er-Rakho L, Michel C. Ph. Lacirre, and B. Raveau, YBaCuFeO5+δ: A novel oxygen-deficient perovskite with a layer structure. Journal of Solid State Chemsitry. 1988;73:531. doi: 10.1016/0022-4596(88)90141-7. [DOI] [Google Scholar]
- 2.Meyer C, Hartmann-Bourton F, Gros Y, Strobel P. Mossbauer study of YBaCuFeO5+δ: site assignments of the metallic ions. Solid State Commun. 1990;76:163. doi: 10.1016/0038-1098(90)90535-J. [DOI] [Google Scholar]
- 3.Atanassova YK, Popov VN, Bogachev GG, Ilievity MN. Raman- and infrared-active phonons in YBaCuFeO5: Experiment and lattice dynamics. Phys. Rev. B. 1993;47:22. doi: 10.1103/PhysRevB.47.15201. [DOI] [PubMed] [Google Scholar]
- 4.Ruiz-Aragon M, Amador U, Moran E, Andersen NH. Neutron diffraction study of LnBaCuFeO5+δ (Ln = Y, Pr) Physica C. 1994;235-240:1609. doi: 10.1016/0921-4534(94)92030-3. [DOI] [Google Scholar]
- 5.Mombru AW, et al. Magnetic structure of the oxygen-deficient perovskite YBaCuFeO5+δ. Inorg. Chem. 1994;33:1255. doi: 10.1021/ic00085a008. [DOI] [Google Scholar]
- 6.Caignaert V, et al. Crystal and magnetic structure of YBaCuFeO5. Journal of Solid State Chemsitry. 1995;114:24. doi: 10.1006/jssc.1995.1004. [DOI] [Google Scholar]
- 7.Mombru AW, et al. Neutron powder diffraction study (T = 4.2–300 K) and polarization analysis of YBaCuFeO5+δ. J. Phys.: Condens. Matter. 1998;10:1247. doi: 10.1088/0953-8984/10/6/008. [DOI] [PubMed] [Google Scholar]
- 8.Ruiz-Aragon MJ, Moran E, Saez-Puche R, Menendez N, Tornero JD. Antiferromagnetic interactions and Mossbauer study of LnMCuFeO5+δ phases (Ln = Y, La; M = Ca, Sr, Ba) J. Superconductivity. 1996;9:155. doi: 10.1007/BF00728295. [DOI] [Google Scholar]
- 9.Ruiz-Aragon MJ, et al. Low-temperature magnetic structure of YBaCuFeO5 and the effect of partial substitution of yttrium by calcium. Phys. Rev. B. 1998;58:6291. doi: 10.1103/PhysRevB.58.6291. [DOI] [Google Scholar]
- 10.Kundys B, Maignan A, Simon C. Multiferroicity with high-TC in ceramics of the YBaCuFeO5 ordered perovskite. Appl. Phys. Lett. 2009;94:072506. doi: 10.1063/1.3086309. [DOI] [Google Scholar]
- 11.Kawamura Y, et al. High-temperature multiferroic state of RBaCuFeO5 (R = Y, Lu, and Tm) J. Phys. Soc. Jpn. 2010;79:073705. doi: 10.1143/JPSJ.79.073705. [DOI] [Google Scholar]
- 12.Yuan YH, Ying XN. Mechanical spectrum and interstitial oxygen in YBaCuFeO5+δ. Solid State Sciences. 2012;14:84. doi: 10.1016/j.solidstatesciences.2011.10.021. [DOI] [Google Scholar]
- 13.Morin M, et al. Incommensurate magnetic structure, Fe/Cu chemical disorder, and magnetic interactions in the high-temperature multiferroic YBaCuFeO5. Phys. Rev. B. 2015;91:064408. doi: 10.1103/PhysRevB.91.064408. [DOI] [Google Scholar]
- 14.Lal, S., Mukherjee, K. & Yadav, C. S. Investigation of thermodynamic properties of multiferroic YBaCuFeO5. AIP Conference Proceedings 1832, 130005 (2017).
- 15.Schmid H. Multi-ferroic magnetroelectrics. Ferroelectrics. 1994;162:317. doi: 10.1080/00150199408245120. [DOI] [Google Scholar]
- 16.Hill NA. Why are there so few magnetic ferroelectrics? J. Phys. Chem. B. 2000;104:6694. doi: 10.1021/jp000114x. [DOI] [Google Scholar]
- 17.Eerenstein W, Mathur ND, Scott JF. Multiferroic and magnetoelectric materials. Nature (London) 2006;442:759. doi: 10.1038/nature05023. [DOI] [PubMed] [Google Scholar]
- 18.Kimura T, Sekio Y, Nakamura H, Siegrist T, Ramirez AP. Cupric oxide as an induced-multiferroic with high-TC. Nat. Mater. 2008;7:291. doi: 10.1038/nmat2125. [DOI] [PubMed] [Google Scholar]
- 19.Lai Y-C, Shu G-J, Chen W-T, Du C-H, Chou F-C. Self-adjusted flux for the traveling solvent floating zone growth of YBaCuFeO5 crystal. Journal of Crystal Growth. 2015;413:100. doi: 10.1016/j.jcrysgro.2014.12.020. [DOI] [Google Scholar]
- 20.Lai Y-C, et al. Magnetic ordering and dielectric relaxation in the double perovskite YBaCuFeO5. J. Phys.: Condens. Matter. 2017;29:145801. doi: 10.1088/1361-648X/aa5708. [DOI] [PubMed] [Google Scholar]
- 21.Kresse G, Furthmüller J. Efficient iterative schemes for ab initio total-energy calculations using a plane-wave basis set. Phys. Rev. B. 1996;54:11169. doi: 10.1103/PhysRevB.54.11169. [DOI] [PubMed] [Google Scholar]
- 22.Kresse G, Furthmüller J. Efficiency of ab-initio total energy calculations for metals and semiconductors using a plane-wave basis set. Comput. Mater. Sci. 1996;6:15. doi: 10.1016/0927-0256(96)00008-0. [DOI] [PubMed] [Google Scholar]
- 23.Perdew JP, Burke K, Ernzerhof M. Generalized gradient approximation made simple. Phys. Rev. Lett. 1996;77:3865. doi: 10.1103/PhysRevLett.77.3865. [DOI] [PubMed] [Google Scholar]
- 24.Blöchl PE. Projector augmented-wave method. Phys. Rev. B. 1994;50:17953. doi: 10.1103/PhysRevB.50.17953. [DOI] [PubMed] [Google Scholar]
- 25.Kresse G, Joubert D. From ultrasoft pseudopotentials to the projector augmented-wave method. Phys. Rev. B. 1999;59:1758. doi: 10.1103/PhysRevB.59.1758. [DOI] [Google Scholar]
- 26.Liechtenstein AI, Anisimov VI, Zaane J. Density-functional theory and strong interactions: Orbital ordering in Mott-Hubbard insulators. Phys. Rev. B. 1995;52:R5467. doi: 10.1103/PhysRevB.52.R5467. [DOI] [PubMed] [Google Scholar]
- 27.Wooten, F. Optical Properties of Solids. (Academic, New York, 1972).
- 28.Pankove, J. I. Optical Processes in Semiconductors. (Dover, New York, 1971).
- 29.Vina L, Logothetidis S, Cardona M. Temperature dependence of the dielectric function of germanium. Phys. Rev. B. 1984;30:1979. doi: 10.1103/PhysRevB.30.1979. [DOI] [Google Scholar]
- 30.Li WW, et al. Temperature dependence of electronic transitions and optical properties in multiferroic BiFeO3 nanocrystalline film determined from transmittance spectra. Appl. Phys. Lett. 2010;97:121102. doi: 10.1063/1.3489926. [DOI] [Google Scholar]
- 31.Liu HL, Lin MK, Cai YR, Tung CK, Chu YH. Strain modulated optical properties in BiFeO3 thin films. Appl. Phys. Lett. 2013;103:181907. doi: 10.1063/1.4827639. [DOI] [Google Scholar]
- 32.Basu SR, et al. Photoconductivity in BiFeO3 thin films. Appl. Phys. Lett. 2008;92:092905. doi: 10.1063/1.2890060. [DOI] [Google Scholar]
- 33.Holinsworth RS, et al. Direct band gaps in multiferroic h-LuFeO3. Appl. Phys. Lett. 2015;106:082902. doi: 10.1063/1.4908246. [DOI] [Google Scholar]
- 34.Rai RC, Delmont A, Sprow A, Cai B, Nakami ML. Spin-charge-orbital coupling in multiferroic LuFe2O4 thin films. Appl. Phys. Lett. 2012;100:212904. doi: 10.1063/1.4720401. [DOI] [Google Scholar]
- 35.Kruger R, et al. Orbital ordering in LaMnO3 investigated by resonance Raman spectroscopy. Phys. Rev. Lett. 2004;92:0927203. doi: 10.1103/PhysRevLett.92.097203. [DOI] [PubMed] [Google Scholar]
- 36.Martin-Carron L, de Andres A. Excitations of the orbital order in RMnO3 manganites: light scattering experiments. Phys. Rev. Lett. 2004;92:175501. doi: 10.1103/PhysRevLett.92.175501. [DOI] [PubMed] [Google Scholar]
- 37.Andreasson J, et al. Electron-phonon interactions in perovskites containing Fe and Cr studied by Raman scattering using oxygen-isotope and cation substitution. Phys. Rev. B. 2008;78:235103. doi: 10.1103/PhysRevB.78.235103. [DOI] [Google Scholar]
- 38.Fano U. Effect of configuration interaction on intensities and phase shifts. Phys. Rev. 1961;124:1866. doi: 10.1103/PhysRev.124.1866. [DOI] [Google Scholar]
- 39.Menendez J, Cardona M. Temperature dependence of the first-order Raman scattering by phonons in Si, Ge, and α−Sn: Anharmonic effects. Phys. Rev. B. 1984;29:2051. doi: 10.1103/PhysRevB.29.2051. [DOI] [Google Scholar]
- 40.Litvinchuk AP, Illiev MN, Popov VN, Gospodinoy MM. Raman and infrared-active phonons in hexagonal HoMnO3 single crystals: magnetic ordering effects. J. Phys.: Condens. Matter. 2004;16:809. [Google Scholar]
- 41.Haumont R, Kreisel J, Bouvier P, Hippert F. Phonon anomalies and the ferroelectric phase transition in multiferroic BiFeO3. Phys. Rev. B. 2006;73:132101. doi: 10.1103/PhysRevB.73.132101. [DOI] [Google Scholar]
- 42.Silva RX, et al. Paschoal, Spin-phonon coupling in multiferroic Y2CoMnO6. J. Alloys Compd. 2017;690:909. doi: 10.1016/j.jallcom.2016.07.010. [DOI] [Google Scholar]
- 43.Baltensperger W, Helman JS. Influence of magnetic order in insulators on the optical phonon frequency. Helv. Phys. Acta. 1968;41:668. [Google Scholar]
- 44.Granado E, et al. Magnetic ordering effects in the Raman spectra of La1−xMn1−xO3. Phys. Rev. B. 1999;60:11879. doi: 10.1103/PhysRevB.60.11879. [DOI] [Google Scholar]
- 45.Laverdiere J, et al. Spin-phonon coupling in orthorhombic RMnO3 (R = Pr, Nd, Sm, Eu, Gd, Tb, Dy, Ho, Y): A Raman study. Phys. Rev. B. 2006;73:214301. doi: 10.1103/PhysRevB.73.214301. [DOI] [Google Scholar]
- 46.Issing S, Pimenov A, Yu. Ivanov V, Mukhin AA, Geurts J. Composition-dependent spin-phonon coupling in mixed crystals of the multiferriuc manganite Eu1−xYxMnO3 (0 ≤ x ≤ 0.5) studied by Raman spectroscopy. Phys. Rev. B. 2010;81:024304. doi: 10.1103/PhysRevB.81.024304. [DOI] [Google Scholar]
Associated Data
This section collects any data citations, data availability statements, or supplementary materials included in this article.


