Abstract
Acute kidney injury (AKI) is a common cause of morbidity and mortality in hospitalized patients. Nevertheless, there is limited ability to diagnose AKI in its earliest stages through the collection of structural and functional information. Magnetic resonance imaging (MRI) is increasingly being used to provide structural and functional data that characterize the injured kidney. Dynamic contrast-enhanced (DCE) MRI is an imaging modality with robust spatial and temporal resolution; however, its ability to detect changes in kidney function following AKI has not been determined. We hypothesized that DCE MRI would detect a prolongation in contrast transit time following toxin-induced AKI earlier than commonly used serum and tissue biomarkers. To test our hypothesis, we injected mice with either vehicle or cisplatin (30 mg/kg) and performed DCE MRI at multiple time points. We found that commonly used kidney injury biomarkers, including creatinine, blood urea nitrogen, and neutrophil gelatinase-associated lipocalin, did not rise until day 2 following cisplatin. Tissue levels of the proinflammatory cytokines and chemokines, tumor necrosis factor-α, interleukin (IL)-1β, IL-1α, IL-6, C-C motif chemokine ligand 2, and C-X-C motif chemokine ligand 2 similarly did not upregulate until day 2 following cisplatin. However, the time to peak intensity of contrast in the renal collecting system was already prolonged at day 1 following cisplatin compared with vehicle-treated mice. This intensity change mirrored changes in kidney injury as measured by histological analysis and in transporter expression in the proximal tubule. Taken together, DCE MRI is a promising preclinical imaging modality that is useful for assessing functional capacity of the kidney in the earliest stages following AKI.
Keywords: acute kidney injury, cisplatin, MRI
INTRODUCTION
Acute kidney injury (AKI) is a major cause of morbidity and mortality that occurs in 7–18% of all hospitalized patients and 50–60% of those admitted to an intensive care unit (5). An AKI diagnosis is typically made through serum creatinine and urine output criteria (12). Unfortunately, creatinine does not rise until kidney function has declined to <50% of baseline, delaying diagnosis and preventing the adoption of kidney-protective practices. Much work has gone into the identification of biomarkers that can detect kidney injury at earlier time points and provide prognostic information (9). In addition to biomarkers, imaging modalities have gained increasing attention for their ability to provide both functional and structural information about the kidney following injury (7, 10, 19). For example, ultrasound can detect renovascular expression of adhesion molecules (3), whereas computed tomography is a powerful tool to quantitate renal hemodynamics (4). Initially used to detect scar formation in the kidney, magnetic resonance imaging (MRI) is now employed to interrogate a range of functional and structural parameters in the kidney during preclinical studies (7, 19, 21).
Preclinical imaging studies can serve to develop more robust imaging methods in humans and better understand the pathophysiology of AKI. A major issue with preclinical, and clinical, imaging methods is the poor spatial and temporal resolution of current methods. Dynamic contrast-enhanced (DCE) MRI is a preclinical MRI modality that provides information of the kidney microstructure and assesses kidney functional capacity (19–21). DCE MRI is performed after a bolus of intravenous gadolinium contrast. One of the challenges of DCE MRI is the tradeoff between temporal resolution, spatial resolution, and coverage. It is relatively easy to acquire a single 1-mm-thick two-dimensional image in 2 s. When the slice thickness is reduced, the signal is reduced, and longer scans are required. Covering the whole kidney becomes even more problematic. The novel method used in this work allows coverage of the whole kidney at 125 μm isotropic resolution with one image every 7.7 s (21).
Cisplatin is an efficacious chemotherapeutic agent used to treat a variety of solid tumors. Unfortunately, cisplatin use is limited by significant side effects, one of the worst of which is nephrotoxicity. Cisplatin nephrotoxicity involves tubular and vascular injury, oxidative stress, and inflammation (11). Cisplatin also is associated with defects in the concentrating ability of the kidney (14).
DCE MRI offers a unique combination of spatial and temporal resolution, and, during DCE MRI, prolonged contrast transit times are indicative of changes in renal function (20). However, the ability of DCE MRI to measure changes in contrast transit times after AKI has not been studied. Because cisplatin induces defects in the kidney’s concentrating ability, we hypothesized that DCE MRI would detect prolongation of contrast transit time following cisplatin in specific regions of the kidney and that this change would occur earlier than the elevations in commonly used kidney injury biomarkers. In support of our hypothesis, we found that DCE MRI detected a prolongation in time to peak contrast intensity in the renal collecting system following cisplatin, earlier than levels of kidney injury biomarkers rose. We conclude that DCE MRI is a promising preclinical imaging modality that can be used to detect early changes in kidney structure and function following AKI.
METHODS
Animals.
Female mice on the 129/SvEv strain were used for all experiments. We use female mice in our cisplatin model, since we see better survival in females than males, which allows us to better study longitudinal changes in kidney function. All of the animal studies were approved by the Durham Veterans Affairs Medical Center Institutional Animal Care and Use Committee, Duke University Institutional Animal Care and Use Committee, and conducted in accordance with the National Institutes of Health Guide for the Care and Use of Laboratory Animals.
Cisplatin-induced kidney injury.
Cisplatin-induced kidney injury (30 mg/kg) was performed as previously described (13). Vehicle mice received normal saline diluent and were analyzed 2 days after injection. Mice were euthanized 24 or 48 h after cisplatin injection. For tissue harvest, animals were anesthetized with isoflurane (3%) via nosecone, blood was obtained via cardiac puncture, and renal tissues were sectioned and snap-frozen in liquid nitrogen or fixed in 10% formalin for histological analysis.
Dynamic contrast-enhanced MRI.
MRI was performed on a 20-cm-bore 7-T magnet (Bruker BioSpec 70/20 USR, Billerica, MA) interfaced to an Avance III system. The scanner was equipped with shielded gradients (440 mT/m amplitude) providing integrated field map shims up to the second order. A high-sensitivity cryogenic radiofrequency (RF) surface coil was used for transmission and reception (Bruker CryoProbe). The active region of the cryogenic coil was positioned close to the left kidney for high signal-to-noise ratio.
A custom interleaved radial sequence [center-out 3-dimensional (3D) ultrashort echo time (UTE)] was implemented on a Bruker ParaVision 5.1 to allow radial keyhole imaging. Images were acquired using the following parameters: interleaved subvolumes = 13, total views = 40,222, polar undersampling = 2, repetition time = 5.0 ms, echo time = 20 μs, fractional anisotrophy = 10°, bandwidth (BW) = 100 kHz, field of view = 20 × 20 × 20 mm, matrix size = 160 × 160 ×160, and the spatial resolution is 125 μm3 isotropic resolution. A 3D volume was acquired every 3 min 21 s over a 36-min time course (11 repeats) to capture contrast enhancement and clearance. The contrast agent (Magnevist, 0.5 mmol/kg) was injected at 3 min 21s (after the first repeat). Images were reconstructed by sharing the projections from the unique subvolumes via a sliding window approach, known as radial keyhole imaging, yielding one isotropic 3D volume every 7.7 s (16, 20, 21).
Post-MRI image processing.
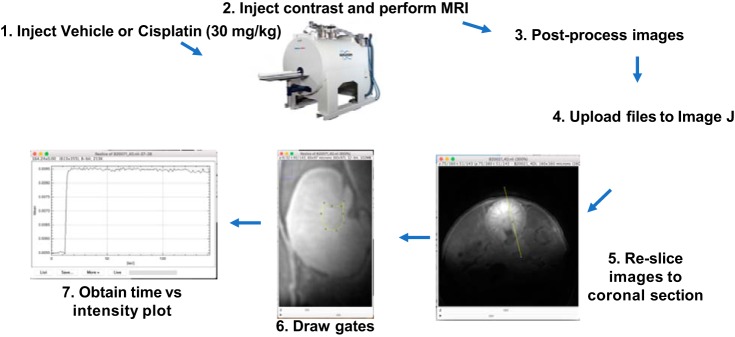
Images were uploaded to Image J Fiji. Cross-sectional MRI images were resliced within Image J to coronal sections (Fig. 1). Gates were manually drawn around the following regions (Fig. 1): cortex, corticomedullary junction, and collecting system/inner medulla (heretofore referred to as collecting system) . A time vs. intensity plot for each region was obtained within Image J software. Time-lapse videos were created within Image J software (7 frames/s).
Fig. 1.
Schematic for magnetic resonance imaging (MRI) analysis. Mice were injected with vehicle or cisplatin (30 mg/kg). At 1 or 2 days following cisplatin, mice were injected with gadolinium contrast and imaged with an MRI scanner. After postprocessing, imaging files were uploaded to Image J software, resliced to coronal sections. Gates were drawn around regions of interest, and then time vs. intensity plots were obtained.
Assessment of renal function.
Serum creatinine and blood urea nitrogen (BUN) levels were measured by the University of North Carolina Animal Histopathology and Laboratory Medicine Core.
Pathological analyses.
After whole body perfusion with normal saline via cardiac puncture, kidney tissues were fixed with 10% neutral-buffered formalin (VWR 16004–128), embedded with paraffin, sectioned in 5-mm sections, and stained with Periodic acid-Schiff (PAS) stain by the Duke Research Immunohistology Laboratory. A subset of kidneys that reflected the mean serum creatinines was chosen for histological analysis. Sections were scored by an experienced observer masked to experimental groups. Sections were graded according to a previously established scoring system (22): the percentages of tubules with cell lysis, loss of brush border, and cast formation were scored on a scale from 0 to 4 (0, <5%; 1, 5–25%; 2, 26–50%; 3, 51–75%; and 4, >75%). Histological scores for each kidney were obtained by adding individual component scores.
RT-PCR analysis of mRNA expression.
mRNA was isolated with an RNeasy Mini Kit per the manufacturer’s instructions (Qiagen, Germantown, MD). For whole kidneys, a small piece of the renal pole was homogenized in Buffer RLT with 0.01% β-mercaptoethanol and further homogenized with Qiashredder columns (79654; Qiagen). mRNA concentration in each sample was determined by Nanodrop (ThermoFisher). cDNA was synthesized with the High Capacity cDNA Reverse Transcription Kit (4368814; Applied Biosystems) according to the manufacturer’s instructions. Primers are listed in Table 1. Gene expression levels were determined by RT-PCR on an ABI7900HT machine (Applied Biosystems).
Table 1.
Primers used for RT-PCR analysis
| Gene | Accession/Catalog No. or Sequence |
|---|---|
| NGAL/Lcn2 | Mm01324470_m1 |
| KIM-1 | Mm00506686_m1 |
| IL-18 | Mm004434226_m1 |
| TNF-α | Mm00443259_g1 |
| IL-1α | Mm00439620_m1 |
| IL-1β | Mm00434228_m1 |
| IL-6 | Mm01210732_g1 |
| CXCL2 | Mm00436450_m1 |
| CCL2 | Mm00441242_m1 |
| Col1a | Mm00801666_g1 |
| TGFb | Mm01178820_m1 |
| PAI-1 | 5′-GGGACGAAACTGGAGATGTTAT-3′ |
| NHE3 | 5′-CTGAGGAGGAACCGAGCA-3′ |
| NKCC2 | 5′-GCTCTTCATTCGCCTCTCCT-3′ |
| eNaC (β-subunit) | 5′-CAGTGGGGAGTCTTCATCC-3′ |
| GAPDH | 4352661 |
NGAL, neutrophil gelatinase-associated lipocalin; KIM-1, kidney injury molecule-1; IL, interleukin; TNF-α, tumor necrosis factor-α; CXCL2, C-X-C motif chemokine ligand 2; CCL2, C-C motif chemokine ligand 2; TGFb, transforming growth factor-β; NHE3, Na+/H+ exchanger; NKCC2, Na+-K+-Cl− cotransporter; eNaC, epithelial sodium channel; GAPDH, glyceraldehyde-3-phosphate dehydrogenase.
Statistical analysis.
The continuous values within a group are expressed as means ± SE. For comparisons between groups, a one-way ANOVA with Dunnett’s multiple-comparisons post hoc test (to vehicle control group) was performed in GraphPad Prism software (La Jolla, CA). For area under the curve (AUC) analysis, the average intensity was calculated for each subject at baseline (first 2 min). This measure was used as a baseline threshold to which the AUC would be standardized for each subject. Next, the AUC was calculated out to 6 min for each subject. To statistically test the different AUCs, a permutation analysis was performed. In total, 200 permutations were generated, and for each permutation a generalized linear model fit between the independent variable group and the dependent variable standardized AUC intensity. The generated test statistics were then used as an exact distribution to which the true test statistic was tested. The AUC analysis was performed with SAS 9.4 (SAS, Cary, NC). Statistical significance was defined as P < 0.05.
RESULTS
Serum and tissue kidney injury biomarkers rise on day 2 following cisplatin.
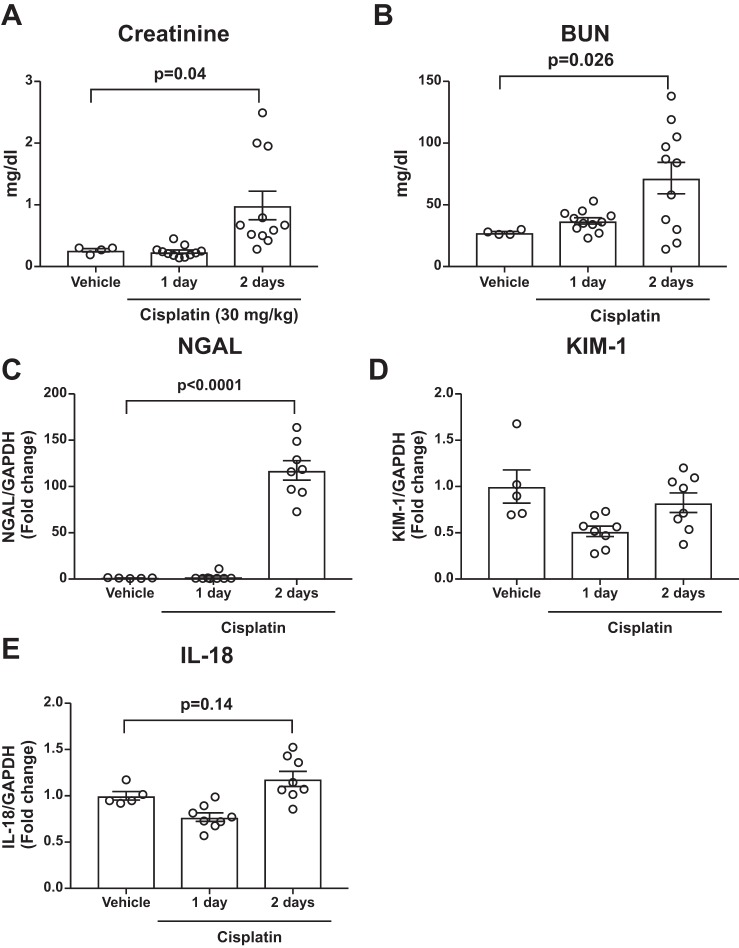
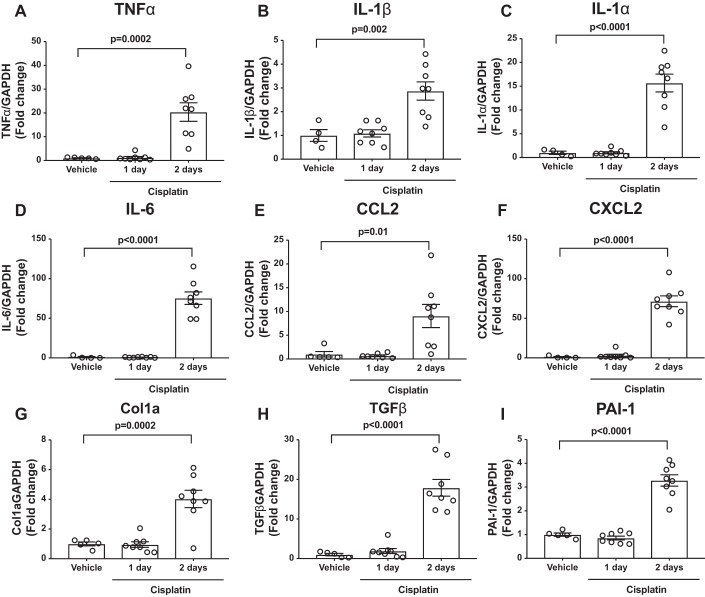
To enable comparison of DCE MRI to detect changes in kidney structure and function with commonly used injury biomarkers, we first sought to determine the time course of kidney injury and inflammatory biomarker rise following cisplatin. Using a severe cisplatin injury model (13, 23), we noted that serum creatinine (Fig. 2A) and BUN (Fig. 2B) are near baseline on day 1 and do not significantly rise until day 2 following cisplatin. We examined common kidney injury biomarkers in kidney tissue by RT-PCR. Neutrophil gelatinase-associated lipocalin (NGAL) was significantly elevated only at day 2 following cisplatin (Fig. 2C), and we did not detect significant changes in kidney injury molecule-1 (Fig. 2D) or IL-18 (Fig. 2E) mRNA in kidney tissue. We next measured levels of proinflammatory cytokines and chemokines in kidney tissue from vehicle- and cisplatin-treated mice. The proinflammatory mediators tumor necrosis factor-α, IL-1β, IL-1α, IL-6, C-C motif chemokine ligand 2, and C-X-C motif chemokine ligand 2 rose only at day 2 following cisplatin (Fig. 3, A–F). We further examined genes involved in healing and recovery. We found that collagen I, transforming growth factor-β (TGF-β), and plasminogen activator inhibitor-1 (PAI-1) were near baseline at day 1, but elevated at day 2, following cisplatin (Fig. 3, G–I), indicating that recovery pathways are being initiated at day 2 following cisplatin. From these results, we concluded that kidney injury and inflammation biomarkers are near baseline at day 1 and begin to rise only at day 2 following cisplatin.
Fig. 2.
Serum and tissue biomarkers do not rise until day 2 following cisplatin. Mice were injected with vehicle or cisplatin (30 mg/kg). At 1 or 2 days following cisplatin, mice were sacrificed, and tissues were collected. A and B: serum creatinine (A) and blood urea nitrogen (BUN, B) were measured (n = 4 for vehicle-treated mice; n = 11 for cisplatin day 1 and day 2 mice). C–E: kidney tissue was obtained, and RT-PCR was performed for neutrophil gelatinase-associated lipocalin (NGAL, C), kidney injury molecule-1 (KIM-1, D), and interleukin-18 (IL-18, E) mRNA levels (n = 5 for vehicle-treated mice; n = 8 for cisplatin day 1 and day 2 mice). Graphs display means ± SE with each mouse indicated by one open circle. Significance was determined by 1-way ANOVA with Dunnett’s posttest for multiple comparisons with the vehicle-treated group.
Fig. 3.
Inflammatory cytokine/chemokine and healing/fibrosis mRNA levels rise at day 2 following cisplatin. Mice were injected with vehicle or cisplatin (30 mg/kg). At 1 or 2 days following cisplatin, mice were sacrificed, and tissues were collected. RT-PCR was performed for mRNA encoding tumor necrosis factor-α (TNF-α, A), interleukin (IL)-1β (B), IL-1α (C), IL-6 (D), C-C motif chemokine ligand 2 (CCL2, E), C-X-C motif chemokine ligand 2 (CXCL2, F), collagen Ia (Col1a, G), transforming growth factor-β (TGF-β, H), and plasminogen activator inhibitor-1 (PAI-1, I) (n = 4–5 for vehicle-treated mice; n = 8 for cisplatin day 1 and day 2 mice). Graphs display means ± SE with each mouse indicated by one open circle. Significance was determined by 1-way ANOVA with Dunnett’s posttest for multiple comparisons with the vehicle-treated group.
The collecting system/inner medulla exhibits changes in the contrast-time intensity profile at day 1 following cisplatin.
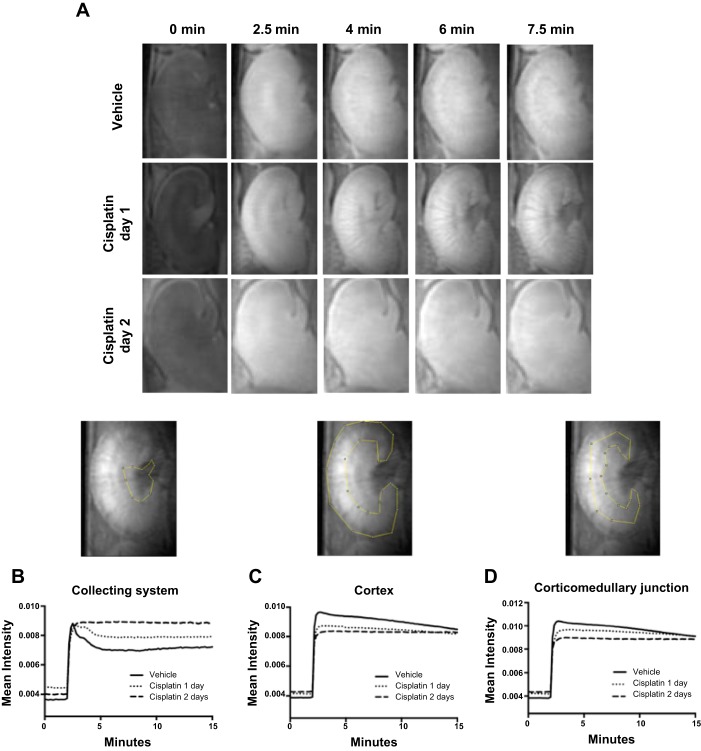
Based on a previously established imaging protocol (16, 20, 21), we set out to determine whether we could detect changes in contrast intensity in different regions of the kidney earlier than elevations in kidney injury biomarkers occurred. We injected mice with saline vehicle or cisplatin (30 mg/kg) and then performed MRI scans at day 1 or 2 following cisplatin. Time-lapse videos of MRI imaging scans are shown in Supplemental Videos 1–3 with still images displayed in Fig. 4A (Supplemental data for this article can be found on the journal website.). To test whether differences in contrast intensity could differentiate between vehicle, day 1, or day 2 mice, we obtained time vs. intensity plots in the indicated regions of the kidney. We noted that the time vs. intensity plot of the renal collecting system appeared to have the most separation between the cisplatin- and vehicle-treated groups, with the day 1 contrast-time intensity profile clearly separating from both the vehicle and day 2 curves (Fig. 4B). Thus, following toxin administration, DCE MRI detects changes in the contrast-time intensity profile in the collecting system at day 1 following cisplatin, which is earlier than commonly used kidney injury biomarkers.
Fig. 4.
Visualization of time vs. contrast intensity changes in regions of the kidney following cisplatin. Mice were injected with vehicle or cisplatin (30 mg/kg). At 1 or 2 days following cisplatin, mice were injected with gadolinium contrast and imaged with a magnetic resonance imaging (MRI) scanner. A: still frame images at the indicated time points for each treatment group. B–D: time vs. contrast intensity profile for the collecting system (B), cortex (C), and corticomedullary junction (D). Image above graph displays representative gate used to identify the region of interest. Graph displays mean of intensity readings for all animals in each group (n = 5 for vehicle and cisplatin day 1 mice, n = 4 for cisplatin day 2 mice).
The collecting system exhibits longer time to peak contrast intensity at day 1 following cisplatin compared with control mice.
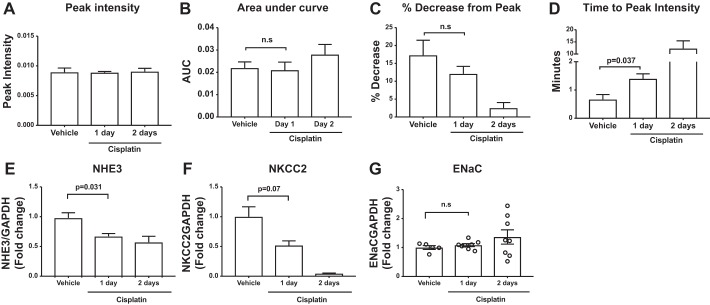
To determine whether the vehicle and day 1 collecting system contrast-time intensity curves (Fig. 4B) were indeed different from each other statistically, we assessed a number of parameters. We first examined peak contrast intensity; however, there was not a statistically significant difference in the peak contrast intensity achieved between groups (Fig. 5A). We next determined the area under the curve (AUC) of contrast washout; however, there was not a significant change in AUC between the vehicle and day 1 curves (Fig. 5B). We noted that the profile of contrast washout in the collecting system of the vehicle-treated mice showed a rapid decrement in contrast intensity after achieving peak concentration but that the day 1 mice displayed blunted contrast washout (Fig. 4B). To model this pattern, we calculated the percent decrease from peak contrast intensity to the last measurement obtained. There was not a statistically significant difference in the percent decrease from peak intensity between vehicle and day 1 mice (Fig. 5C). Xie et al. had previously demonstrated that the time to peak contrast intensity measured in the collecting system could detect changes in kidney functional capacity (20). We therefore measured the time to peak concentration between vehicle and day 1 mice. We found that the time to peak intensity in the collecting system was significantly different between vehicle and day 1 mice (Fig. 5D). We examined peak intensity, AUC, percent decrease, and time to peak intensity in the cortex and corticomedullary junction, but there were no significant differences between vehicle and day 1 mice in these regions (data not shown).
Fig. 5.
The time to peak contrast intensity in the collecting system is prolonged following cisplatin, which is correlated with reduced gene expression of upstream nephron transporters. Mice were injected with vehicle or cisplatin (30 mg/kg). At 1 or 2 days following cisplatin, mice were injected with gadolinium contrast and imaged with a magnetic resonance imaging (MRI) scanner. The following parameters were measured: peak contrast intensity (A), area under the curve (AUC, B), %decrease from peak contrast intensity to the end of measurement (C), and time to peak contrast intensity (D) (n = 5/group). E–G: in kidney tissues from mice above and additional mice, RT-PCR was performed for mRNA encoding Na+/H+ exchanger (NHE3, E), Na+-K+-Cl− cotransporter (NKCC2, F), and β-ENaC (G) (n = 5 for vehicle-treated mice; n = 8 for cisplatin day 1 and day 2 mice). Data are expressed as means ± SE. Significance was determined by Welch’s ANOVA with Dunnett posttest for multiple comparisons with the vehicle-treated group.
Cisplatin induces changes in proximal tubule transporters at day 1 following cisplatin.
We further wanted to determine a mechanism whereby DCE MRI could detect cisplatin-mediated slowing of contrast transit through the kidney. We examined mRNA levels of transport channels in the upstream nephron. We found that cisplatin significantly downregulated expression of the proximal tubule Na+/H+ exchanger (NHE3) (Fig. 5E) and induced a strong trend toward downregulation of the thick ascending limb Na+-K+-Cl− cotransporter (NKCC2), although this did not reach statistical significance (Fig. 5F). Expression levels of the collecting system transporter ENaC (detected by β-subunit) were not significantly changed following cisplatin (Fig. 5G). As such, following cisplatin, DCE MRI detects changes in the time to peak intensity in the collecting system (20), and this change correlates with decreased transporter expression in the upstream proximal tubule and thick ascending limb. Furthermore, both of these changes occur earlier than changes in commonly used kidney injury biomarkers reflect AKI.
DCE MRI changes mirror histological changes in cisplatin-injured kidneys.
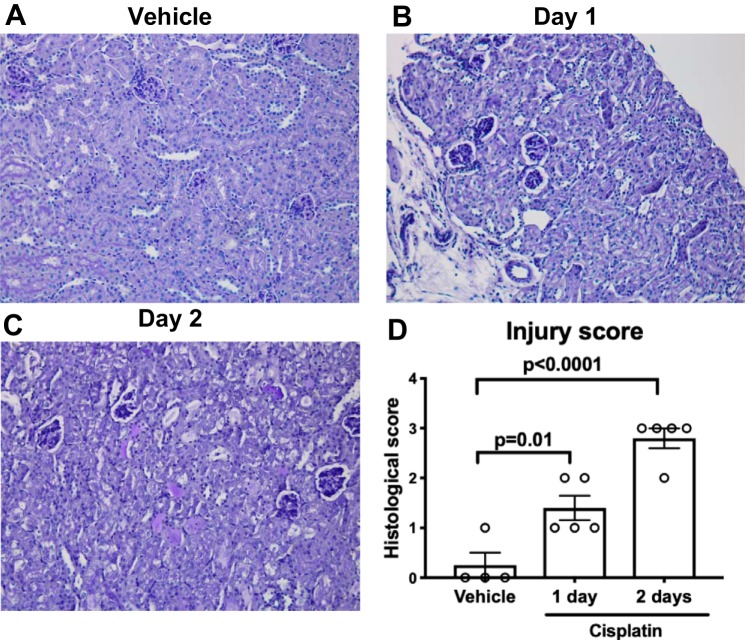
To determine whether the time to peak contrast intensity in the collecting system (Fig. 5D) is consistent with the emergence of renal pathology, we scored PAS-stained kidney sections from vehicle- and cisplatin-treated mice using a previously validated scoring system (22). Compared with vehicle-treated mice, the histological injury score was higher at day 1 and day 2 following cisplatin (Fig. 6). Taken together, the time to peak contrast intensity in the collecting system as detected by DCE MRI mirrors the timing of histological changes in injured kidneys that occur before elevation in kidney injury biomarkers.
Fig. 6.
Histological changes in kidney tubules appear at day 1 following cisplatin. At 1 day following cisplatin or vehicle, kidney sections were collected and stained with Periodic acid-Schiff (PAS). Shown are representative kidney histological sections from vehicle (A), cisplatin day 1 (B), and cisplatin day 2 (C) mice. D: sections were graded according to a previously established scoring system (22) by a trained observer masked to experimental groups. Histological scores for each kidney were obtained by adding individual component scores for each group. Graph displays mean ± SE of histological injury score. Significance was determined by 1-way ANOVA with Dunnett post hoc test for multiple comparisons.
DISCUSSION
AKI is frequently encountered in hospitalized patients and contributes to significant morbidity and mortality (5). Serum creatinine is the most commonly used serum biomarker. However, levels of creatinine do not rise until there has been a precipitous decline in kidney function. As such, considerable effort has been devoted to developing other serum/urine biomarkers or imaging tools that can facilitate earlier AKI diagnosis. Our collaborators have previously established that DCE MRI with UTE allows for measurement of both kidney structure and function (20, 21). Based on this strategy, we hypothesized that DCE MRI would allow for detection of changes in contrast transit in the kidney following nephrotoxic injury. In support of our hypothesis, we found that the time to peak intensity of contrast in the collecting system was prolonged at day 1 following cisplatin compared with vehicle-treated mice. This is the same region of the kidney in which our collaborators had previously demonstrated the ability to detect changes in the concentrating capacity of the kidney (20). Furthermore, the change in time to peak contrast intensity following cisplatin mirrored changes in kidney structure as determined by histological analysis and upstream nephron transporters but occurred earlier than elevations in common serum and tissue biomarkers. Therefore, we conclude that DCE MRI with UTE is a promising preclinical imaging modality that can provide early detection of kidney stress and AKI.
MRI has garnered considerable attention for its ability to provide both structural and functional information about the kidney (10, 19). For example, MRI has been well studied for kidney fibrosis (10). Several MRI methods have also been proposed to examine AKI. MRI methods to examine AKI include blood oxygen level-dependent, arterial spin labeling, and diffusion-weighted imaging (24). These modalities all provide kidney structural information and allow for assessment of kidney oxygenation, blood flow, and diffusion of water molecules in the kidney, respectively (24), all of which are deranged in the injured kidney. In addition to the above MRI approaches, DCE MRI has been proposed as an alternative MRI method for diagnosing AKI. The use of DCE MRI to detect changes in kidney function following MRI as we present in this study is novel, since it provides a complete 3D image every 7.7 s that can be sliced in any desired imaging plane (21). This is a robust imaging tool that provides a unique combination of spatial and temporal resolution compared with currently used preclinical and clinical imaging modalities (Table 2). Preclinical MRI methods with robust spatial resolution have been described, but scan times are significantly longer than the modality we present here (Table 2). Preclinical computed tomography also provides excellent spatial resolution but with significantly longer scan times and subsequent high levels of ionizing radiation (Table 2). In addition to robust spatial resolution, DCE MRI with UTE can also provide insight into kidney function with its excellent temporal resolution. Because gadolinium is freely filtered by the glomerulus and neither secreted nor resorbed (20), use of this agent allows for measurement of transit time of the contrast medium. We demonstrated that the ability of contrast to pass through the kidney and reach peak concentration in the collecting system is prolonged following toxin administration. This prolongation occurs as structural damage emerges but before elevations in kidney injury biomarkers. Our data further demonstrate that cisplatin decreases gene expression of transporters in the upstream nephron at day 1 following cisplatin, especially in the proximal tubule, which indicates that cisplatin is altering proximal tubule function. Indeed, cisplatin is known to cause damage to proximal tubule cells (11). Proximal tubule stress/dysfunction is a potential mechanism as to why contrast transit time is prolonged following cisplatin: Altered proximal tubule function decreases solute flow through downstream nephron segments, which is detected in the terminal collecting system. Thus, we propose DCE MRI-measured changes in contrast transit time to the collecting system as an early AKI imaging biomarker to detect kidney stress before overt kidney injury.
Table 2.
Spatial and temporal resolution of current preclinical and clinical CT and MRI imaging methods
| Imaging Modality | Voxel Volume, mm3 | Spatial Resolution | Coverage | Time for Full Volume Scan | Ref. No. |
|---|---|---|---|---|---|
| Preclinical | |||||
| DCE-MRI | 0.002 | 0.125 mm3 | 3D isotropic | 7.7 s | 20 |
| High-throughput MRI | 0.005 | 0.156 × 0.156 × 0.200 mm | 3D anisotropic | 3.2 min | 6 |
| High-resolution MRI | 2.1 × 10⁻⁴ | 0.06 mm3 | 3D isotropic | 45 min | 2 |
| Micro-CT | 6.9 × 10⁻⁶ | 0.019 mm3 | 3D isotropic | 52 min | 15 |
| Clinical | |||||
| Helical CT | 0.125–0.16 | 0.5 × 0.5 × (0.5–0.625) mm | 3D anisotropic | 1.9–8.3 s | 8 |
| 3T MRI | 0.65 | 0.9 × 0.8 × 0.9 mm | 3D anisotropic | 18 s | 1 |
CT, computed tomography; MRI, magnetic resonance imaging; DCE, dynamic contrast enhanced; 3T, 3 tesla; 3D, 3 dimensional.
DCE MRI with UTE also could be a promising tool to predict fibrotic change/chronic kidney disease development. We did not examine development of fibrosis in our mice, mainly because the cisplatin dose we administered is lethal after 3–5 days. We did, however, examine markers that are associated with healing and fibrosis. We found that mRNA levels of collagen I, TGF-β, and PAI-1 were all elevated at day 2 following cisplatin. Although these data cannot confirm whether structural and function changes detected by DCE MRI can correlate with kidney healing, it will be interesting in future studies to determine whether the time to peak contrast intensity can be used to predict the transition from AKI to chronic kidney disease in a chronic cisplatin or a chronic ischemia-reperfusion model.
Limitations.
One drawback of our study is that DCE MRI imaging as an AKI screening tool is likely not feasible in human patient populations because of cost. Another limitation is that gadolinium contrast must be used to obtain DCE MRI measurements. Gadolinium contrast has been associated with the development of nephrogenic systemic fibrosis (NSF) (17). NSF is a rare but severe disease that causes progressive fibrosis of multiple organ systems (17). It appears to be most prevalent in patients with reduced kidney function (18), which could make AKI patients particularly vulnerable. Until newer and safer contrast agents are designed that are not associated with NSF, it is likely that DCE MRI will be best used as a preclinical research tool to examine changes in kidney function/concentrating ability following AKI.
Conclusion.
We demonstrate that, following nephrotoxin administration, DCE MRI with UTE detects prolongation in contrast transit as a reflection of kidney stress earlier than commonly used kidney injury biomarkers. We believe DCE MRI is a promising imaging modality that can be used as a preclinical research tool to detect changes in the kidney structure and function in the earliest stages of AKI. Our experiments lay the groundwork for future studies aimed at determining whether changes in the DCE MRI can predict the future development of kidney fibrosis.
GRANTS
This work was supported by NIH Grants DK-087893 and HL-128355, Veterans Health Administration, Office of Research and Development, Biomedical Laboratory Research and Development Grant BX000893, and Duke O’Brien Center for Kidney Research (NIDDK P30DK096493) to S. D. Crowley; NIH/NIBIB Grant P41-EB-015897 to G. A. Johnson; and NIH Grant 5T32-GM-008600 to the Duke Department of Anesthesiology (J. R. Privratsky as fellow) and International Anesthesia Research Society Mentored Research Award and Duke Department of Anesthesiology Dream Innovation Grant to J. R. Privratsky.
DISCLOSURES
No conflicts of interest, financial or otherwise, are declared by the authors.
AUTHOR CONTRIBUTIONS
J.R.P., G.A.J., and S.D.C. conceived and designed research; J.R.P., N.W., Y.Q., J.R., and B.T.M. performed experiments; J.R.P., N.W., Y.Q., J.R., B.T.M., and J.C.H. analyzed data; J.R.P., J.R., B.T.M., J.C.H., and G.A.J. interpreted results of experiments; J.R.P. and G.A.J. prepared figures; J.R.P. drafted manuscript; J.R.P., N.W., Y.Q., J.R., B.T.M., J.C.H., G.A.J., and S.D.C. edited and revised manuscript; J.R.P., N.W., Y.Q., J.R., B.T.M., J.C.H., G.A.J., and S.D.C. approved final version of manuscript.
Supplemental Data
REFERENCES
- 1.Attenberger UI, Morelli JN, Schoenberg SO, Michaely HJ. Assessment of the kidneys: magnetic resonance angiography, perfusion and diffusion. J Cardiovasc Magn Reson 13: 70, 2011. doi: 10.1186/1532-429X-13-70. [DOI] [PMC free article] [PubMed] [Google Scholar]
- 2.Baltes C, Radzwill N, Bosshard S, Marek D, Rudin M. Micro MRI of the mouse brain using a novel 400 MHz cryogenic quadrature RF probe. NMR Biomed 22: 834–842, 2009. doi: 10.1002/nbm.1396. [DOI] [PubMed] [Google Scholar]
- 3.Boesen EI, Crislip GR, Sullivan JC. Use of ultrasound to assess renal reperfusion and P-selectin expression following unilateral renal ischemia. Am J Physiol Renal Physiol 303: F1333–F1340, 2012. doi: 10.1152/ajprenal.00406.2012. [DOI] [PMC free article] [PubMed] [Google Scholar]
- 4.Chade AR, Williams ML, Engel J, Guise E, Harvey TW. A translational model of chronic kidney disease in swine. Am J Physiol Renal Physiol 315: F364–F373, 2018. doi: 10.1152/ajprenal.00063.2018. [DOI] [PMC free article] [PubMed] [Google Scholar]
- 5.Hoste EA, Bagshaw SM, Bellomo R, Cely CM, Colman R, Cruz DN, Edipidis K, Forni LG, Gomersall CD, Govil D, Honoré PM, Joannes-Boyau O, Joannidis M, Korhonen A-MM, Lavrentieva A, Mehta RL, Palevsky P, Roessler E, Ronco C, Uchino S, Vazquez JA, Vidal Andrade E, Webb S, Kellum JA. Epidemiology of acute kidney injury in critically ill patients: the multinational AKI-EPI study. Intensive Care Med 41: 1411–1423, 2015. doi: 10.1007/s00134-015-3934-7. [DOI] [PubMed] [Google Scholar]
- 6.Howles GP, Bing KF, Qi Y, Rosenzweig SJ, Nightingale KR, Johnson GA. Contrast-enhanced in vivo magnetic resonance microscopy of the mouse brain enabled by noninvasive opening of the blood-brain barrier with ultrasound. Magn Reson Med 64: 995–1004, 2010. doi: 10.1002/mrm.22411. [DOI] [PMC free article] [PubMed] [Google Scholar]
- 7.Hull TD, Agarwal A, Hoyt K. New ultrasound techniques promise further advances in AKI and CKD. J Am Soc Nephrol 28: 3452–3460, 2017. doi: 10.1681/ASN.2017060647. [DOI] [PMC free article] [PubMed] [Google Scholar]
- 8.Lin E, Alessio A. What are the basic concepts of temporal, contrast, and spatial resolution in cardiac CT? J Cardiovasc Comput Tomogr 3: 403–408, 2009. doi: 10.1016/j.jcct.2009.07.003. [DOI] [PMC free article] [PubMed] [Google Scholar]
- 9.Malhotra R, Siew ED. Biomarkers for the early detection and prognosis of acute kidney injury. Clin J Am Soc Nephrol 12: 149–173, 2017. doi: 10.2215/CJN.01300216. [DOI] [PMC free article] [PubMed] [Google Scholar]
- 10.Morrell GR, Zhang JL, Lee VS. Magnetic resonance imaging of the fibrotic kidney. J Am Soc Nephrol 28: 2564–2570, 2017. doi: 10.1681/ASN.2016101089. [DOI] [PMC free article] [PubMed] [Google Scholar]
- 11.Ozkok A, Edelstein CL. Pathophysiology of cisplatin-induced acute kidney injury. BioMed Res Int 2014: 967826, 2014. doi: 10.1155/2014/967826. [DOI] [PMC free article] [PubMed] [Google Scholar]
- 12.Palevsky PM, Liu KD, Brophy PD, Chawla LS, Parikh CR, Thakar CV, Tolwani AJ, Waikar SS, Weisbord SD. KDOQI US commentary on the 2012 KDIGO clinical practice guideline for acute kidney injury. Am J Kidney Dis 61: 649–672, 2013. doi: 10.1053/j.ajkd.2013.02.349. [DOI] [PubMed] [Google Scholar]
- 13.Privratsky JR, Zhang J, Lu X, Rudemiller N, Wei Q, Yu Y-RR, Gunn MD, Crowley SD. Interleukin 1 receptor (IL-1R1) activation exacerbates toxin-induced acute kidney injury. Am J Physiol Renal Physiol 315: F682–F691, 2018. doi: 10.1152/ajprenal.00104.2018. [DOI] [PMC free article] [PubMed] [Google Scholar]
- 14.Seguro AC, Shimizu MH, Kudo LH, dos Santos Rocha A. Renal concentration defect induced by cisplatin. The role of thick ascending limb and papillary collecting duct. Am J Nephrol 9: 59–65, 1989. doi: 10.1159/000167938. [DOI] [PubMed] [Google Scholar]
- 15.Starosolski Z, Villamizar CA, Rendon D, Paldino MJ, Milewicz DM, Ghaghada KB, Annapragada AV. Ultra high-resolution in vivo computed tomography imaging of mouse cerebrovasculature using a long circulating blood pool contrast agent. Sci Rep 5: 10178, 2015. doi: 10.1038/srep10178. [DOI] [PMC free article] [PubMed] [Google Scholar]
- 16.Subashi E, Moding EJ, Cofer GP, MacFall JR, Kirsch DG, Qi Y, Johnson GA. A comparison of radial keyhole strategies for high spatial and temporal resolution 4D contrast-enhanced MRI in small animal tumor models. Med Phys 40: 022304, 2013. doi: 10.1118/1.4774050. [DOI] [PMC free article] [PubMed] [Google Scholar]
- 17.Thomsen HS. Nephrogenic systemic fibrosis: history and epidemiology. Radiol Clin North Am 47: 827–831, 2009. doi: 10.1016/j.rcl.2009.05.003. [DOI] [PubMed] [Google Scholar]
- 18.Thomsen HS, Marckmann P. Extracellular Gd-CA: differences in prevalence of NSF. Eur J Radiol 66: 180–183, 2008. doi: 10.1016/j.ejrad.2008.01.024. [DOI] [PubMed] [Google Scholar]
- 19.Xie L, Bennett KM, Liu C, Johnson GA, Zhang JL, Lee VS. MRI tools for assessment of microstructure and nephron function of the kidney. Am J Physiol Renal Physiol 311: F1109–F1124, 2016. doi: 10.1152/ajprenal.00134.2016. [DOI] [PMC free article] [PubMed] [Google Scholar]
- 20.Xie L, Layton AT, Wang N, Larson PE, Zhang JL, Lee VS, Liu C, Johnson GA. Dynamic contrast-enhanced quantitative susceptibility mapping with ultrashort echo time MRI for evaluating renal function. Am J Physiol Renal Physiol 310: F174–F182, 2016. doi: 10.1152/ajprenal.00351.2015. [DOI] [PMC free article] [PubMed] [Google Scholar]
- 21.Xie L, Qi Y, Subashi E, Liao G, Miller-DeGraff L, Jetten AM, Johnson GA. 4D MRI of polycystic kidneys from rapamycin-treated Glis3-deficient mice. NMR Biomed 28: 546–554, 2015. doi: 10.1002/nbm.3281. [DOI] [PMC free article] [PubMed] [Google Scholar]
- 22.Zhang D, Liu Y, Wei Q, Huo Y, Liu K, Liu F, Dong Z. Tubular p53 regulates multiple genes to mediate AKI. J Am Soc Nephrol 25: 2278–2289, 2014. doi: 10.1681/ASN.2013080902. [DOI] [PMC free article] [PubMed] [Google Scholar]
- 23.Zhang J, Rudemiller NP, Patel MB, Wei Q, Karlovich NS, Jeffs AD, Wu M, Sparks MA, Privratsky JR, Herrera M, Gurley SB, Nedospasov SA, Crowley SD. Competing actions of type 1 angiotensin II receptors expressed on T lymphocytes and kidney epithelium during cisplatin-induced AKI. J Am Soc Nephrol 27: 2257–2264, 2016. doi: 10.1681/ASN.2015060683. [DOI] [PMC free article] [PubMed] [Google Scholar]
- 24.Zhou HY, Chen TW, Zhang XM. Functional magnetic resonance imaging in acute kidney injury: present status. BioMed Res Int 2016: 2027370, 2016. doi: 10.1155/2016/2027370. [DOI] [PMC free article] [PubMed] [Google Scholar]
Associated Data
This section collects any data citations, data availability statements, or supplementary materials included in this article.


