Abstract
Theories of neural coding in the taste system typically rely exclusively on data gleaned from taste-responsive cells. However, even in the nucleus tractus solitarius (NTS), the first stage of central processing, neurons with taste selectivity coexist with neurons whose activity is linked to motor behavior related to ingestion. We recorded from a large (n = 324) sample of NTS neurons recorded in awake rats, examining both their taste selectivity and the association of their activity with licking. All subjects were implanted with a bundle of microelectrodes aimed at the NTS and allowed to recover. Following moderate water deprivation, rats were placed in an experimental chamber where tastants or artificial saliva (AS) were delivered from a lick spout. Electrophysiological responses were recorded, and waveforms from single cells were isolated offline. Results showed that only a minority of NTS cells responded to taste stimuli as determined by conventional firing-rate measures. In contrast, most cells, including taste-responsive cells, tracked the lick pattern, as evidenced by significant lick coherence in the 5- to 7-Hz range. Several quantitative measures of taste selectivity and lick relatedness showed that the population formed a continuum, ranging from cells dominated by taste responses to those dominated by lick relatedness. Moreover, even neurons whose responses were highly correlated with lick activity could convey substantial information about taste quality. In all, data point to a blurred boundary between taste-dominated and lick-related cells in NTS, suggesting that information from the taste of food and from the movements it evokes are seamlessly integrated.
NEW & NOTEWORTHY Neurons in the rostral nucleus of the solitary tract (NTS) are known to encode information about taste. However, recordings from awake rats reveal that only a minority of NTS cells respond exclusively to taste stimuli. The majority of neurons track behaviors associated with food consumption, and even strongly lick-related neurons could convey information about taste quality. These findings suggest that the NTS integrates information from both taste and behavior to identify food.
Keywords: electrophysiology, gustation, licking, neural coding, taste
INTRODUCTION
The idea that sensation is a fundamentally active process has produced a paradigm shift in our understanding of sensory processing (Schroeder et al. 2010). A critical link between behavior and the activation of sensory neurons has been shown in somatosensation (Gordon et al. 2013; Mitchinson and Prescott 2013; Sherman et al. 2013), vision (Rucci and Victor 2015), and olfaction (Nunez-Parra et al. 2014; Wachowiak 2011). In olfaction, for example, the dynamics of responses to odorants are shaped by the sniffing cycle in ways that can only be fully appreciated in awake animals (Wachowiak 2011). In rats (or mice) under experimental conditions, the lick is thought to be the reference for encoding information about taste stimuli (Gutierrez et al. 2010). Moreover, in both olfaction and gustation, learning modifies both the motor and, consequently, sensory responses to a stimulus. For example, Gutierrez et al. (2010) have shown that as learning of a go/no-go task progresses, large networks of cells across structures are recruited to synchronize with the lick rhythm. Thus the study of sensory coding in general and in the taste system in particular is best viewed in the context of motor behavior, that is, as a sensorimotor function.
Close orchestration of sensory and motor behavior is necessary both to avoid the ingestion of potential poisons and to promote the ingestion of nutrients. When an animal approaches a lick spout, it initiates a lick sequence before a taste stimulus enters the mouth. This behavior is thought to be evoked by commands sent downstream from a distributed cortical network (Gutierrez et al. 2006; Li et al. 2016). Once the taste stimulus enters the mouth and taste quality is determined, the stimulus is evaluated in terms of hedonic valence (Katz et al. 2001). If the result is an unpleasant sensation, the lick pattern may be altered or stopped altogether. The brain circuitry that orchestrates these alterations must act rapidly to avoid ingestion of potential poisons. Conversely, if a tastant is judged palatable, the lick sequence is sustained to promote ingestion. In decerebrate animals, with only the nucleus tractus solitarius (NTS) and parabrachial nucleus of the pons (PbN) as the remaining nuclei of the gustatory pathway, behavioral sequences indicative of hedonic valence of ingested taste stimuli remain (Grill and Norgren 1978). These data suggest that the sensorimotor coordination of tastants can be accomplished by brain stem nuclei, independent of upstream structure(s) or input.
Although the extant literature typically conceptualizes the rostral NTS as a taste “relay,” it is ideally suited to be an important locus of sensorimotor integration that regulates ingestive behavior. The relay viewpoint derives in large part from anatomy: the rostral NTS receives input from peripheral taste nerves and conveys that information both upstream (Halsell et al. 1996; Herbert et al. 1990; Norgren 1978) to the PbN and downstream to the adjacent reticular formation (Karimnamazi and Travers 1998; Streefland and Jansen 1999). However, electrophysiological recordings from the rostral NTS in alert, freely licking rats have shown that, along with cells that respond to taste stimuli, many cells show clear lick-related activity (Roussin et al. 2012). Moreover, many if not most taste-responsive NTS cells also show some degree of lick coherence (defined as a measure of the strength of association between the occurrence of licks and the simultaneously recorded sequence of spikes). These data beg the question of what the interrelationship of lick-related activity and taste responsiveness in the NTS might be.
To address this question, we recorded from single neurons in the NTS of awake rats as they freely licked tastants representing the basic taste qualities (sweet, sour, salty, bitter, and umami) from a spout. Several characteristics of response patterns were identified, including cells with activity that was strongly and mostly lick related and those with activity dominated by taste responsiveness but which also frequently showed some lick relatedness. Quantification of these characteristics across the population did not suggest a dichotomy into taste-responsive and lick-related neurons, but rather a gamut of activity, without a clear demarcation between these cells. Furthermore, many neurons that were strongly linked to lick activity conveyed information about taste quality. In all, these data suggest that all cells in the NTS, including those that respond to taste in the conventional sense and those that predominantly track behavior, contribute to taste discrimination and ingestive behavior by seamlessly integrating the sensation and motor activity evoked by food.
MATERIALS AND METHODS
Animals
Ninety-five adult male Sprague-Dawley rats (250–550 g) were used for this study. Rats were pair-housed and maintained on a 12:12-h light-dark cycle with lights on beginning at 9:00 PM. Food and water were provided ad libitum except during experimental testing as noted below. All procedures were in accord with the National Institutes of Health Animal Welfare Guide and were approved by the Institutional Animal Care and Use Committee of Binghamton University. A subset of the data reported is a reanalysis of the data previously published in Roussin et al. (2012). We drew from that study all the cells recorded in rats for which both lick-related and taste-responsive cells were present (28 of the 37 rats in that study) and for which we were certain that there were no duplications of cells in recordings across different days. This reanalysis contributed 88 of the 324 cells reported.
Surgery
For the rats reported in Roussin et al. (2012), anesthesia consisted of a mixture of ketamine (100 mg/kg ip) and xylazine (14 mg/kg ip); for the remaining rats, anesthesia consisted of isoflurane (1–3% in O2), Otherwise, the surgical procedures were identical and are summarized below.
Following anesthesia, the head was shaved. Rats were then placed into a stereotaxic instrument with the head tilted downward so that bregma was 4 mm below lambda. With aseptic technique, the head was swabbed three times with iodine followed by 70% ethanol. The skull was exposed along the midline and the fascia was retracted. Six self-tapping screws were inserted into the skull, three on either side of the midline. A burr hole was drilled at ~15.3 mm posterior to bregma and 1.7 mm lateral to the midline to expose the cerebellum above the NTS. The dura was then gently resected. An eight-channel multiwire electrode bundle was slowly lowered to ~5–6 mm ventral to the cerebellar surface. The multiwire electrodes consisted of a bundle of eight formvar-insulated tungsten microwires (25-µm diameter) sheathed in polyimide tubing and cemented to a 127-µm-diameter tungsten strut. The length of the microwires was staggered over a 1-mm depth. The tungsten strut served as a reference electrode. Some rats had 16-channel drivable bundles implanted (polyimide-insulated tungsten, 25-µm diameter, equal length; Innovative Neurophysiology, Durham, NC), instead of a fixed bundle of microwires. When the electrodes approached the taste-responsive area of the NTS, the tongue was bathed with 0.1 M NaCl. Once a response was present, the electrode bundle, or drivable bundle, was cemented to the scalp using dental acrylic. A silver ground wire attached to the connector was wrapped around two screws for the ground contact and embedded in dental cement.
During surgery, pain reflexes were routinely monitored, and a surgical level of anesthesia was maintained with 1–3% isoflurane. Body temperature was maintained at 35–37°C with a heating pad linked to an anal thermistor probe. Postoperative care, including analgesic and antibiotic administration as well as weight and behavioral assessments, was provided for at least 5 days or until the animal regained its preoperative weight.
Taste Stimuli
All cells were tested for responses to representatives of four basic taste qualities. For 142 cells (including all those from Roussin et al. 2012), taste stimuli were NaCl (0.1 M), sucrose (0.1 M), quinine (0.0001 M), and citric acid (0.01 M). For the remaining 182 cells, taste stimuli were NaCl (0.05 M), sucrose (0.1 M), citric acid (0.017 M), and caffeine (0.019 M). In all cases, taste stimuli were dissolved in artificial saliva (AS), and AS was used as a rinse. AS consisted of a mixture of 0.015 M NaCl, 0.022 M KCl, 0.003 M CaCl2, and 0.0006 M MgCl2 at a pH of 5.8 ± 0.2 (Hirata et al. 2005).
Stimuli were delivered through a lick spout consisting of twelve 20-guage stainless steel tubes. Each tube delivered a different stimulus at 12 ± 1 µl per lick, calibrated daily. The pattern for stimulus delivery began with five licks of a water or AS rinse presented on a variable-ratio 5 schedule. Following the rinse, the rat received a single dry (no fluid presented) lick followed by a stimulus presentation of five consecutive licks. Trials were pseudorandomized without repetition until the rat received all taste stimuli. This pattern was repeated for at least 30 min. Licks were recorded when the rat broke an infrared beam across the opening to the lick spout.
Electrophysiological Recording
Rats were water deprived for 22 h before the experimental sessions. Animals were pretrained to lick from the spout in the experimental chamber for several days before electrode implantation surgery. This consisted of 30-min daily sessions in the experimental chamber with access to the lick spout until the rat licked at least 1,000 licks of water or AS per day. This took 3–4 days. For electrophysiological recording, rats were placed inside an operant chamber (Med Associates, St. Albans, VT) and allowed free access to the lick spout. The rat’s head cap was connected to a head stage to record neural signals. A Multichannel Acquisition Processor system (Plexon, Dallas, TX) was used to amplify neural signals (40-kHz sampling rate), and Sort Client software (Plexon) was used to record timing of the amplified signals and lick events. Single units were identified offline using template matching and principal components analysis with Offline Sorter software (Plexon). A 3:1 signal-to-noise ratio and a refractory period of at least 2 ms (Stapleton et al. 2006) were used as criteria for cell isolation. Time stamps of individual spikes and the occurrence of licks were recorded with 25-μs resolution. Rats were run daily for as long as isolatable units were present or for 2 wk past the point when no isolatable taste units could be identified.
Histology
Rats were overdosed with pentobarbital sodium and a direct current (1 mA, cathodal; 10 s) that passed through the electrode through which the last recording was made. Animals were perfused transcardially with isotonic saline (0.15 M NaCl) followed by 10% formalin in isotonic saline. The brains were excised, fixed in 10% formalin for a minimum of 24 h, and cryoprotected in 20% sucrose in PBS for 24 h. Brains were then cryosectioned into 35-µm sections, mounted on gelatinized slides, and stained with cresyl violet for reconstruction of the lesion site. Lesion locations spanned from 12.1 to 13.1 mm posterior and between 1 and 2.2 mm lateral to bregma.
Data Analysis
Taste responses.
Responses to tastants were analyzed using in-house MATLAB software (The MathWorks, Natick, MA) and characterized by methods used in previous studies (Roussin et al. 2012; Weiss et al. 2014). Briefly, a taste response was defined as a significant change in firing rate (in spikes/s) compared with the baseline firing rate. Baseline was determined by the average firing rate across five 100-ms time bins (500 ms) before the first lick of the five-lick stimulus trial. Taste responses were measured by a sliding window (100 ms, 20-ms increments) after the first stimulus lick until a significant difference from baseline was detected. Responses were characterized as activity ≥2.58 SD (99% confidence interval) above (excitatory) or below (inhibitory) the baseline firing rate for at least three consecutive 100-ms bins. The 100-ms window was moved in 20-ms increments until the activity was no longer significantly above the baseline firing rate. Taste-response magnitude was calculated as the average firing rate (in spikes/s) across the entire response interval minus the baseline firing rate. The “best” stimulus for each cell was defined as the stimulus that evoked the greatest response, regardless of whether it was inhibitory or excitatory.
Lick properties.
Lick-related activity of single units was quantified by measures of coherence of licks with neural firing (called “lick coherence”), lick-related excitation, and anti-lick bursting (bursting after the end or before the initiation of lick bouts; lick bouts were defined as at least 4 licks over a period of 750 ms). Recordings were divided into 2.5-s segments, and segments during which the average licking frequency was <5 Hz were excluded. For the remaining segments, coherence was calculated in the range 0.1–50 Hz, using the Chronux MATLAB toolbox function coherencypt with standard parameters (time-bandwidth product 3 and 5 tapers). Thee 95% confidence intervals were estimated using jackknife resampling (Efron and Tibshirani 1998). This analysis was done independently of whether it was a dry lick or which stimulus was present. In fact, cells whose activity synchronized with licks did so whether there was fluid in the mouth or not. Neurons were considered significantly lick coherent if the 95% jackknife confidence interval for the coherence did not contain zero, at any frequency in the range 4–10 Hz. The peak value of lick coherence in that frequency range was used to characterize each cell; in case of multiple significant peaks, the peak at the lowest temporal frequency was used.
Anti-lick bursting was quantified by first identifying transitions from periods of no licking (for at least 750 ms) directly to sustained licking activity (a lick bout) or vice versa. Next, the mean firing rates before the start of a bout, after the start of a bout, before the end of a bout, and after the end of a bout were calculated using a 500-ms window before/after the beginning/end of the previously identified lick bout transitions. The anti-lick bursting score was calculated as log2(postbout end FR/prebout end FR) − log2(postbout start FR/prebout start FR). For example, a score of 1 indicates twice as great a change in firing rate at the cessation of a lick bout compared with the change at the onset.
Temporal coding.
To characterize the contribution of the temporal structure of a response to the neural code for taste, data were analyzed by the metric space method of Victor and Purpura (1996, 1997). These methods determine whether the statistics of the precise times of individual spikes carry information concerning the taste stimuli. They are appropriate for data sets with a relatively small number of trials and were applied to all recordings in which there were at least six responses recorded for each tastant.
We summarize this approach here. The strategy is to determine whether spike trains elicited by repeated presentations of the same tastant (e.g., repeated presentations of NaCl) are more similar to each other than to spike trains elicited by different tastants (e.g., NaCl and sucrose) and to make this comparison with a range of notions of similarity (“metrics”) that are sensitive to temporal structure on different scales. Each metric is calculated by determining the minimum “cost” to transform one spike train into another. For all metrics, inserting or deleting a spike has a unit cost; the cost to shift a spike in time is determined by a parameter q. At one extreme, q = 0, shifting a spike in time has no cost, so the cost to transform one spike train to another is equal to the difference in the number of spikes. This is Dcount, the spike count distance. For positive values of q, we refer to the metric as the spike time distance, Dspike(q). Because shifting a spike by amount of time t has a cost of qt, spike trains with similar numbers of spikes and similar spike times on the timescale of 1/q will be considered similar, whereas spike trains with very different numbers of spikes and/or spikes occurring at very different times (again, on the timescale of 1/q) will be considered dissimilar, so q can be interpreted as the temporal precision of the code.
For each metric, H(q), the information conveyed at various levels of precision (values of q) is calculated by using the distance from each spike train to the others to attempt to infer the stimulus that elicited it, and then computing the mutual information between the inferred stimulus labels and true stimulus labels. For Dcount, the information conveyed is designated by Ho; for each Dspike(q) value, the information conveyed is designated by H(q). Next, qmax, the value of q at which H(q) is maximized, is determined, and this maximal amount of information, H(qmax), is denoted Hmax. Thus the relative contribution of spike count and spike timing to the information conveyed by taste responses can be quantified by comparing Ho and Hmax.
Several additional analyses serve as controls and refinements. To exclude spurious results due to small sample size, results are compared with the information Hshuffled obtained from analyses of surrogate data sets in which the labels assigned to stimuli are randomly permuted. To distinguish between coding via a time-varying firing rate (e.g., an inhomogeneous Poisson process) vs. coding in which the timing of individual spikes is critical, we use “exchange resampling,” which compares the results to the information Hexchange obtained from surrogate data sets in which spike times are randomly shuffled within responses to the same stimulus (see Di Lorenzo and Victor 2003 for further details).
The above analysis was applied to spiking activity beginning at 200, 500, 1,000, 1,500, and 2,000 ms of spike activity beginning with the first stimulus lick of the five-lick stimulus trial. Many cells did not show significant responses over the full five-lick stimulus period but instead showed brief but reliable taste-evoked responses following individual stimulus licks. We therefore also analyzed information conveyed by spike activity following the first 150 and 170 ms after each stimulus lick within the five-lick trial. Finally, we applied the metric space analyses to the lick pattern in each five-lick trial (treating the licks as the “spikes” used in the spike metric calculations described above), with the first lick used as the start time.
RESULTS
We report responses of 324 neurons in the NTS, derived from 936 recordings from microwire arrays in a total of 95 rats (see materials and methods). A total of 415 recordings were excluded because they were recorded on different wires in the same session and had cross-correlation functions characterized by a single peak at zero, and 137 were excluded because they were recorded on the same wire but different day and their action potentials had indistinguishable extracellularly recorded waveforms (Sammons et al. 2016). Of the 384 unique neurons, 60 were excluded from analysis because their firing rates were very low or because there were fewer than five trials per stimulus in the session. Of the final 324 cells, 202 (62.3%) were recorded from movable microelectrode arrays in 24 rats and 122 (37.7%) were recorded from fixed microelectrode arrays in 71 rats.
All cells were tested with the basic stimulus presentation protocol described in materials and methods. Thus the sample included cells that responded to at least one tastant (designated “taste cells”) and those that did not respond to any tastant (designated “nontaste cells”), as determined by the changes in their firing rate (see materials and methods, Taste responses).
Among both taste cells and nontaste cells were cells that showed different kinds of relationships to licks, including anti-lick and lick bout cells, defined below. We examined the relationship of spiking to lick activity in two ways: first, whether cells tended to increase or decrease their firing rate during a lick bout, and second, whether spiking activity was correlated to licking activity on a lick-by-lick basis, as quantified by a coherence measure.
Taste-Responsive Cells
There were 70 (of 324, 22%) cells that showed a significant response to at least one of the representatives of the four taste qualities. (We did not include responses to an umami stimulus because not all cells were tested with it.) Figures 1 and 2 characterize the responsivity of the taste cells that were part of the present data set (with taste responses to quinine and caffeine pooled as “bitter”). Across the sample, all taste qualities evoked both excitatory and inhibitory responses and all taste qualities evoked nearly equal mean response magnitudes on average (see Fig. 1). In fact, there were no significant differences in response magnitude across either excitatory (F3, 92 = 2.44, P = 0.1) or inhibitory (F3,56 = 0.30, P = 0.83) responses. This result is consistent with previous research (Escanilla et al. 2015; Roussin et al. 2012). The majority of taste-responsive cells (58%) responded to one or two of the four taste qualities, with NaCl and citric acid being the most effective tastants (see Fig. 2).
Fig. 1.
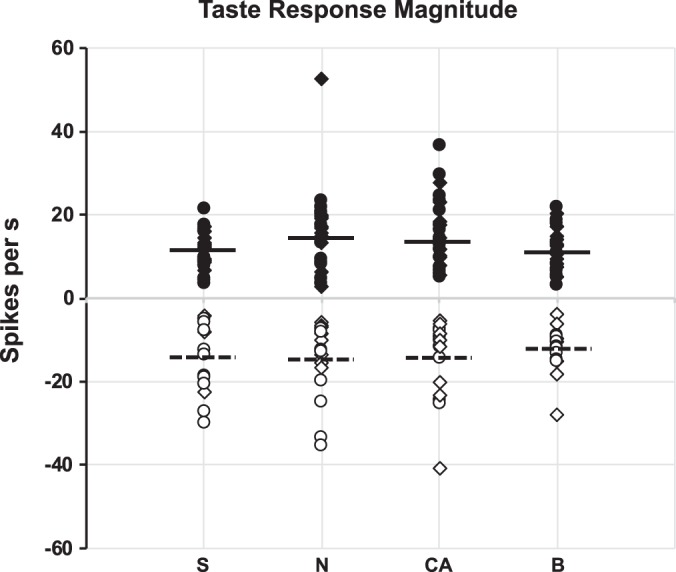
Response magnitudes evoked by all taste stimuli in taste-responsive nucleus of the solitary tract (NTS) cells (n = 70). Closed symbols represent excitatory responses; open symbols represent inhibitory responses. Horizontal lines for each stimulus show the median excitatory and inhibitory response magnitudes. Circles show responses to NaCl (0.1 M), sucrose (0.1 M), quinine (0.0001 M), and citric acid (0.01 M); diamonds show responses to NaCl (0.05M), sucrose (0.1 M), citric acid (0.017 M), and caffeine (0.019 M). B, bitter (either quinine or caffeine); CA, citric acid; N, NaCl; S, sucrose.
Fig. 2.
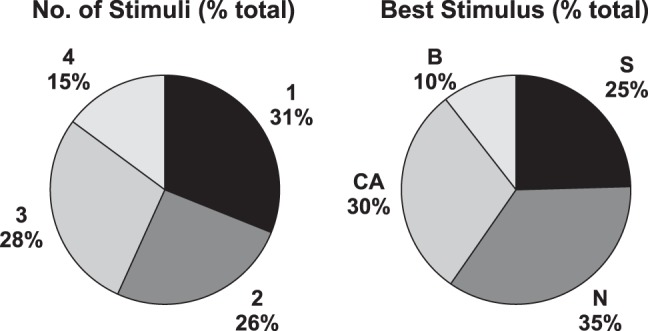
Taste tuning of nucleus of the solitary tract (NTS) cells (n = 70). Left: proportion of cells that responded to 1–4 of the taste stimuli presented. Right: proportion of cells that responded best (either increase or decrease) to each of the tastants presented. B, bitter (either quinine or caffeine); CA, citric acid; N, NaCl; S, sucrose.
Anti-Lick and Lick Bout Cells
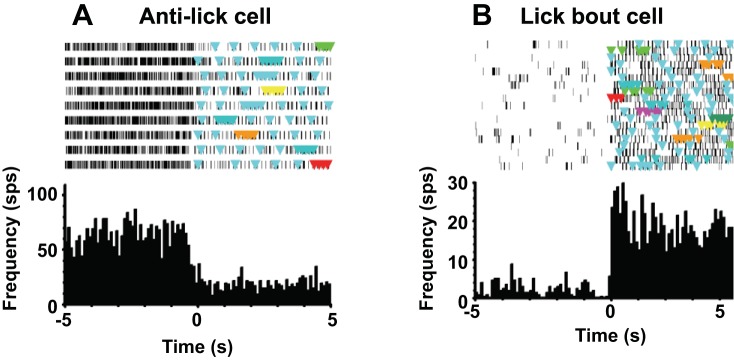
In examining the relationship of neuronal activity to lick bouts, we found two prominent patterns. The first was characterized by a significant drop in firing rate during the lick bout, accompanied by a burst of activity just before and just after the lick bout. This property was described by the “anti-lick busting score” (see Roussin et al. 2012; see materials and methods). There were 29 cells (of 324; 9%) that showed clear anti-lick bursting properties. Figure 3 shows the distribution of anti-lick bursting scores. We designated cells as anti-lick if their anti-lick bursting score was ≥5.0, the top 9% of the distribution. Although these cells substantially reduced their firing rate during lick bouts, they could show some degree of lick coherence (mean coherence = 0.16 ± 0.01; see below). Figure 4A shows an example of activity in an anti-lick cell. For this cell, the onset of a lick bout was accompanied by a notable decrease in firing rate.
Fig. 3.
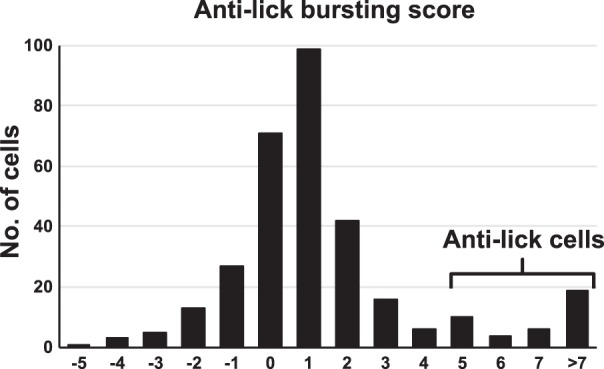
Distribution of anti-lick bursting scores for all cells. Cells with scores in the top 9% of the distribution (i.e., scores ≥5.0) were labeled “anti-lick” cells.
Fig. 4.
A: example of an anti-lick cell firing pattern. B: example of a lick bout cell firing pattern. Both A and B, top, show a raster plot of cell activity, where colored triangles indicate occurrence of a lick; time 0 (bottom) indicates the initiation of a lick bout. sps, Spikes/s.
Seven cells showed distinctive changes in firing rate in relation to the onset/offset of lick bouts. (A lick bout was defined as 1 s of continuous licking.) This pattern was opposite to that of the anti-lick cells. In general, these cells had relatively low spontaneous firing rates but substantially increased their firing rate when a lick bout was initiated. Figure 4B shows an example of activity in a cell with a lick bout pattern of firing. When the lick bout began, firing rate in this cell increased markedly.
Figure 5 shows the distribution of the difference between firing rates during spontaneous activity (≥10-s periods without licking) and firing rates while the animal was licking. Taste cells, nontaste cells, anti-lick cells, and lick bout cells are shown. A one-way ANOVA of these differences showed a significant group effect (F3,320 = 57.41, P < 0.0001). There were statistically significant differences between anti-lick cells and taste cells (Student-Newman-Keuls, P = 0.04), nontaste cells (Student-Newman-Keuls, P = 0.029) and lick bout cells (Student-Newman-Keuls, P < 0.0001). With one exception, all anti-lick cells showed firing rates during licking of <1.0 spike/s, whereas taste and nontaste cells had a much broader distribution of values. Similarly, there were also statistically significant differences between lick bout cells and all other cell groups (Student-Newman-Keuls, all P < 0.0001). Lick bout cells are all located at the far left of Fig. 5.
Fig. 5.
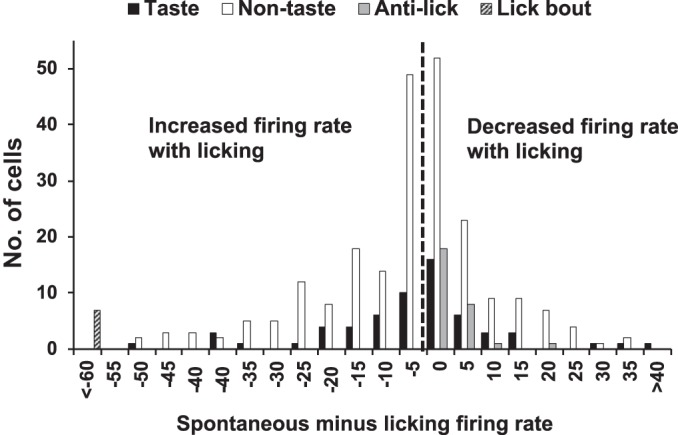
Distribution of the difference between spontaneous firing rate and firing rate during licking for all cells.
Quantification of Lick-Related Properties
All cells were characterized according to their lick coherence and the lick phase angle at which they responded most vigorously. Figure 6 shows the distribution of lick coherence values (at the frequency with the greatest lick coherence value) for nontaste cells, taste cells, anti-lick cells, and lick bout cells. It can be seen that the distributions of lick coherence values for all groups of cells overlap extensively (taste cells: mean = 0.42 ± 0.03, median = 0.36; nontaste cells: mean = 0.42 ± 0.02, median = 0.37; anti-lick cells: mean = 0.16 ± 0.01, median = 0.15; lick bout cells: mean = 0.48 ± 0.08, median = 0.44). Although our main point is that there is substantial overlap in the extent to which units in each subgroup show lick-related activity, there are discernable differences. Specifically, a one-way ANOVA showed a significant group effect (F3,320 = 11.18; P < 0.0001). Pairwise comparisons using Student-Newman-Keuls tests showed that lick coherence values in anti-lick cells were significantly different from lick coherence values in taste, nontaste, and lick bout groups (all P < 0.008). There were no significant differences between lick coherence values among taste, nontaste, and lick bout cells (all P > 0.55).
Fig. 6.
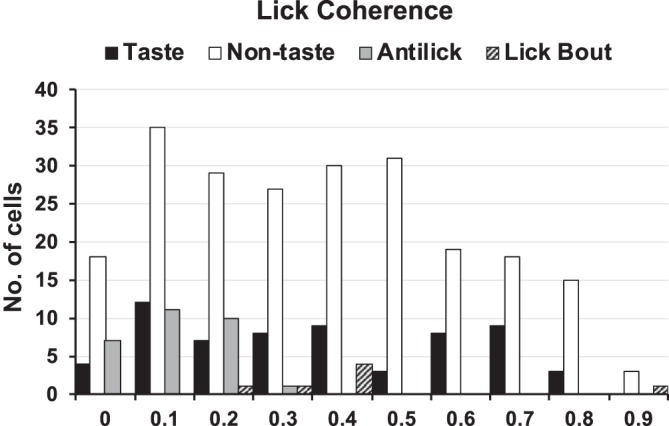
Distribution of lick coherence values in the various cell groups recorded in the nucleus of the solitary tract (NTS). Taste and nontaste cells show overlapping distribution of lick coherence; anti-lick cells show relatively low lick coherence values.
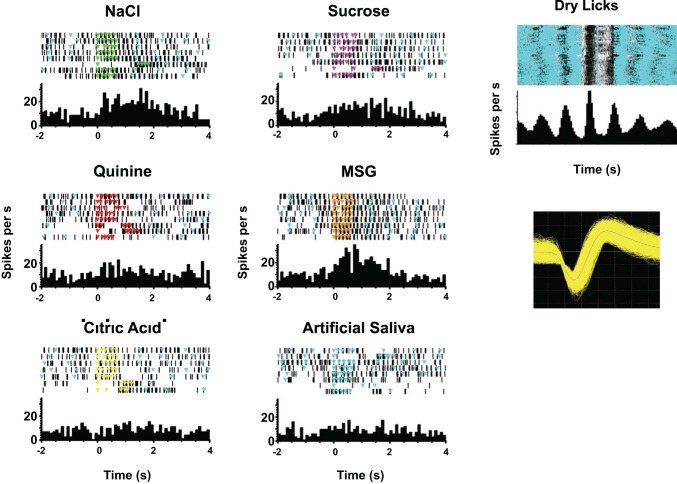
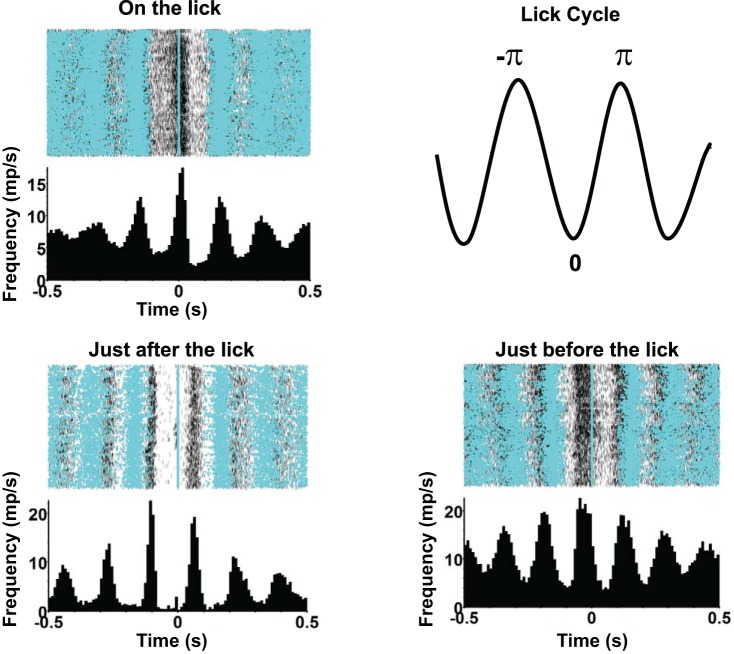
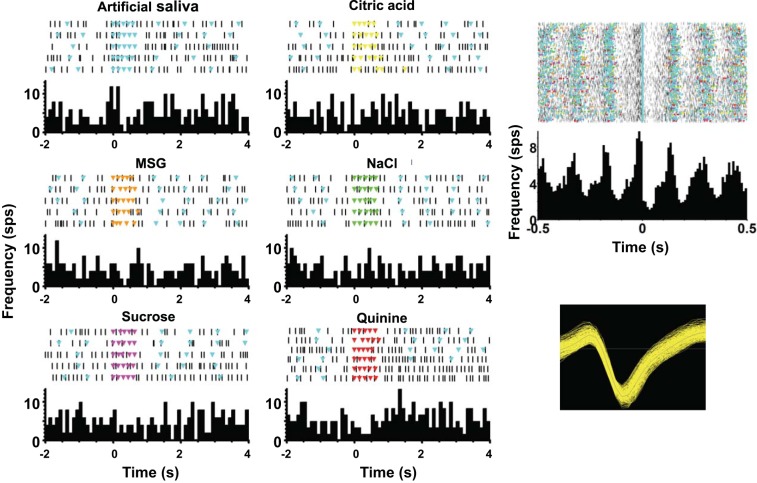
Many taste-responsive cells had substantial lick coherence; a typical example is shown in Fig. 7. It can be seen that firing is strongly correlated with licks (Fig. 7, top right). Superimposed on this rhythmic firing, there are increases in firing rate driven by a subset of tastants, with the largest response for monosodium glutamate (Fig. 7, left, MSG). Lick coherence for this cell was 0.41, and the phase corresponded to firing most vigorously just before the lick occurred. As shown in Fig. 8, the population also contained cells with strong lick coherence but different lick phases, including firing that is synchronous to the lick, just before the lick, or just after the lick.
Fig. 7.
Example of a taste-responsive cell with strong lick-related properties. Left: responses to each tastant and artificial saliva. Each panel shows a raster plot (top) of cellular activity with colored triangles indicating licks (light blue triangles always indicate artificial saliva licks; occurrence of dry licks is not shown) and the associated peristimulus time histogram (bottom). Right: activity time-locked to dry (unreinforced) licks (top) and a waveform of the recorded cell (bottom). MSG, monosodium glutamate.
Fig. 8.
Examples of cells with peak firing rates at different phases of the lick cycle. Top right: a depiction of how the lick phase angle was measured, where 0 signifies the midpoint of the time between licks and ±π signifies the time of the lick preceding or following the trough in the cycle. None of the cells shown were taste responsive.
Figure 9 shows a plot of lick phase angle vs. lick coherence measures. Only cells with significant lick coherence (see materials and methods) are shown. Among those, taste-responsive cells (n = 55 of 70; 79%) were intermingled with cells that were not taste responsive (n = 188 of 254; 74%). It can be seen that for both taste and nontaste cells, there was a wide distribution of favored lick phase angles. There was no lick phase angle that was favored by either taste or nontaste cells (Rayleigh phase criterion for taste cells, P = 0.47; for nontaste cells, P = 0.17).
Fig. 9.
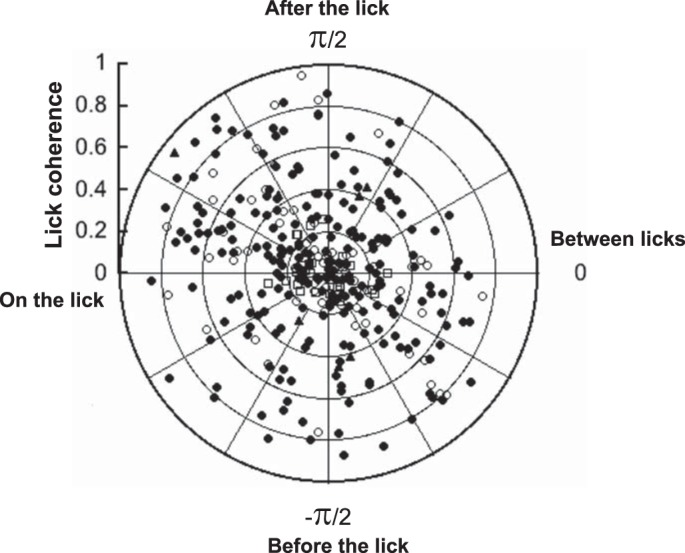
Plot of lick phase angle vs. lick coherence value for all cells. Open circles show taste cells; closed circles show nontaste cells; open squares show anti-lick cells; and closed triangles show lick bout cells.
Temporal Coding in NTS Cells
Among the 324 cells in the sample, there were 313 cells for which we recorded at least six trials of each stimulus; in this subset, we applied the metric space method (Victor and Purpura 1996, 1997) to determine whether the number and temporal pattern of spikes conveyed information about taste quality. Of these 313 cells, 69 were determined to be taste responsive and 244 non-taste responsive by the firing rate criteria described above.
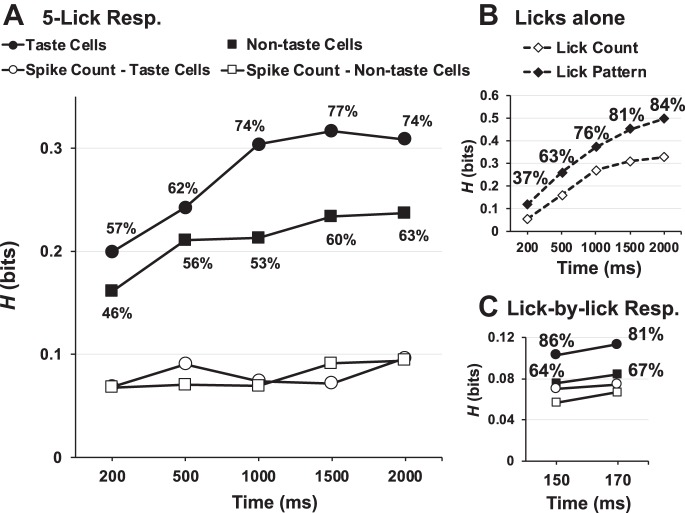
Figure 10A shows the results of the metric space analyses of the firing patterns of the taste-evoked responses; Fig. 10B shows the results of a parallel analysis applied to the licks. As described in materials and methods, only those cells whose information (TPMC debiased) exceeded the information conveyed by shuffled responses +2 SD were considered to contribute a significant amount of information about taste quality; if the information for a cell did not reach statistical significance, it was replaced by zero before averaging. This graph represents the average information across the population; overlapping but distinct groups of cells contributed statistically significant amounts of information at different time points. The proportion of cells that showed a significant contribution of information about taste quality at each time point is indicated.
Fig. 10.
Temporal and rate coding in nucleus of the solitary tract (NTS) cells. A: cumulative amount of information (H) conveyed about taste quality by the temporal and rate properties of the taste-evoked spike trains (closed symbols) and by firing rate alone (open symbols). B: information conveyed by lick count and lick pattern. C: information conveyed by lick-by-lick responses (Resp.). For A and B, the analysis began with the first stimulus lick. For C, each stimulus lick was used as a starting point for the analyses. Percentages next to each point on graphs indicate the percentage of cells (A and C) or animals (B) that showed a significant amount of information.
Two features of Fig. 10, A and B, are noteworthy. First, and importantly, Fig. 10A shows that, just as is the case for taste cells, the firing patterns in nontaste cells also convey information about taste quality. In fact, in the early portions of the taste response, the amount of information conveyed by nontaste cells is not significantly different from that conveyed by taste cells (Wilcoxon rank-sum test, P = 0.193 for 200 ms; P = 0.264 for 500 ms). In the later portions of the response (1,000, 1,500, and 2,000 ms), information about taste quality conveyed by taste cells is significantly higher than that conveyed by nontaste cells (Wilcoxon rank-sum tests, all P < 0.005). The median and interquartile range of Hmax for all response intervals in taste cells, nontaste cells, and the lick pattern are shown in Table 1.
Table 1.
Information analyses: medians and interquartile range
| Response Interval |
||||||||||
|---|---|---|---|---|---|---|---|---|---|---|
| 200 ms |
500 ms |
1,000 ms |
1,500 ms |
2,000 ms |
||||||
| Median | IQR | Median | IQR | Median | IQR | Median | IQR | Median | IQR | |
| Taste | 0.19 | 0.34 | 0.21 | 0.43 | 0.34 | 0.39 | 0.35 | 0.32 | 0.36 | 0.45 |
| Nontaste | 0.00 | 0.30 | 0.16 | 0.38 | 0.16 | 0.39 | 0.24 | 0.41 | 0.24 | 0.38 |
| Licks | 0.00 | 0.25 | 0.26 | 0.45 | 0.37 | 0.41 | 0.47 | 0.38 | 0.52 | 0.40 |
IQR, interquartile range.
An example of a nontaste cell that conveys a significant amount of information about taste quality is shown in Fig. 11. This cell shows lick-related firing but does not respond to taste stimuli with increases in its firing rate. Nevertheless, the information that it conveys at 2.0 s is 0.485, significantly greater than Hshuffled + 2 SD. Hmax did not exceed Hexchange, however, and this suggests that the rate envelope is the informative aspect of the taste-evoked firing pattern in this cell. Second, as the taste response unfolds over time, the lick pattern comes to convey more information about the taste quality than spike patterns of NTS cells (see Fig. 10B). Specifically, in the earliest taste-response intervals, the firing patterns of both taste (Wilcoxon rank-sum test, 200 ms, P = 0.0015) and nontaste (P = 0.02) convey more information about taste quality than the lick pattern alone. At 500 (P = 0.58) and 1,000 ms (P = 0.087), there is no significant difference between the information conveyed by the firing pattern in taste cells vs. the lick pattern, but the lick pattern is significantly more informative than the firing pattern in nontaste cells (P = 0.019 and P < 0.0001, respectively). At longer response intervals, the lick pattern is more informative about taste quality than firing patterns in both taste and nontaste cells (all P < 0.005).
Fig. 11.
Example of a nontaste cell with strong lick-related properties. Left: responses to each tastant and artificial saliva. Each panel shows a raster plot (top) of cellular activity with colored triangles indicating licks (light blue triangles always indicate artificial saliva licks) and the associated peristimulus time histogram (bottom). Right: activity time-locked to dry (unreinforced) licks (top) and a waveform of the recorded cell (bottom). MSG, monosodium glutamate.
In Fig. 10C, the information about taste quality contributed by taste cells and nontaste cells in the lick-by-lick response analysis is shown. Each stimulus lick is used as the starting point of an analysis. It is clear that even at short intervals after a stimulus lick, when presumably there are no intervening licks, the temporal characteristics of evoked spike trains in taste cells and nontaste cells convey more information about taste quality than spike count. This implies that the information content, even in nontaste cells, is not merely a reflection of the lick pattern.
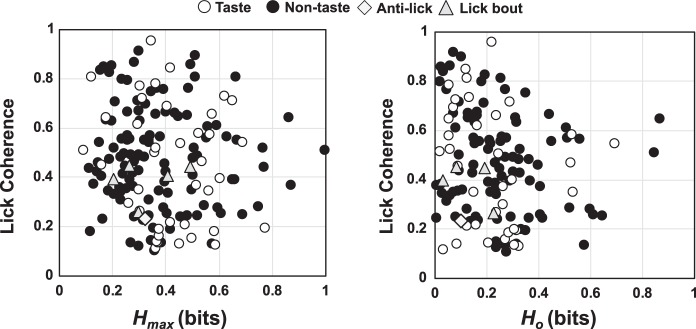
Figure 12 shows the relationship of information conveyed by the temporal characteristics (left) or the spike count (right) to lick coherence. Only those cells with a significant lick coherence score and significant information conveyed about taste quality were shown. As expected from Fig. 12, the overall amount of information conveyed about taste is higher when temporal pattern is considered (Fig. 12, left) than when it is not (Fig. 12, right; Wilcoxon rank-sum test, P < 0.0001). There was a weak but significant correlation of both Hcount (r = 0.16; P = 0.0213) and Hmax (r = 0.21; P = 0.0014) with lick coherence. Notably, taste cells are intermingled with nontaste cells along both dimensions. Thus taste and nontaste cells vary widely in their coherence with licking and the information that they convey about taste quality, and coherence with licking is only a weak predictor of the amount of information that can be conveyed by the taste-evoked spike train.
Fig. 12.
Plot of information about taste quality conveyed by rate and temporal coding (left) and by spike count alone (right; Ho) vs. lick coherence. Only cells with significant lick coherence and significant information (Hmax > Hshuffled; see materials and methods, Temporal coding) are included.
Histology
Histological results were obtained from 46 of 95 animals. Of these, electrode placement ranged from 11.4 to 12.72 mm posterior to bregma. The median coordinates were 12.12 mm posterior to bregma, 1.8 mm lateral to the midline, and 8 mm ventral to bregma. Lesions were located throughout the NTS with 17 in the medial NTS, 8 in the intermediate-medial NTS, 1 in the dorsal-medial NTS, 6 in the lateral NTS, 6 in the ventral NTS, 3 in the ventral-lateral NTS, 2 lateral to the NTS, 2 medial to the NTS, and 1 ventral to the NTS. The positions of 230 neurons were reconstructed: 29.6% (n = 68) were classified as taste responsive by the firing rate criteria discussed above, and 71.7% (n = 165) were lick related. These were not mutually exclusive qualities. In the ventral NTS, only 2 of 16 (12.5%) were taste responsive. A high proportion of lick-related cells (81.1%; n = 77 of 95) were located in the medial NTS. No other distinctions could be made between neurons recorded between the different subsections of the NTS.
In addition to the animals with available histology, there were 12 rats in which a taste-responsive cell was recorded along with a lick-related or anti-lick cell. This accounted for 25 additional cells.
DISCUSSION
Although the NTS is generally regarded as a relay nucleus for taste, our results show that most neurons show firing patterns that are related to licking. Our second main finding is that most cells, including those whose activity is strongly correlated with licking, have firing patterns that convey information about taste quality, but only a minority of these do so via a simple change in firing rate for specific tastants. We also found that although one may classify cells into categories of taste responsive or not, and lick related or not, quantitative measures (e.g., measures of information conveyed, measures of lick coherence) show a continuum of behavior along both axes. Although there are purely taste-responsive cells with little to no lick coherence at one extreme and purely lick-related cells with no taste responsiveness at the other (Roussin et al. 2012), all combinations are present. Collectively, these observations suggest that the NTS may integrate information from both the taste and the motor activity that is evoked by food.
The existence of neurons that track motor behavior, e.g., licking, in the taste-responsive portion of the brain stem has been noted in several structures along the gustatory neuraxis including the NTS (Roussin et al. 2012), PbN (Schwartzbaum 1983; Weiss et al. 2014), and gustatory cortex (Stapleton et al. 2006). Specifically, in each study of brain stem and cortical recordings of taste in freely licking subjects, there were reports of other cell types in addition to those solely responsive to taste. In the study of Nakamura and Norgren (1991), 16/117 (14%) did not respond to taste stimuli; in Roussin et al. (2012), 23/107 (21%) were lick related but not taste responsive and 28/107 (26%) were anti-lick cells (not all of these were included in the present study). In Weiss et al. (2014), 28/77 (36%) of PbN cells were solely lick related and another 8/49 taste-responsive cells showed lick-related activity. In the gustatory cortex, 66% of the cells were not taste responsive but instead tracked the lick pattern (Stapleton et al. 2006). The proportion of non-taste-responsive cells (as assessed via firing rate measures) in the present study of the NTS is larger than those in previous studies. However, it is possible that the unbiased inclusion of all cell types in the NTS, regardless of taste sensitivity, has resulted in the observation that taste-responsive cells are a decided minority of cell type in the NTS.
Although we identified a small population of cells (anti-lick and lick bout cells) with distinctive lick-related behavior, we did not identify any lick-related characteristics that suggested a dichotomy between taste-responsive and non-taste-responsive cells. In fact, the characteristics of taste-related and lick-related cells overlap along several dimensions. For example, cells in the NTS showed a wide distribution of lick coherence values, though taste-responsive and anti-lick cells tended to have lower lick coherence values overall. In addition, there were no categorical distinctions between taste-responsive and non-taste-responsive cells in their preferred lick phase angles. Moreover, there was no predictive relationship between the degree of lick coherence and the preferred lick phase angle. Collectively, these results suggest that when the animal initiates licking, firing patterns in the great majority of both taste-responsive and non-taste-responsive NTS cells reflect the lick pattern to some extent, with different cells active at all stages of the lick cycle. Thus, as the lick cycle progresses, the firing patterns of NTS cells form a spatial wave of activity that is overlaid by taste responsivity. Although some taste-related firing tied to the lick cycle may reflect variation in the distribution of the taste stimulus in the mouth as the animal moves its tongue, lick-related firing patterns in NTS are evident even when no stimulus is present.
Possible Origins of Lick-Related Activity
By far, most of the cells that we have recorded in the NTS show some degree of lick-related activity. Because there are no known motor inputs to the rostral NTS, the origin of such activity may be somatosensory. Matsuo et al. (1995) recorded from the chorda tympani (CT) nerve, a major input to the NTS innervating taste buds on the rostral two-thirds of the tongue, in awake freely licking rats. They found that the majority of nerve fibers responded to mechanical stimuli and thus showed rhythmic discharges synchronized to the licks. They also found some taste-mechanosensitive fibers as well as some taste-sensitive fibers that did not show any lick-related synchrony. In contrast, in the geniculate ganglion of anesthetized rats, Yokota and Bradley (2017) did not find any taste-sensitive neurons that also responded to mechanical stimuli. However, they did describe a class of neurons that responded exclusively to dynamic mechanical stimuli, but not to static touch (von Frey hairs). Given that the CT in awake rats contains taste/mechanosensitive fibers but no such response patterns were found in the geniculate ganglion, taste-responsive cells in NTS with lick relatedness may be the result of convergent taste and mechanosensitive input from the geniculate ganglion (Zaidi et al. 2008) or from trigeminal sources (Boucher et al. 2003).
Another possible source of lick-related firing in NTS may be top-down influences, such as those originating in the gustatory cortex (GC) (Travers et al. 1997). The GC is known to project to both the NTS and to the parvocellular reticular formation (Lundy and Norgren 2004), a site proposed to be part of the central pattern generator for licking in the brain stem (Travers et al. 1997). It is well known that ingestion of certain taste stimuli can modify the regularity of the lick pattern and that these modifications may be reflected in both NTS and cortical activity (Li et al. 2016). However, data from decerebrate rats show that taste-appropriate behaviors can be generated with only the brain stem available (Grill and Norgren 1978); this suggests that cortical involvement may be modulatory rather than essential for taste reactivity.
Whatever the source, it is possible that the lick-related activity in the NTS might drive or at least influence lick-related behaviors through projections from the rostral NTS to the subjacent intermediate subdivision of the medullary reticular formation (IRt) (Nasse et al. 2008). These projections are thought to modulate the transition from ingestive to rejection behaviors through projections to the hypoglossal nucleus (Nasse et al. 2008). Consistent with the idea that lick-related cells in the NTS activate licking are data showing that electrical microstimulation of the rostral NTS produces licking and gaping, depending on the mediolateral location of the stimulation (Kinzeler and Travers 2008). However, given the fact that descending projections from NTS to IRt are not reciprocated (Nasse et al. 2008), this would be entirely a feedforward circuit. Nevertheless, changes in the lick pattern related to taste quality and or hedonics would necessarily alter the firing patterns of both taste and nontaste cells in NTS, enabling the lick-related activity to play a role in taste quality identification.
A difference in firing rate when the animal was not licking (spontaneous firing rate) vs. when it was licking was common among NTS cells. These firing rates include activity generated by lick-related firing, so an increase in firing rate from spontaneous rates might be explained by this lick-related activity. However, the equally common decreases in firing rate cannot be accounted for in this fashion. Across the population, changes up or down in overall firing rate when an animal decides to lick signal a global shift in the spatial representation of neuronal activity when the animal is licking and tasting. One can conceptualize this shift as a change from an “idling” to a “sensory acquisition” state, presumably triggered by upstream structures that make the decision to initiate licking and coordinate the associated movements. Although neuronal activity across the entire population of NTS cells evidences a global response to sensory acquisition, at least some NTS cells may show firing patterns that emphasize different dominant characteristics such as licking or taste responsiveness. By reflecting the differences in behavior that are engendered by different taste stimuli, cellular activity that tracks the lick pattern may reinforce taste stimulus-related activity in signaling taste quality and, perhaps particularly, hedonic valence. Furthermore, the suppression of firing in anti-lick cells during lick bouts may enhance the signal-to-noise ratio of taste responses in the population (see Roussin et al. 2012).
Taste Information is Pervasive Across the Population
Figures 10 and 12 indicate that cells characterized by conventional means as taste and nontaste both carry a substantial amount of information about taste quality. Whereas spike trains evoked by taste cells naturally convey more information than nontaste cells, nontaste cells also convey substantial information. Recognizing that nontaste cells constitute the majority of neurons, our data indicate that on a population level, this subgroup conveys more information about taste quality than the taste cells.
As the length of time after the first lick increases to 2 s, the amount of information conveyed by these two groups grows in parallel. Interestingly, the lick pattern alone conveys more information about taste quality as the response unfolds over time, although less information is conveyed by spike trains in neurons in the earliest response intervals where taste quality identification occurs (Graham et al. 2014; Halpern and Tapper 1971; Perez et al. 2013; Weiss and Di Lorenzo 2012). At later response intervals, where hedonic responses occur (Travers and Norgren 1986), the lick pattern is especially informative and may be driven from top-down inputs (Li et al. 2016).
Sensorimotor Integration of Responses in the Rostral NTS
In studies aimed at deciphering strategies for the neural representation of taste stimuli in the brain, the emphasis has been, not surprisingly, on neurons defined as taste responsive by conventional means. This strategy was based on the assumption that taste-responsive cells, defined conventionally by changes in firing rate evoked by taste stimuli, were the cells capable of conveying information about taste. Although the presence of other non-taste-responsive cells was nearly always noted (see above), there was little or no consideration of the function of these cells in the NTS. This was most likely due to the fact that most studies were based on recordings from anesthetized subjects, so there was no opportunity to observe any behavior-based neural activity. Data presented in this article strongly suggest that many, if not all, of these cells with unspecified function in these previous studies might be tracking ingestive behavior, similar to the lick-related cells in the present study. Our results show not only that there are many cells that track behavior but that these cells also convey information about taste in the following sense: taste-responsive cells convey taste quality-related information upstream that then alters behavior. Activity in the nontaste cells reflects this behavior and thus can convey information about taste quality, reinforcing the information about taste quality conveyed by taste-responsive cells.
Conclusions
In NTS, cells conventionally classified as taste responsive constitute only a minority of the cells that convey information about what is ingested. The majority of cells both track consummatory behavior and contribute information about the identity of what is being consumed, provided that the temporal pattern of their responses is taken into account. These data suggest that nontaste cells may reinforce the information derived from taste-responsive cells in communicating information about the taste of a food. Conversely, taste-responsive cells may communicate information upstream that may drive behavioral patterns that hint at the taste quality being perceived. This information may, in turn, alter behavioral patterns that are then reflected in the activity of the nontaste cells. Information contributed by olfactory (Escanilla et al. 2015), tactile (Boucher et al. 2003), and thermal (Lemon 2017) sensations likely also contributes to the taste signal at this early stage of processing. Thus, when a taste stimulus is in the mouth, sensory input from a variety of systems as well as taste-driven motor-related input collaborate to complete the representation of a food object in the brain. The seamless melding of sensory and motor-related input among NTS cell groups underscores the idea that there is more to the neural code for taste in the brain stem than can be gleaned solely from “taste-responsive” cells.
GRANTS
This work was funded by National Institute of Deafness and Other Communications Disorders Grant R01 DC006914 (to P. M. Di Lorenzo).
DISCLOSURES
No conflicts of interest, financial or otherwise, are declared by the authors.
AUTHOR CONTRIBUTIONS
P.M.D. conceived and designed research; J.D.S. performed experiments; A.J.D. and P.M.D. analyzed data; A.J.D., J.D.S., J.D.V., and P.M.D. interpreted results of experiments; A.J.D. and P.M.D. prepared figures; A.J.D. and P.M.D. drafted manuscript; J.D.V. and P.M.D. edited and revised manuscript; A.J.D., J.D.S., J.D.V., and P.M.D. approved final version of manuscript.
REFERENCES
- Boucher Y, Simons CT, Faurion A, Azérad J, Carstens E. Trigeminal modulation of gustatory neurons in the nucleus of the solitary tract. Brain Res 973: 265–274, 2003. doi: 10.1016/S0006-8993(03)02526-5. [DOI] [PubMed] [Google Scholar]
- Di Lorenzo PM, Victor JD. Taste response variability and temporal coding in the nucleus of the solitary tract of the rat. J Neurophysiol 90: 1418–1431, 2003. doi: 10.1152/jn.00177.2003. [DOI] [PubMed] [Google Scholar]
- Efron B, Tibshirani RJ. An Introduction to the Bootstrap (Monographs on Statistics and Applied Probability). Boca Raton, FL: Chapman & Hall/CRC, 1998, vol. 57. [Google Scholar]
- Escanilla OD, Victor JD, Di Lorenzo PM. Odor-taste convergence in the nucleus of the solitary tract of the awake freely licking rat. J Neurosci 35: 6284–6297, 2015. doi: 10.1523/JNEUROSCI.3526-14.2015. [DOI] [PMC free article] [PubMed] [Google Scholar]
- Gordon G, Dorfman N, Ahissar E. Reinforcement active learning in the vibrissae system: optimal object localization. J Physiol Paris 107: 107–115, 2013. doi: 10.1016/j.jphysparis.2012.06.004. [DOI] [PubMed] [Google Scholar]
- Graham DM, Sun C, Hill DL. Temporal signatures of taste quality driven by active sensing. J Neurosci 34: 7398–7411, 2014. doi: 10.1523/JNEUROSCI.0213-14.2014. [DOI] [PMC free article] [PubMed] [Google Scholar]
- Grill HJ, Norgren R. The taste reactivity test. II. Mimetic responses to gustatory stimuli in chronic thalamic and chronic decerebrate rats. Brain Res 143: 281–297, 1978. doi: 10.1016/0006-8993(78)90569-3. [DOI] [PubMed] [Google Scholar]
- Gutierrez R, Carmena JM, Nicolelis MAL, Simon SA. Orbitofrontal ensemble activity monitors licking and distinguishes among natural rewards. J Neurophysiol 95: 119–133, 2006. doi: 10.1152/jn.00467.2005. [DOI] [PubMed] [Google Scholar]
- Gutierrez R, Simon SA, Nicolelis MA. Licking-induced synchrony in the taste-reward circuit improves cue discrimination during learning. J Neurosci 30: 287–303, 2010. doi: 10.1523/JNEUROSCI.0855-09.2010. [DOI] [PMC free article] [PubMed] [Google Scholar]
- Halpern BP, Tapper DN. Taste stimuli: quality coding time. Science 171: 1256–1258, 1971. doi: 10.1126/science.171.3977.1256. [DOI] [PubMed] [Google Scholar]
- Halsell CB, Travers SP, Travers JB. Ascending and descending projections from the rostral nucleus of the solitary tract originate from separate neuronal populations. Neuroscience 72: 185–197, 1996. doi: 10.1016/0306-4522(95)00528-5. [DOI] [PubMed] [Google Scholar]
- Herbert H, Moga MM, Saper CB. Connections of the parabrachial nucleus with the nucleus of the solitary tract and the medullary reticular formation in the rat. J Comp Neurol 293: 540–580, 1990. doi: 10.1002/cne.902930404. [DOI] [PubMed] [Google Scholar]
- Hirata S, Nakamura T, Ifuku H, Ogawa H. Gustatory coding in the precentral extension of area 3 in Japanese macaque monkeys; comparison with area G. Exp Brain Res 165: 435–446, 2005. doi: 10.1007/s00221-005-2321-y. [DOI] [PubMed] [Google Scholar]
- Karimnamazi H, Travers JB. Differential projections from gustatory responsive regions of the parabrachial nucleus to the medulla and forebrain. Brain Res 813: 283–302, 1998. doi: 10.1016/S0006-8993(98)00951-2. [DOI] [PubMed] [Google Scholar]
- Katz DB, Simon SA, Nicolelis MA. Dynamic and multimodal responses of gustatory cortical neurons in awake rats. J Neurosci 21: 4478–4489, 2001. doi: 10.1523/JNEUROSCI.21-12-04478.2001. [DOI] [PMC free article] [PubMed] [Google Scholar]
- Kinzeler NR, Travers SP. Licking and gaping elicited by microstimulation of the nucleus of the solitary tract. Am J Physiol Regul Integr Comp Physiol 295: R436–R448, 2008. doi: 10.1152/ajpregu.00189.2008. [DOI] [PMC free article] [PubMed] [Google Scholar]
- Lemon CH. Modulation of taste processing by temperature. Am J Physiol Regul Integr Comp Physiol 313: R305–R321, 2017. doi: 10.1152/ajpregu.00089.2017. [DOI] [PMC free article] [PubMed] [Google Scholar]
- Li JX, Maier JX, Reid EE, Katz DB. Sensory cortical activity is related to the selection of a rhythmic motor action pattern. J Neurosci 36: 5596–5607, 2016. doi: 10.1523/JNEUROSCI.3949-15.2016. [DOI] [PMC free article] [PubMed] [Google Scholar]
- Lundy RF, Norgren R. Gustatory system. In: The Rat Nervous System (3rd ed.), edited by Paxinos G, Mai J. San Diego, CA: Academic, 2004, p. 891–921. doi: 10.1016/B978-012547638-6/50029-8. [DOI] [Google Scholar]
- Matsuo R, Inoue T, Masuda Y, Nakamura O, Yamauchi Y, Morimoto T. Neural activity of chorda tympani mechanosensitive fibers during licking behavior in rats. Brain Res 689: 289–298, 1995. doi: 10.1016/0006-8993(95)00582-B. [DOI] [PubMed] [Google Scholar]
- Mitchinson B, Prescott TJ. Whisker movements reveal spatial attention: a unified computational model of active sensing control in the rat. PLoS Comput Biol 9: e1003236, 2013. doi: 10.1371/journal.pcbi.1003236. [DOI] [PMC free article] [PubMed] [Google Scholar]
- Nasse J, Terman D, Venugopal S, Hermann G, Rogers R, Travers JB. Local circuit input to the medullary reticular formation from the rostral nucleus of the solitary tract. Am J Physiol Regul Integr Comp Physiol 295: R1391–R1408, 2008. doi: 10.1152/ajpregu.90457.2008. [DOI] [PMC free article] [PubMed] [Google Scholar]
- Norgren R. Projections from the nucleus of the solitary tract in the rat. Neuroscience 3: 207–218, 1978. doi: 10.1016/0306-4522(78)90102-1. [DOI] [PubMed] [Google Scholar]
- Nunez-Parra A, Li A, Restrepo D. Coding odor identity and odor value in awake rodents. Prog Brain Res 208: 205–222, 2014. doi: 10.1016/B978-0-444-63350-7.00008-5. [DOI] [PMC free article] [PubMed] [Google Scholar]
- Perez IO, Villavicencio M, Simon SA, Gutierrez R. Speed and accuracy of taste identification and palatability: impact of learning, reward expectancy, and consummatory licking. Am J Physiol Regul Integr Comp Physiol 305: R252–R270, 2013. doi: 10.1152/ajpregu.00492.2012. [DOI] [PubMed] [Google Scholar]
- Roussin AT, D’Agostino AE, Fooden AM, Victor JD, Di Lorenzo PM. Taste coding in the nucleus of the solitary tract of the awake, freely licking rat. J Neurosci 32: 10494–10506, 2012. doi: 10.1523/JNEUROSCI.1856-12.2012. [DOI] [PMC free article] [PubMed] [Google Scholar]
- Rucci M, Victor JD. The unsteady eye: an information-processing stage, not a bug. Trends Neurosci 38: 195–206, 2015. doi: 10.1016/j.tins.2015.01.005. [DOI] [PMC free article] [PubMed] [Google Scholar]
- Sammons JD, Weiss MS, Escanilla OD, Fooden AF, Victor JD, Di Lorenzo PM. Spontaneous changes in taste sensitivity of single units recorded over consecutive days in the brainstem of the awake rat. PLoS One 11: e0160143, 2016. doi: 10.1371/journal.pone.0160143. [DOI] [PMC free article] [PubMed] [Google Scholar]
- Schroeder CE, Wilson DA, Radman T, Scharfman H, Lakatos P. Dynamics of active sensing and perceptual selection. Curr Opin Neurobiol 20: 172–176, 2010. doi: 10.1016/j.conb.2010.02.010. [DOI] [PMC free article] [PubMed] [Google Scholar]
- Schwartzbaum JS. Electrophysiology of taste-mediated functions in parabrachial nuclei of behaving rabbit. Brain Res Bull 11: 61–89, 1983. doi: 10.1016/0361-9230(83)90056-4. [DOI] [PubMed] [Google Scholar]
- Sherman D, Oram T, Deutsch D, Gordon G, Ahissar E, Harel D. Tactile modulation of whisking via the brainstem loop: statechart modeling and experimental validation. PLoS One 8: e79831, 2013. doi: 10.1371/journal.pone.0079831. [DOI] [PMC free article] [PubMed] [Google Scholar]
- Stapleton JR, Lavine ML, Wolpert RL, Nicolelis MAL, Simon SA. Rapid taste responses in the gustatory cortex during licking. J Neurosci 26: 4126–4138, 2006. doi: 10.1523/JNEUROSCI.0092-06.2006. [DOI] [PMC free article] [PubMed] [Google Scholar]
- Streefland C, Jansen K. Intramedullary projections of the rostral nucleus of the solitary tract in the rat: gustatory influences on autonomic output. Chem Senses 24: 655–664, 1999. doi: 10.1093/chemse/24.6.655. [DOI] [PubMed] [Google Scholar]
- Travers JB, Dinardo LA, Karimnamazi H. Motor and premotor mechanisms of licking. Neurosci Biobehav Rev 21: 631–647, 1997. doi: 10.1016/S0149-7634(96)00045-0. [DOI] [PubMed] [Google Scholar]
- Travers JB, Norgren R. Electromyographic analysis of the ingestion and rejection of sapid stimuli in the rat. Behav Neurosci 100: 544–555, 1986. doi: 10.1037/0735-7044.100.4.544. [DOI] [PubMed] [Google Scholar]
- Victor JD, Purpura KP. Nature and precision of temporal coding in visual cortex: a metric-space analysis. J Neurophysiol 76: 1310–1326, 1996. doi: 10.1152/jn.1996.76.2.1310. [DOI] [PubMed] [Google Scholar]
- Victor JD, Purpura KP. Sensory coding in cortical neurons. Recent results and speculations. Ann N Y Acad Sci 835: 330–352, 1997. doi: 10.1111/j.1749-6632.1997.tb48640.x. [DOI] [PubMed] [Google Scholar]
- Wachowiak M. All in a sniff: olfaction as a model for active sensing. Neuron 71: 962–973, 2011. doi: 10.1016/j.neuron.2011.08.030. [DOI] [PMC free article] [PubMed] [Google Scholar]
- Weiss MS, Di Lorenzo PM. Not so fast: taste stimulus coding time in the rat revisited. Front Integr Neurosci 6: 27, 2012. doi: 10.3389/fnint.2012.00027. [DOI] [PMC free article] [PubMed] [Google Scholar]
- Weiss MS, Victor JD, Di Lorenzo PM. Taste coding in the parabrachial nucleus of the pons in awake, freely licking rats and comparison with the nucleus of the solitary tract. J Neurophysiol 111: 1655–1670, 2014. doi: 10.1152/jn.00643.2013. [DOI] [PMC free article] [PubMed] [Google Scholar]
- Yokota Y, Bradley RM. Geniculate ganglion neurons are multimodal and variable in receptive field characteristics. Neuroscience 367: 147–158, 2017. doi: 10.1016/j.neuroscience.2017.10.032. [DOI] [PubMed] [Google Scholar]
- Zaidi FN, Todd K, Enquist L, Whitehead MC. Types of taste circuits synaptically linked to a few geniculate ganglion neurons. J Comp Neurol 511: 753–772, 2008. doi: 10.1002/cne.21869. [DOI] [PMC free article] [PubMed] [Google Scholar]


