The embryonic gut tube is a cylindrical structure from which the respiratory and gastrointestinal tracts arise1. Despite investigations into early emergence of the endoderm as an epithelial sheet2,3 and later morphogenesis of the definitive digestive and respiratory organs4–6, the intervening process of gut tube formation has been severely understudied, particularly over the past 45 years7,8. Here we investigate the molecular control of macroscopic forces underlying early morphogenesis of the gut tube in the chick embryo. The gut tube has been described as forming from two endodermal invaginations – the Anterior Intestinal Portal (AIP) towards the rostral end of the embryo and the Caudal Intestinal Portal (CIP) at the caudal end – that migrate toward one another, internalizing the endoderm until they meet at the yolk stalk (umbilicus in mammals)1,6. Migration of the AIP to form foregut has been descriptively characterized9,10, yet the hindgut likely forms by a distinct mechanism that has not been fully elucidated11. We find that the hindgut forms by collective cell movements through a stationary CIP, rather than via movement of the CIP itself. Moreover, combining in vivo imaging, biophysics, and mathematical modeling with molecular and embryological approaches, we identify a contractile force gradient that drives cell movements in the hindgut-forming endoderm, permitting tissue-scale posterior extension of the forming hindgut tube. The force gradient, in turn, is established in response to a morphogenic gradient of FGF signaling. As a result, we propose that an important positive feedback arises, whereby contracting cells draw passive cells from low to high FGF levels, recruiting them to contract and pull more cells into the elongating hindgut. In addition to providing new insight into the early gut development, these findings illustrate how large-scale tissue level forces can be traced to developmental signals during vertebrate morphogenesis.
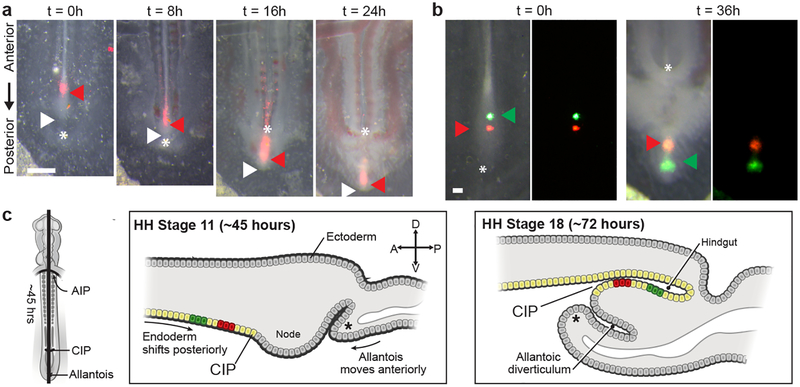
To study the process of hindgut formation, we first labeled small populations of endoderm in the developing chick embryo at Hamburger Hamilton stage (HH) 13 (50 hours), when the posterior endoderm is flat, and observed their movement through the completion of hindgut tube formation at HH18 (72 hours)12. Labeled endodermal cells along the midline were displaced posteriorly through the CIP and internalized in the forming hindgut, out-pacing posterior elongation of the embryo (red arrowhead, Fig. 1a); no anterior movement of the CIP was observed. Because the allantois, visible posteriorly as a crescent shaped invagination (asterisk, Fig. 1a,c and Extended Data Fig. 1c), has often been misidentified as the CIP11,13, we tested whether anterior migration of the allantois could explain internalization of the hindgut endoderm. However, the forming hindgut elongated significantly faster than anterior migration of the allantois (Extended Data Fig. 1a), suggesting that hindgut formation cannot be explained by anterior migration of the CIP or allantois. Because hindgut formation coincides with a posterior shift in the endoderm, we next focused on how these two processes may be related. Cell labeling experiments revealed that posterior movement of the endoderm outpaced neighboring mesodermal derivatives (Extended Data Fig. 1b), suggesting that the endoderm is not simply displaced passively with mesoderm as the embryo elongates, but rather actively moves posteriorly. Focusing next on movements within the endoderm, we found that the relative position of labels injected into the flat endoderm at HH11 became inverted along the antero-posterior axis once they had been internalized to form hindgut by HH18 (Fig. 1b). Based on these findings, we suggest a new model for hindgut formation: endoderm cells rapidly pass through the relatively stationary CIP, and because these movements outpace axis elongation, they are accommodated in the growing tail bud by dorso-ventral folding (Fig. 1c). This model contradicts the prior view that anterior migration of the CIP zips the endoderm into a tube as it moves, yet is entirely consistent with fate mapping studies in the chick and mouse14–17.
Fig. 1. The avian hindgut forms by antero-posterior inversion of endoderm passing through the CIP.
a, Ventral view of embryo with DiI labeled endoderm (red arrow) at HH13 (t = 0 hours); white arrow = posterior tip of embryo; * = allantois; n = 4/4. Scale 500 μm. b, Di O (green arrow) and Di I (red arrow) injected into midline endoderm (n = 4/4) upon dye injection at HH14 (t = 0 hours, left) and after incubation to HH18 (t = 36 hours, right); * allantoic lip. Scale 100 μm. c, Schematic of hindgut formation: endoderm folds from dorsal to ventral, inverting cell positions (red and green labeled cells) along the antero-posterior axis as cells move through a stationary CIP. The ventral lip of the allantois (*) migrates posterior to anterior. A, P, D, and V denote anterior, posterior, dorsal, and ventral, respectively. AIP = anterior intestinal portal; CIP = caudal intestinal portal.
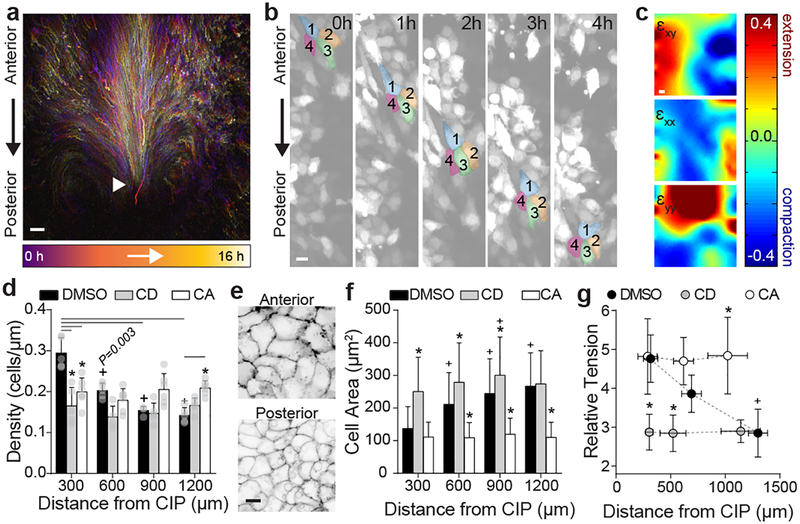
To directly observe cell movements during hindgut formation, we performed endoderm-specific electroporation of a ubiquitous GFP reporter in the ex ovo chick embryo (Extended Data Fig. 1c–e), followed by live in vivo imaging of cell movements between HH14 and HH18. We observed collective anterior-to-posterior cell movements along the embryonic midline (Fig. 2a, and Supplementary Video 1), with cells passing through the CIP and out of view. Live imaging following dual electroporation of endoderm and mesoderm confirmed that cell movements were intrinsic to endoderm (Supplemental Video 2). We observed minimal cell proliferation (Extended Data Fig. 1f) or neighbor exchange (Fig. 2b and Supplemental Video 3) in the posterior endoderm, indicating that proliferation-based growth and intercalary/convergent-extension movements are unlikely to drive the observed movements.
Fig. 2. Contractile gradient drives polarized collective cell movements to form hindgut.
a, Representative cell tracks from time lapse experiment (n = 8/8) from HH14 (purple, 0 hours) to HH16 (white, 16 hours); white arrowhead = CIP. Scale 100 μm. b, Time lapse (40x) snapshots of 4 neighboring endoderm cells (collective movements observed n = 3/3). Scale = 10 μm. c, Representative heat maps of shear strain (εxy, left), medio-lateral strain (εxx, center), and antero-posterior strain (εyy, right) for 8 hour time lapse (HH14 to 16). Color bar (below) indicates strain magnitude. See Schematic in Extended Data Fig. 3a for details. d, Linear cell density at HH15 following treatment with 0.1% DMSO, 5 μM Cytochalasin D (CD), and 30 nM Calyculin A (CA, >900 cells from n = 5, n = 5, and n = 6 embryos, respectively); mean ±s.d., 2-way ANOVA with Tukey’s correction; overbar indicates */+P ≤ 0.001 vs DMSO/posterior-most bin per respective treatments. e, Ventral/apical view of anterior (top) and posterior (bottom) endoderm at HH15, stained with lipophilic dye PKH26 to visualize cell boundaries (n = 3/3, Extended Data Fig. 3c). Scale 10 μm. f, Cell area at HH 15 following treatment with 0.1% DMSO, 5 μM Cytochalasin D (CD), and 30 nM Calyculin A (CA, >800 cells each from n = 7, n = 7, and n = 6 embryos, respectively); mean ±s.d., 2-way ANOVA with Tukey’s correction; */+P ≤ 0.001 vs DMSO/posterior-most bin per respective treatments. g, Relative tension at HH15 following treatment with 0.1% DMSO (n = 27 embryos, 8 – 10 per group), 5 μM Cytochalasin D (CD, n = 30 embryos, 10 per group), or 30 nM Calyculin A (CA, n = 26 embryos, 8 – 9 per group); mean ±s.d., 1-way ANOVA with Tukey’s correction; */+P ≤ 0.001 vs. DMSO/posterior-most bin per respective treatments.
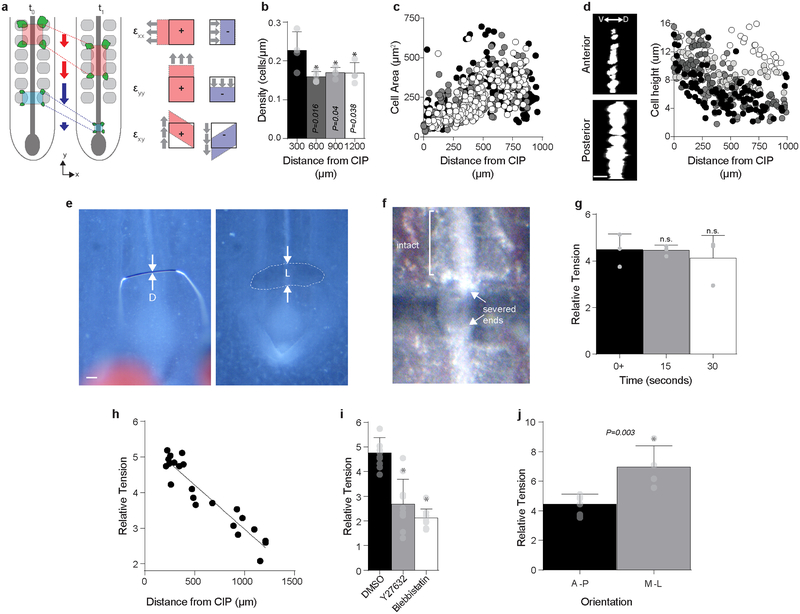
Because they are required for hindgut formation (Extended Data Fig. 1g, h), we next focused on understanding mechanistically how these collective movements occur in the endoderm, which forms a polarized epithelium prior to tube morphogenesis (Extended Data Fig. 2). In general, it is not clear how collective cell movements are coordinated in embryonic epithelia in the absence of a “leader” population18. Therefore, we sought to understand biophysically how cells move collectively during hindgut formation. To do so, we tracked cell movements in the posterior endoderm and calculated mechanical strain to quantify endoderm stretching, compaction, and shearing during hindgut formation (Fig. 2c and Extended Data Fig. 3a)19. Strain (ε) is a unitless metric for changes in shape of a material, calculated from the spatial gradient in cell displacements (see Methods for a detailed description)20. Along the antero-posterior axis (the direction of collective cell movement), we observed neighboring regions of posterior compaction (εyy < 0) and anterior extension (εyy > 0, Fig. 2c and Extended Data Fig. 4a). Compaction strains posteriorly coincided with increased cell density (Extended Data Fig. 3b) and a decreased cell area (Fig. 2e and Extended Data Fig. 3c). These opposing gradients of cell density and shape were lost upon either pharmacologic disruption or enhancement of acto-myosin contractility (Fig. 2d and f). Cell height varied inversely with area (Extended Data Fig. 3d), suggesting that cells undergo volume-persevering cell shape changes as they move from a region of extensional strain in the anterior endoderm to compaction strain in the posterior endoderm. These data together suggest either that anterior endoderm expands to push cells posteriorly, or that posterior cells contract to pull anterior cells into the forming hindgut. To distinguish between these two possibilities, we measured relative forces within the endoderm, using a gastromaster device to perform cuts of reproducible geometry, and measuring the degree to which cuts spring open as a measure of tension (see Methods and Extended Data Fig. 3e–g)19,21. In the posterior endoderm, where cells are compacted together during collective movement, cuts rapidly opened to 4.76± 0.64 fold their original size (n = 10), indicating that the compacting tissue is under tension. Therefore, the posterior endoderm is not pushed, but instead contracts to pull anterior cells into the forming hindgut. The coincidence of tensile forces and compaction strains in the posterior endoderm also suggests that the propulsive force for cell movements is intrinsic to these cells, and not extrinsically applied, for example by an unseen migratory “leader” population22. Measurement of tension along the antero-posterior axis revealed a tensional gradient, with endoderm tension decreasing from posterior to anterior (Extended Data Fig. 3h). Disruption and activation of acto-myosin contractility each resulted in a loss of the tensional gradient, due to a reduction in posterior tension and increase in anterior tension, respectively (Fig. 2g and Extended Data Fig. 3i). This suggests that the spatial gradient of endoderm tension is due to acto-myosin contraction.
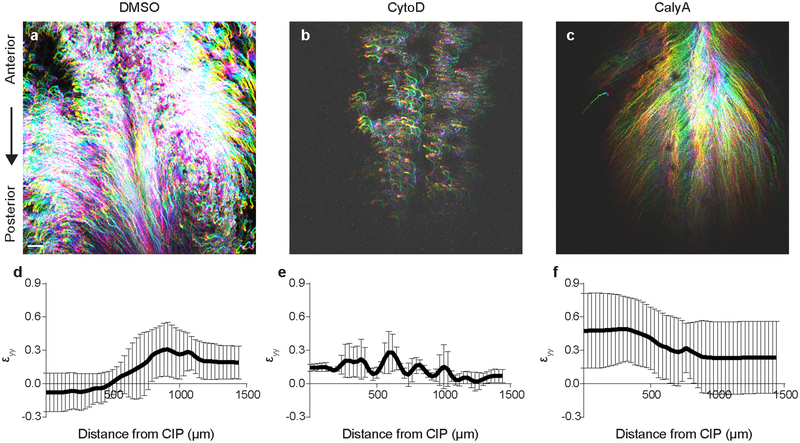
Cytochalasin D treatment to disrupt cell contractility revealed a reduction of cell movements and associated antero-posterior strains (Supplemental Video 4 and Extended Data 5b, e). Strikingly, calyculin A treatment to enhance contractility throughout the endoderm reversed the direction of cell movements (Supplemental Video 4 and Extended Data Fig. 5c) and induced large extensional strains throughout the endoderm (Extended Data Fig. 5f). These data suggest that spatial differences in cell contractility generate the tensional gradient that drives collective movements to form the hindgut tube.
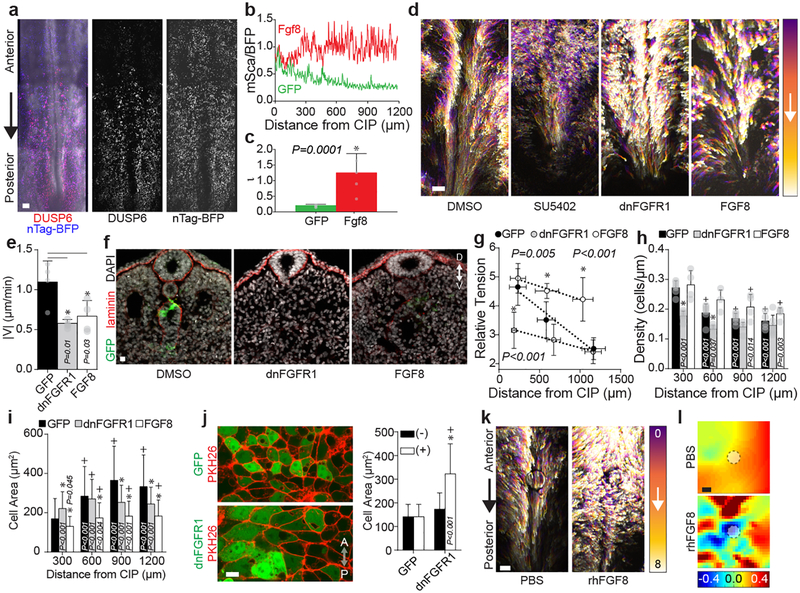
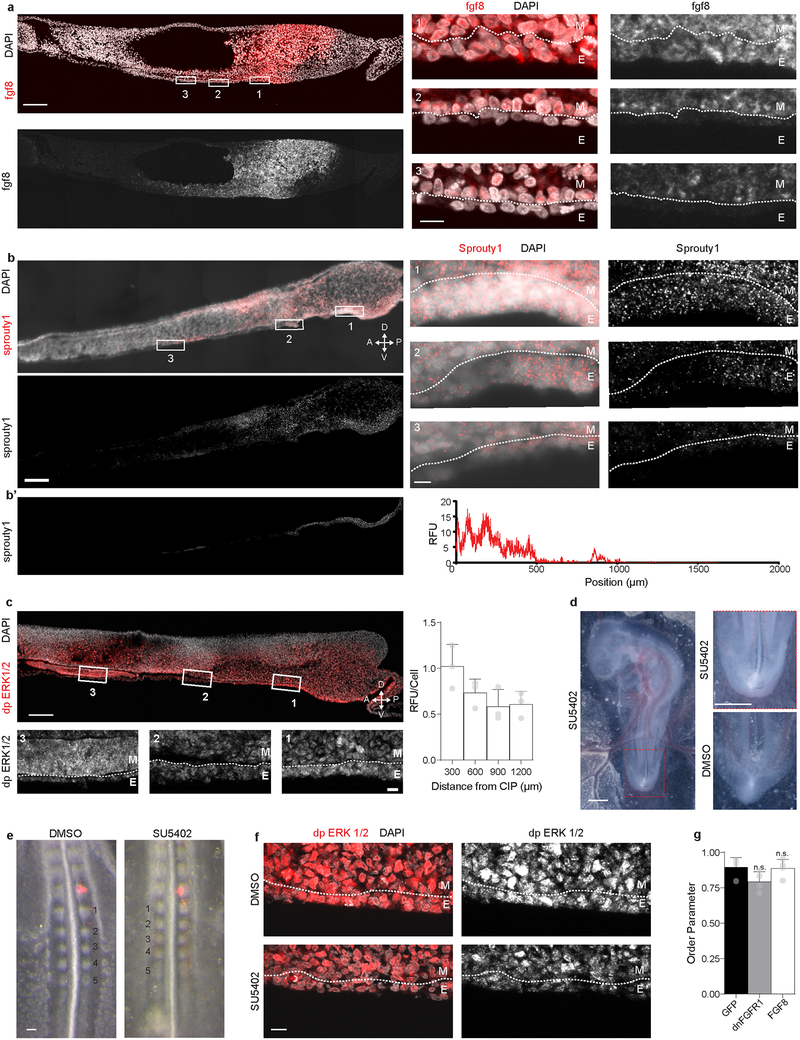
These studies provide a macroscopic picture of the physical basis of collective cell movements in the posterior endoderm, and the forces responsible. We next sought to identify the molecular cues by which these forces are prescribed. FGF signaling modulates acto-myosin activity in several developmental contexts23–27, and Fgf8 is expressed in a posterior-to-anterior gradient (Extended Data Fig. 6a) central to posterior mesodermal25,28 and ectodermal29 morphogenesis. However, a role for FGF signaling in posterior endoderm morphogenesis has not been previously explored. We therefore tested whether this pathway plays a role in coordinating the collective cell movements that lead to hindgut tube formation. Using an FGF reporter that consists of the mouse DUSP6 promoter driving expression of mScarlet, we observed a gradient in FGF activity specifically within the endoderm (Fig. 3a-c and Extended Data Fig. 9)30. FGF target gene expression and downstream signaling were also enriched in the posterior endoderm (Extended Data Fig. 6b and c, respectively).
Fig. 3. A posterior FGF8 gradient modulates endoderm tensional gradient to control collective cell movements.
a, Coelectroporation of DUSP6-mScarlet reporter and control CAG nTagBFP (n = 7). Scale 100 μm. b-c, Normalized DUSP6 activity (b) and gradient shape parameter ι (c, GFP: green, n = 7, FGF8: red, n = 5); mean ±s.d., unpaired two-tailed t-test. d, Representative cell tracks (HH14 to HH16) of GFP electroporated embryos in 0.1% DMSO (n = 0/3 affected) or 50 μM SU5402 (n = 3/3 affected), or electroporated with dnFGFR1-IRES-GFP or FGF8-IRES-GFP. Scale 100 μm. e, Average cell velocity (n = 4 embryos each). mean ±s.d., 1-way ANOVA, Tukey’s correction. f, Transverse sections through posterior HH18 embryos; For GFP n= 5/5 formed hindgut, vs. n= 3/12 for dnFGFR1-IRES-GFPand n= 8/21 FGF8-IRES-GFP; D/V = dorsal/ventral. Scale = 10 μm. g, Relative tension at HH15, n = 10 embryos each; mean ±s.d., 1-way ANOVA, Tukey’s correction; *P vs. GFP. h- i, Cell density (h, ≥1,000 cells each from n= 6 GFP and dnFGFR1, and n = 4 FGF8) and area (i, ≥1,000 cells each from n = 6 GFP, n = 7 dnFGFR1, and n = 8 FGF8) at HH15; mean ±s.d., 2-way ANOVA, Tukey’s correction. */+ vs GFP/posterior-most bin per treatment. j, Membrane stain PKH26 with mosaic expression of GFP (top-left) and dnFGFR1-IRES-GFP (bottom-left) at HH15; cell area quantification (right) in GFP+ and (-) cells with GFP (197 cells, n = 3) and dnFGFR1 IRES GFP (209 cells, n = 4) electroporation; mean ±s.d., 2-way ANOVA, Tukey’s correction, */+ vs. GFP(+)/dnFGFR1-IRES-GFP(-); A/P = anterior/posterior. k, Cell tracks (HH14 to HH16) with anteriorly grafted PBS (left, n = 0/3 disrupted) or rhFGF8 soaked (right, n = 4/7 disrupted) beads. Scale 100 μm. l, εyy heat maps for PBS and rhFGF8 soaked beads (n = 1/5 and n = 4/6 ectopic compaction strains, respectively); bead marked by white circle. Scale 100 μm.
To test function of FGF signaling during hindgut morphogenesis, we first used SU5402 to broadly inhibit FGF activity pharmacologically. SU5402 disrupted endoderm cell movements and hindgut formation (Fig. 3d, Extended Data Fig. 6d, and Supplemental Video 5), suggesting a general role for FGF signaling. When a dominant negative form of the receptor FGFR1 (dnFGFR1 IRES GFP) was electroporated exclusively into the endoderm27, cell movements were similarly reduced (Fig. 3d and Supplemental Video 6), demonstrating that FGF signaling is required specifically within the endoderm for hindgut morphogenesis. We next tested the effects of exogenous activation of the pathway by misexpressing Fgf8 (Fgf8-IRES GFP) throughout the posterior endoderm. Interestingly, Fgf8 misexpression phenocopied dnFGFR1, significantly reducing cell movements (Fig. 3d and Supplemental Video 6). Despite a reduction in average cell velocity (Fig. 3e), and loss of posterior compaction strains (Extended Data Fig. 4), the degree of coordination among neighboring cell movements did not depend on FGF (Extended Data Fig. 6g). This suggests that reduced cell movements likely result from a change in tissue-level forces, rather than loss of the mechanical coordination among neighboring cells. Disruption of cell movements by dnFGFR1 and Fgf8 misexpression ultimately resulted in failure to form the hindgut (Fig. 3f).
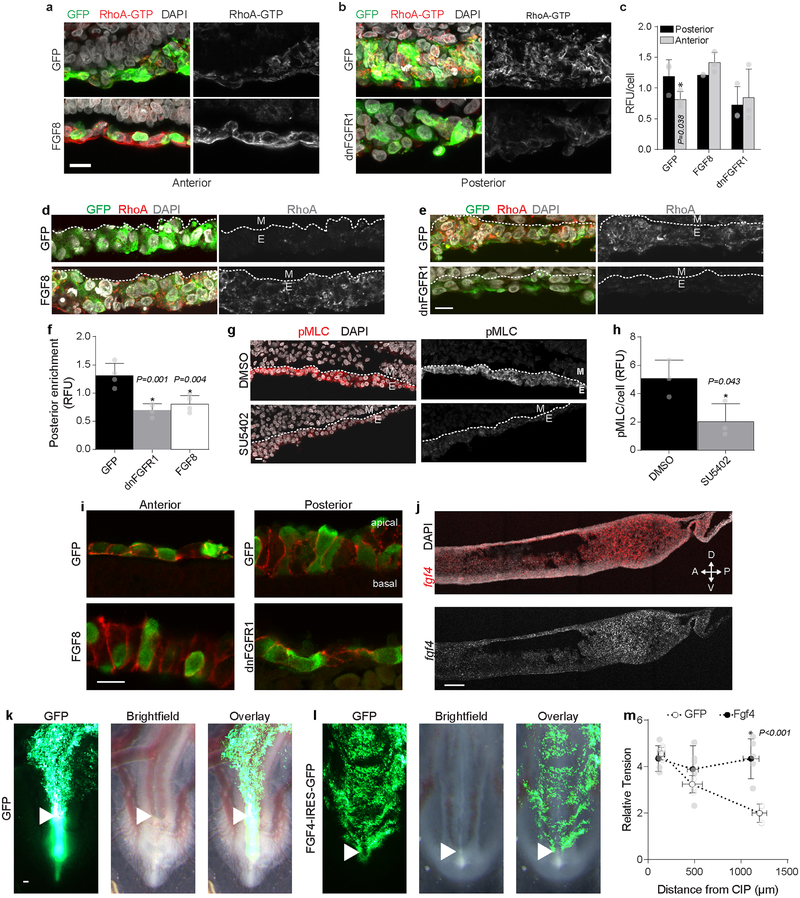
To understand why activation and inhibition of FGF signaling similarly disrupt collective cell movements and hindgut formation, we asked whether altering the FGF gradient translates to changes in the tensional gradient. Indeed, inhibition of FGF signaling by dnFGFR1 expression decreased tension in the posterior endoderm, while Fgf8 misexpression significantly increased tension in the anterior endoderm (Fig. 3g). Consequently, both dnFGFR1 and Fgf8 result in a loss of the tensional gradient driving cell movements. Further, recombinant human (rh) FGF8 protein increased endoderm tension independent of new protein synthesis (Extended Data Fig. 7b, c). Opposing gradients of cell density and shape were also disrupted with changes in FGF signaling (Fig. 3h, i), and posterior compaction strains were diminished (Extended Data Fig. 4b, c). FGF-dependent shape changes were cell autonomous (Fig. 3j), indicating that it is sensing of FGF signal, and not location within the tissue, that determines cell shape. Grafting of rhFGF8 protein-soaked beads onto anterior endoderm, where FGF activity is normally low, disrupted cell movements (Fig. 3k) and induced ectopic zones of compaction where normally only extensional strains are present (Fig. 3l). Immunofluorescence revealed an FGF-dependent posterior enrichment of active GTP-bound and total RhoA in the posterior endoderm (Extended Data Fig. 8a – f). These results suggest that hindgut formation relies on direct conversion of a spatial gradient in FGF signaling into a mechanical force gradient through modulation of RhoA-dependent actomyosin activity.
Finally, we developed a minimal mathematical model to quantify this mechanism in terms of physico-chemical parameters associated with FGF transport and force balance, and to potentially investigate behaviors of the system that are not experimentally accessible. The model formulation (Fig. 4a, b) and solution are described in detail in the Methods; here we summarize the main results. The endoderm was modeled as an active one dimensional viscoelastic solid, whose movement is resisted by an elastic basement membrane (Fig. 4a, inset). Forces in the endoderm were assumed to be the sum of passive viscoelastic and active contractile forces. We assumed contractility varies linearly with FGF concentration, and FGF ligand diffuses from a posterior source with uniform rate of clearance. This gives rise to a linear partial differential equation for cell displacement as a function of time and space (Fig. 4b), which depends on three dimensionless parameters: a length scale ratio (ι) that relates the diffusion/clearance of FGF ligand to the size of the domain, a ratio of basement membrane to cell stiffness (κ), and a ratio of contractile to elastic stress (Λ, Fig. 4b).
Fig. 4. A 1-D mechanochemical model quantifies an FGF8-mediated contractile gradient mechanism for collective cell movements.
Model schematic (a) and formulation (b, see Methods for details); initial condition and boundary conditions . c, Model simulation (ι = 0.03, κ = 1, Λ = 1), with FGF8 distribution (left) and snapshots of resulting endoderm movements (right), where color indicates position at the beginning of simulation (posterior = blue, anterior = red). d, Least-squares curve fit (R2 = 0.88) of model (green line) to experimentally measured strain following electroporation with GFP (green dots) and model prediction (red line) of experimentally measured strain following electroporation with FGF8 IRES GFP (red dots); shading indicates standard deviation. Experimental data (n = 3) repeated from Extended Data Fig. 4.
Model simulations replicate experimental observations of directional cell movements with posterior compaction and anterior extension (Fig. 4c and Supplemental Video 7). As cells moved from anterior to posterior, their exposure to FGF, and consequently their contractility, increased, resulting in a positive feedback: passive cells become contractile as they are displaced posteriorly, contributing to a further increase in pulling forces on more anterior cells (Fig. 4a). This would be analogous to a tug of war game if, as one team begins to win, they recruit players from the opposing team. As a result, posterior-directed cell movements extended well beyond the signaling range of FGF8 (Fig. 4c), even when parameter values were altered by multiple orders of magnitude. This may explain why collective cell movement of the endoderm outpaces axis elongation (Fig. 1a, Extended Data Fig. 1b, and Supplemental Video 2), despite the fact that both processes are coordinated by the same FGF gradient25,31. This feedback behavior, which was inferred from the mathematical model, could not be tested directly by experiment, but is consistent with experimental observations.
To apply the model to experimental results, we first measured the gradient shape parameter (ι=0.21±0.03, n=6) using the DUSP6 reporter, then fit the model to experimentally measured strain εyy to generate values for κ and Λ (green, Fig. 4d). We next tested whether the model can successfully predict the outcome of Fgf8 misexpression experiments by changing only the experimentally measured parameter ι (Fig. 3b, c). Indeed, the model prediction agreed qualitatively with experiment (red, Fig. 4d). Therefore, the minimal mathematical model supports the diffusible activator-driven contractile gradient mode of cell movements.
The present work reframes our view of how the gut tube forms, yet is congruent with fate mapping studies of chick gut formation, going back to the elegant carbon particle-based mapping experiments described in the doctoral thesis of Nicole Le Douarin7. FGF8 has been implicated in a broad range of events during development. The present work may shed light on its seemingly diverse functions, where in different contexts, FGF8 can behave as a chemorepellent32, a chemoattractant27, or a simply as a mediator of motility25. Cells of the presomitic mesoderm are free to move autonomously and a gradient in FGF-mediated acto-myosin activity translates to a gradient in cell motility25, while in the endoderm, where epithelial cells are constrained by cell junctions, we show that this same gradient instead creates collective movements. Therefore, one intriguing possibility is that at the cellular level, FGF signaling acts similarly in each system as a modulator of acto-myosin activity, and that the difference in the respective cell movements that result is a physical consequence of differences in cell-cell contacts and tissue constraints.
Extended Data
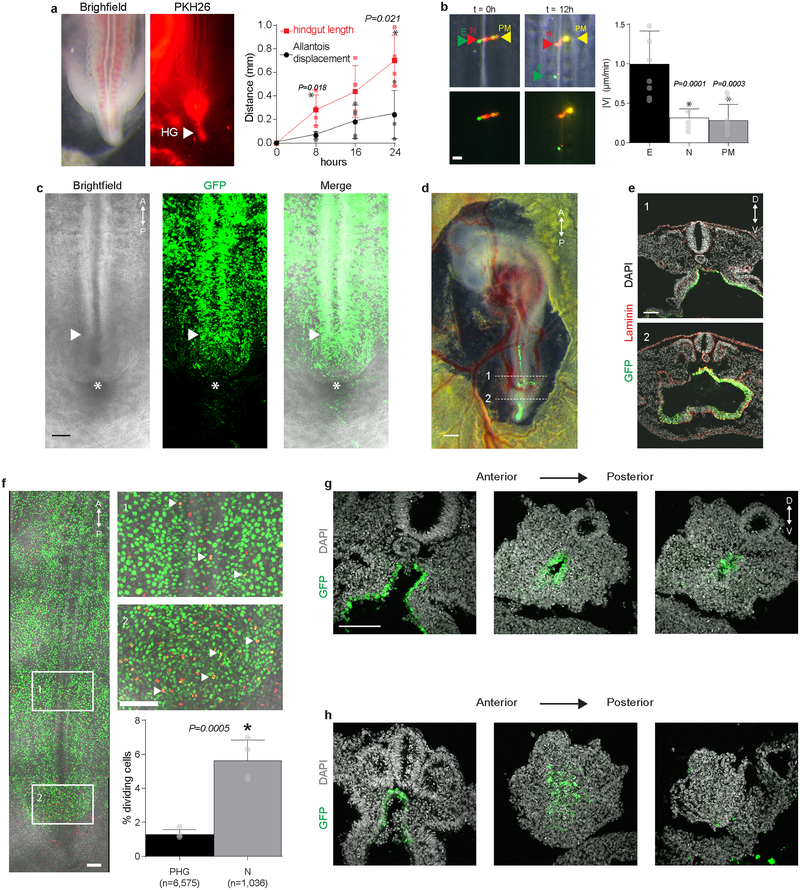
Extended Data Fig. 1. Electroporation-based transfection of the chick endoderm.
a, Dorsal view of HH18 embryo (left) stained with PHK26 to visualize hindgut (HG), and quantification (right) of gut length and allantois displacement from HH14 (t = 0 hours, n = 4 embryos); mean ±s.d., unpaired t-test. Scale 100 μm. b, Di O (green arrow), Di I (red arrow), and Di A (yellow arrow) injected into endoderm (E), notochord (N), and paraxial mesoderm (PM), respectively (n = 5/5) upon injection at HH14 (t = 0 hours) and after 12 hours (left), and quantification of antero-posterior velocity (right, n = 8 for E, PM and n = 7 for N); mean ±s.d., 1-way ANOVA, Sidak corrections, *P vs. E. Scale 100 μm. c, Ventral view of posterior HH14 embryo following endoderm-specific electroporation with GFP reporter plasmid at HH12 (n = 10/10); white arrowhead and asterisk denote CIP and ventral lip of the allantois, respectively. Scale 100 μm. d, HH18 embryo following endoderm-specific electroporation with GFP reporter plasmid (n = 8/8). GFP expression can be seen extending from presumptive midgut endoderm, which remains ventrally open (1), into the hindgut, which has been internalized (2) and extends to the tip of the tail bud. Scale 500 μm. e, Transverse sections through the posterior HH18 embryo of GFP-electroporated embryo as indicated in d (n=5/5). Scale 100 μm. f, To test whether cell proliferation could provide a contributing force to collective cell movements, endoderm proliferation was quantified by colocalization of phospho-histone H3 immunofluorescence (red) with electroporation-based endodermal expression of H2B-GFP (green); boxes, enlarged at right, correspond to presumptive hindgut (PHG) endoderm, 1, and node-adjacent endoderm (N), 2. Quantification (below) indicated that ~1% of PHG cells are mitotic, suggesting that cell division is not likely a major contributor to collective movements. Cell numbers are as indicated from n = 4 embryos; A = anterior; P = posterior; mean ± s.d., unpaired two-tailed t-test, *P vs PHG. Scale = 100 μm. g – h, To test whether cell movements are required for hindgut formation, we physically blocked these movements by insertion of a tantalum foil barrier into the endoderm of GFP-electroporated embryos at HH14. In control embryos, where barrier insertion at an anterior location permitted posterior cell movements, the hindgut formed normally: GFP-expressing cells formed a hollow epithelial tube extending into the tail bud, as indicated in sections from anterior to posterior (left to right) through the HH18 tailbud (g, n = 3/3 formed hindgut). However, when the barrier was inserted posteriorly, blocking endoderm movements through the CIP, hindgut formation was disrupted, despite continued outgrowth of the tail bud (h, n = 1/4 formed hindgut); D = dorsal; V = ventral. Scale100 μm.
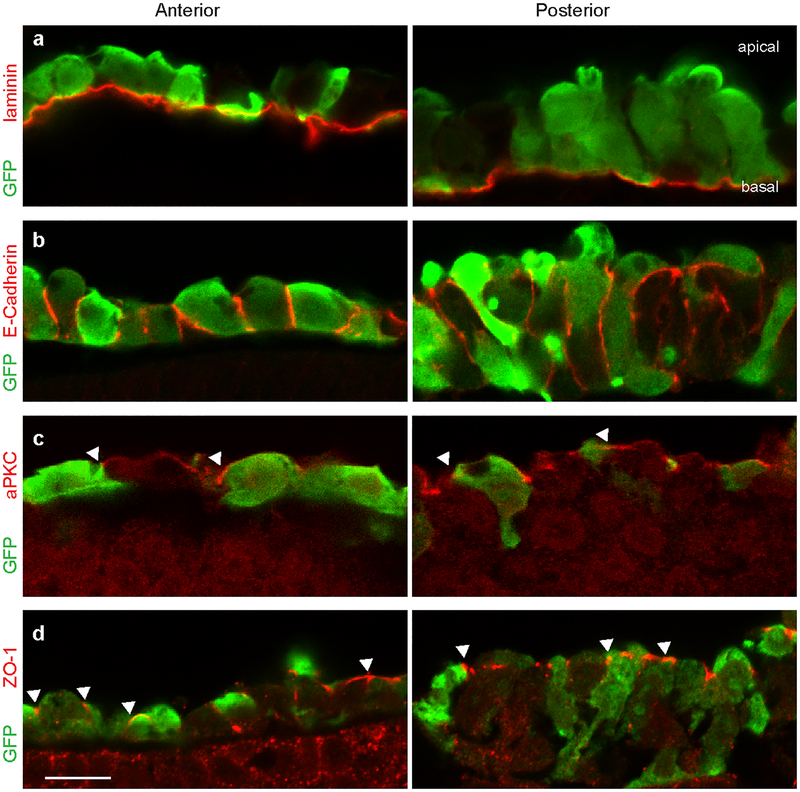
Extended Data Fig. 2. Immunofluorescent detection of polarized epithelial markers in the definitive endoderm.
Preceding gut tube formation, the endoderm demonstrates several hallmarks of a polarized epithelium, including a laminin-rich basement membrane (a), basolateral E-cadherin (b), and apical localization of aPKC (c) and ZO-1(d). Endoderm was visualized by electroporation of GFP, and staining was performed in anterior (left) and posterior (right) endoderm; white arrowheads indicate apical/junctional localization (n=3/3 embryos per immunostain). Scale = 10 μm.
Extended Data Fig. 3. An endodermal contraction gradient based on relative tension measurements.
a, Schematic of strain calculation from cell movements (left) and physical interpretation of the two-dimensional strain components εxy, εxx, and εyy (right). x and y axes coincide with medio-lateral and antero-posterior embryonic axes, respectively. At the cellular level, stretching (positive strains) and compaction (negative strains) in a continuous epithelial sheet may be achieved by changes in cell shape or cell-cell contacts that result in an increase or decrease in the distance between neighboring cell centroids, respectively. See Methods for details on the computation and interpretation of strains in the context of active materials. b, Linear cell density in posterior HH15 endoderm (n = 871 cells from 4 embryos). mean ± s.d., 1-way ANOVA with Dunnett’s correction; *P vs. posterior-most bin. c, Correlation of cell area with antero-posterior position; Pearson’s two-tailed coefficient r = 0.55, n = 616 cells from 3 three embryos; each circle and color indicates one cell and embryo, respectively. d, Dosro-ventral (baso-apical) view of GFP-electroporated cells in the anterior (top left) and posterior (bottom left) endoderm, and negative correlation of cell height with position (right); Pearson’s two-tailed coefficient r = 0.48, n = 522 cells from 5 embryos; each circle and color indicates one cell and embryo, respectively; D=dorsal, V= ventral. Scale 10 μm. e, HH15 posterior embryo in contact with gastromaster tip, diameter D (left), and following local endoderm ablation (right), which creates a cut of size L (dashed line). Relative tension was measured as the ratio L/D. Scale 100 μm. f, Severed notochord visible following gastromaster ablation; samples in which the notchord was cut in addition to the endoderm were not included in the analysis. g, Relative tension measured over time after cutting at t = 0+ (n = 3). Within 1 – 2 minutes, wound healing response was initiated, decreasing cut size (not shown). mean ± s.d., 1-way ANOVA with Tukey’s correction; n.s. = not significant vs. t = 0+. h, Negative correlation of relative tension in wild type HH15 posterior endoderm with position; Pearson’s two-tailed correlation, r = 0.94, n = 22 embryos. i, Relative posterior tension at HH15 is significantly reduced following treatment 100 μM Y-27632 (Rho kinase inhibitor) and 100 μM blebbistatin (nonmuscle myosin inhibitor), when compared to with 0.1% DMSO (n = 10 embryos each). mean ± s.d., 1-way ANOVA with Tukey’s correction; *P < 0.001 vs 0.1% DMSO. j, Comparison between relative tension along antero-posterior (A-P, n = 7 embryos) and medio-lateral (M-L, n = 4 embryos) axes. mean ± s.d., unpaired two-tailed t-test.
Extended Data Fig. 4. Antero-posterior morphogenetic strains in the hindgut forming endoderm.
Average antero-posterior strain εyy (n = 3 embryos, mean ± s.d.) vs position for embryos electroporated with GFP (a), dnFGFR1 IRES GFP (b), and FGF8 IRES GFP (c). Large negative (compaction) strains observed in GFP- electroporated embryos were eliminated upon dnFGFR1 and FGF8 misexpression.
Extended Data Fig. 5. Endoderm cell movements and strains are disrupted with inhibition and activation of acto-myosin contractility.
a-c, Representative cell tracks (HH14 to HH16) of GFP electroporated embryos exposed to 0.1% DMSO (a, n = 0/3 embryos affected), 2.5 μM Cytochalasin D to disrupt acto-myosin activity (b, n = 3/3 embryos affected), and 20 nM Calyculin A to uniformly increase myosin activity (c, n = 3/3 embryos affected). Scale = 100 μm. d-f, Average antero-posterior strain εyy (n = 3 embryos, mean ± s.d.) vs position from time lapse experiments for embryos electroporated with GFP and treated with 0.1% DMSO (d), 2.5 μM Cytochalasin D (e). and 20 nM Calyculin A (f).
Extended Data Fig. 6. FGF signaling in the posterior endoderm.
a – b, Fluorescent section in situ hybridization for fgf8 (a), and sprouty1 (b) in sagittal sections through the posterior HH15 embryo (left); numbered boxes indicate magnified images at right; dashed line demarcates boundary between endoderm (E) and mesoderm (M). Scale bars 100 μm at left, and 10 μm in the magnified images at right; gradient expression of both genes observed in n = 3/3 embryos. b’, Isolated signal from endoderm only (left) and quantification of relative fluorescence (right). c, Immunofluorescent detection of di-phospho ERK (dp ERK) 1/2 with boxed regions magnified below; dashed line marks boundary between endoderm (E) and mesoderm (M). Scale 100 μm (top) and 10 μm (bottom). At right, quantification of dp ERK 1/2 per cell along the antero-posterior axis (n = 3 embryos); RFU = relative fluorescent units. d, Embryos cultured in the presence of 50 μM SU5402 from HH14 to HH18 (left), magnified at right (top), displayed normal anterior development, but posterior defects, including axis truncation, allantois malformation, and failure of the posterior endoderm to internalize and form hindgut; compared to 0.1% DMSO control (bottom); n = 7/9 affected vs. 0/10 in 0.1% DMSO. Scale = 1 mm. e, Somitogenesis unaffected by 50 μM SU5402 exposure in EC culture, despite dependence of this process on FGF signaling, suggests effects of SU5402 were primarily restricted to the endoderm. HH13 embryos cultured for 9 hours in the presence of either 0.1% DMSO or 50 μM SU5402 following Di I injection into the last formed somite (red) at the time of exposure (n = 3). Scale bar = 100 μm. f, dp ERK 1/2 staining in the posterior endoderm following incubation of embryos from HH13 to HH15 in the presence of either 0.1% DMSO (top, n = 3) or 50 μM SU5402 (bottom, n = 3); effects of SU5402 were most pronounced in endoderm, with some subtle reduction in dp ERK ½ extending into the subadjacent mesodermal cells. White dashed line indicates boundary between endoderm (E) and mesoderm (M). Scale 10 μm. g, Quantification of order parameter for embryos electroporated with GFP, dnFGFR1 IRES GFP, or FGF8 IRES GFP (n = 4 embryos per condition); mean ± s.d., 1-way ANOVA with Tukey’s correction; n.s. = not significant vs. GFP.
Extended Data Fig. 7. Role of FGF in modulating endodermal tension via direct effects on acto-myosin activity.
a, To detect the timescale across which inhibition of FGF signaling induces a reduction in endoderm tension, embryos exposed to either 0.1% DMSO or 50 μM SU5402 for up to 120 minutes after onset of exposure, and relative tension was measured over time (n = 5 embryos per group per timepoint). A significant decrease in tension was observed within 30 minutes of exposure to SU5402. mean ± s.d.,2-way ANOVA with Tukey’s correction, * vs. DMSO at equivalent time point. b, In order to test efficacy of cycloheximide treatment in inhibition of protein translation, embryos were electroporated with GFP and then incubated for 6 hours in the presence of either 0.1% DMSO or 20 μM Cycloheximide. In contrast to DMSO-treated controls (n = 3/3 GFP-positive embryos), GFP signal was undetectable in CHX-treated embryos (n=0/3 GFP-positive embryos). Scale 100 μm. c, Relative tension at HH15 following incubation in 0.1% DMSO or 20 μM Cycloheximide (CHX) in the presence or absence of 500ng/μL rhFGF8 (n = 9 per condition); mean ±s.d., 1-way ANOVA with Tukey’s correction; overbars indicate comparison for stated P value.
Extended Data Fig. 8. FGF signaling controls tissue strain and contractility in the posterior endoderm.
a – b, RhoA-GTP stained sagittal sections (n = 3) from HH15 embryos electroporated with GFP (a, top) or FGF8 IRES GFP and (a, bottom) in the anterior endoderm, and GFP (b, top) or dnFGFR1 IRES GFP (b, bottom) in the posterior endoderm. Scale 10 μm. c, Quantification of RhoA-GTP immunofluorescence per cell in anterior and posterior endoderm (n = 3 embryos per condition); mean ±s.d., 2-way ANOVA with Tukey’s correction; *P vs. posterior; RFU = relative fluorescent units. d – e, Immunofluorescent detection of total RhoA in HH15 sagittal sections following electroporation with GFP (d, top) or FGF8 IRES GFP (d, bottom) in the anterior endoderm (n = 4), and GFP (e, top) or dnFGFR1 IRES GFP (e, bottom) in the posterior endoderm (n = 4 embryos); dashed line demarcates boundary between endoderm (E) and mesenchyme (M). Scale 10 μm. f, RhoA enrichment in posterior vs. anterior endoderm quantified on a per cell basis from immunofluorescent detection at HH15 (n = 4); mean ± s.d., 1-way ANOVA with Tukey’s correction, *P vs. GFP; RFU = relative fluorescent units. g – h, Immunofluorescent detection (g) and quantification (h) of phospho-myosin light chain (pMLC) in the posterior endoderm for embryos cultured from HH13 to HH15 in the presence of either 0.1% DMSO (top, n = 3) or 50 μM SU5402 (bottom, n =3); dashed white lines indicate boundary between endoderm (E) and mesoderm; mean ± s.d., unpaired two-tailed t-test; RFU = relative fluorescent units. Scale 10 μm. i, To determine whether it is cell-cell adhesions are altered by FGF signalingn, immunofluorescent detection of E-Cadherin was carried out in anterior endoderm (left) comparing GFP and FGF8 IRES GFP electroporated embryos, and in the posterior endoderm (right) comparing GFP and dnFGFR1 IRES GFP electroporated embryos. No overt differences in E-Cadherin were observed, with localization along the basolateral boundaries of cells in the posterior and anterior endoderm, independent of FGF activity (n=3/3 per condition). Changes in cell morphology can also be readily seen here, with FGF8-expressing cells in the anterior endoderm adopting a columnar epithelial morphology similar to the wild-type posterior endoderm, and dnFGFR1-expressing posterior endoderm cells becoming flattened as is seen in the wildtype anterior endoderm. Scale 10 μm. j-m, Owing to reduendancy between FGF4 and FG8 in other contexts (see Supplemental Discussion), we tested whether both act similarly in control of the hindgut-forming endoderm as well. j, Fluorescent section in situ hybridization for Fgf4 in sagittal sections through the posterior HH15 embryo shows a posterior-to-anterior gradient similar to Fgf8 (n=3/3). Scale 100 μm. Whole mount HH18 embryos following electroporation of endoderm at HH12 with GFP (k, n = 0/4 affected) or FGF4 IRES GFP (l, n = 5/7 affected) reveals failure of endoderm to internalize and form hindgut upon misexpression of Fgf4, phenocopying effects of Fgf8 misexpression; arrowhead indicates CIP. Scale 100 μm. m, Relative tension in HH15 endoderm following electroporation of endoderm with GFP or FGF4 IRES GFP (n = 5 embryos per group) reveals that FGF4, much like FGF8, modulates tension in the posterior endoderm, and misexpression eliminates the tensional gradient by elevating tension anteriorly; mean ± s.d., 2-way ANOVA with Tukey’s correction, *P vs. GFP at same antero-posterior level.
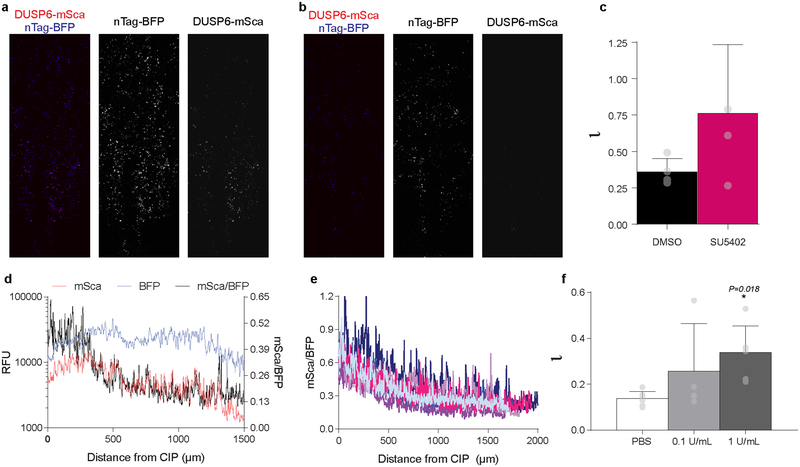
Extended Data Fig. 9. DUSP6 reporter reveals FGF signaling gradient in posterior endoderm.
a – c, DUSP6-mScarlett (mSca) reporter co-electroporated into endoderm with nTag-BFP control plasmid in embryos treated with 0.1% DMSO (a) and SU5402 (b) reveals loss of reporter activity with SU5402 treatment (n=4); as a result, the FGF signaling gradient was flattened, indicated by quantification of the model/shape parameter ɩ (c); mean ± s.d., unpaired, two-tailed t-test. d, Quantification of DUSP6 reporter-driven mSca activity (red, left Y-axis), electroporation control nTag-BFP signal (blue left Y-axis), and the normalization mSca/BFP (black, right Y-axis) from a single representative embryo (replicates in e) as a function of antero-posterior distance from the CIP. e, Normalized reporter activity profiles for six wild-type embryos; each embryo denoted by different color. f, To test sensitivity of the DUSP6 reporter to subtle changes in FGF activity (as opposed to the dramatic effects of FGF ligand misexpression), Heparinase I treatment was used to experimentally broaden the gradient. Because FGF ligands are tightly bound by heparin sulfate proteoglycans (HSPGs), treatment to degrade HSPGs would be expected to effectively increase the diffusion coefficient of FGF ligands, resulting in a broadening of the gradient. Quantification of the dimensionless FGF gradient shape parameter ɩ, as measured by DUSP6 reporter, following treatment with PBS (n = 7 embryos) and Heparinase I at 0.1 U/mL (n = 4 embryos) or 1 U/mL (n = 6 embryos) revealed precisely this; Heparinase caused a dose-dependent increase in ɩ. mean ± s.d.,1-way ANOVA with Tukey’s correction, *P vs. PBS.
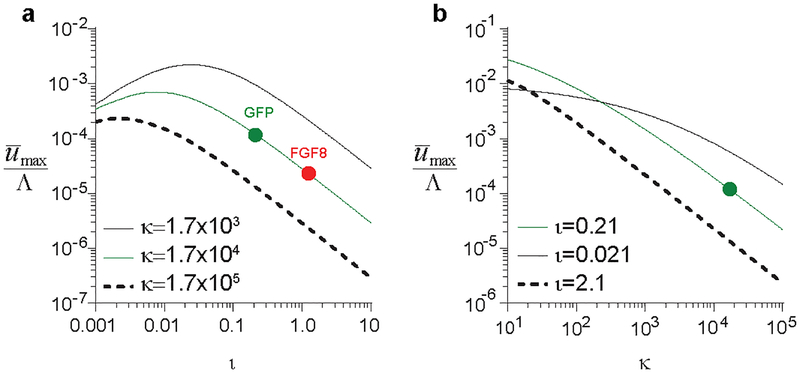
Extended Data Fig. 10. Parametric evaluation of cell movement efficiency.
Dependence of cell movement efficiency on FGF8 transport parameter ι (a) and matrix stiffness parameter κ (b). Green and red circles indicate experimental values for ι following GFP and FGF8 misexpression, respectively.
Supplementary Material
ACKNOWLEDGEMENTS
We thank Mary Hutson, PhD, for the dnFGFR1 IRES GFP plasmid, Patrick Tschopp, PhD, and Olivier Pourquié for valuable discussions, microscopy core MicRoN (Microscopy Resources on the North Quad) at Harvard Medical School, and Sigrid Knemeyer of SciStories LLC for artwork. We acknowledge funding support from the NIH (F32 HD069074, N.L.N; F32 DK103563, C.L.; R01 HD089934, C.J.T.) and the MacArthur Foundation (L.M.).
Footnotes
CODE AVAILABILITY
All code including model implementation and data processing were written and compiled in MATLAB. Code can be accessed by contacting the authors.
DATA AVAILABILITY
Source data for all Figures and Extended Data Figures are available in the online version of the paper.
Authors declare no competing financial interests.
REFERENCES
- 1.Gilbert SF Developmental Biology. (Sinauer Associates, Inc., 2010). [Google Scholar]
- 2.Kwon GS, Viotti M & Hadjantonakis AK The Endoderm of the Mouse Embryo Arises by Dynamic Widespread Intercalation of Embryonic and Extraembryonic Lineages. Dev. Cell 15, 509–520 (2008). [DOI] [PMC free article] [PubMed] [Google Scholar]
- 3.Keller R Cell migration during gastrulation. Curr. Opin. Cell Biol 17, 533–41 (2005). [DOI] [PubMed] [Google Scholar]
- 4.Shyer AE, Huycke TR, Lee C, Mahadevan L & Tabin CJ Bending gradients: how the intestinal stem cell gets its home. Cell 161, 569–80 (2015). [DOI] [PMC free article] [PubMed] [Google Scholar]
- 5.Kim HY et al. Localized Smooth Muscle Differentiation Is Essential for Epithelial Bifurcation during Branching Morphogenesis of the Mammalian Lung. Dev. Cell 34, 1–8 (2015). [DOI] [PMC free article] [PubMed] [Google Scholar]
- 6.Zorn AM & Wells JM Vertebrate endoderm development and organ formation. Annu. Rev. Cell Dev. Biol 25, 221–251 (2009). [DOI] [PMC free article] [PubMed] [Google Scholar]
- 7.Le Douarin NM Etude expérimentale de l’organogenèse du tube digestif et du foie chez l’embryon de poulet. Bull. Biol. Fr. Belg (1964). [Google Scholar]
- 8.Stalsberg H & DeHaan RL Endodermal movements during foregut formation in the chick embryo. Dev. Biol 18, 198–215 (1968). [DOI] [PubMed] [Google Scholar]
- 9.Seidl W & Steding G Topogenesis of the anterior intestinal port. Microkinematographic investigations on chick embryos. Anat. Embryol. (Berl). 155, 37–45 (1978). [DOI] [PubMed] [Google Scholar]
- 10.Stalsberg H & DeHaan RL Endodermal movements during foregut formation in the chick embryo. Dev. Biol 18, 198–215 (1968). [DOI] [PubMed] [Google Scholar]
- 11.Gruenwald P Normal and abnormal detachment of body and gut from the blastoderm in the chick embryo, with remarks on the early development of the allantois. J. Morphol 69, 83–125 (1941). [Google Scholar]
- 12.Hamburger V & Hamilton HL A series of normal stages in the development of the chick embryo. J. Morphol 88, 49–92 (1951). [PubMed] [Google Scholar]
- 13.Bellairs R & Osmond M Atlas of Chick Development, Third Edition. (Academic Press, 2014). [Google Scholar]
- 14.Rosenquist GC The location of the pregut endoderm in the chick embryo at the primitive streak stage as determined by radioautographic mapping. Dev. Biol 26, 323–335 (1971). [DOI] [PubMed] [Google Scholar]
- 15.Lawson K. a, Meneses JJ & Pedersen R. a. Cell fate and cell lineage in the endoderm of the presomite mouse embryo, studied with an intracellular tracer. Dev. Biol 115, 325–339 (1986). [DOI] [PubMed] [Google Scholar]
- 16.Matsushita S Fate mapping study of the endoderm in the posterior part of the 1.5-day-old chick embryo. Dev. Growth Differ 41, 313–319 (1999). [DOI] [PubMed] [Google Scholar]
- 17.Franklin V et al. Regionalisation of the endoderm progenitors and morphogenesis of the gut portals of the mouse embryo. Mech. Dev 125, 587–600 (2008). [DOI] [PubMed] [Google Scholar]
- 18.Friedl P & Gilmour D Collective cell migration in morphogenesis, regeneration and cancer. Nat. Rev. Mol. Cell Biol 10, 445–457 (2009). [DOI] [PubMed] [Google Scholar]
- 19.Varner VD, Voronov DA & Taber LA Mechanics of head fold formation: investigating tissue-level forces during early development. Development 137, 3801–3811 (2010). [DOI] [PMC free article] [PubMed] [Google Scholar]
- 20.Taber LA Nonlinear theory of elasticity : applications in biomechanics. (World Scientific, 2004). [Google Scholar]
- 21.Zamir EA & Taber LA On the effects of residual stress in microindentation tests of soft tissue structures. J. Biomech. Eng 126, 276–83 (2004). [DOI] [PubMed] [Google Scholar]
- 22.Lecaudey V, Cakan-Akdogan G, Norton WHJ & Gilmour D Dynamic Fgf signaling couples morphogenesis and migration in the zebrafish lateral line primordium. Development 135, 2695–705 (2008). [DOI] [PubMed] [Google Scholar]
- 23.Ernst S et al. Shroom3 is required downstream of FGF signalling to mediate proneuromast assembly in zebrafish. Development 139, 4571–81 (2012). [DOI] [PubMed] [Google Scholar]
- 24.Sai X et al. FGF signaling regulates cytoskeletal remodeling during epithelial morphogenesis. Curr. Biol 18, 976–81 (2008). [DOI] [PubMed] [Google Scholar]
- 25.Bénazéraf B et al. A random cell motility gradient downstream of FGF controls elongation of an amniote embryo. Nature 466, 248–252 (2010). [DOI] [PMC free article] [PubMed] [Google Scholar]
- 26.Harding MJ & Nechiporuk, a. V. Fgfr-Ras-MAPK signaling is required for apical constriction via apical positioning of Rho-associated kinase during mechanosensory organ formation. Development 139, 3467–3467 (2012). [DOI] [PMC free article] [PubMed] [Google Scholar]
- 27.Sato A et al. FGF8 signaling is chemotactic for cardiac neural crest cells. Dev. Biol 354, 18–30 (2011). [DOI] [PMC free article] [PubMed] [Google Scholar]
- 28.Dubrulle J, McGrew MJ & Pourquié O FGF signaling controls somite boundary position and regulates segmentation clock control of spatiotemporal Hox gene activation. Cell 106, 219–232 (2001). [DOI] [PubMed] [Google Scholar]
- 29.Mathis L, Kulesa PM & Fraser SE FGF receptor signalling is required to maintain neural progenitors during Hensen’s node progression. Nat. Cell Biol 3, 559–566 (2001). [DOI] [PubMed] [Google Scholar]
- 30.Yu SR et al. Fgf8 morphogen gradient forms by a source-sink mechanism with freely diffusing molecules. Nature 461, 533–536 (2009). [DOI] [PubMed] [Google Scholar]
- 31.Dubrulle J & Pourquié O fgf8 mRNA decay establishes a gradient that couples axial elongation to patterning in the vertebrate embryo. Nature 427, 419–422 (2004). [DOI] [PubMed] [Google Scholar]
- 32.Yang X, Dormann D, Münsterberg AE & Weijer CJ Cell movement patterns during gastrulation in the chick are controlled by positive and negative chemotaxis mediated by FGF4 and FGF8. Dev. Cell 3, 425–437 (2002). [DOI] [PubMed] [Google Scholar]
Associated Data
This section collects any data citations, data availability statements, or supplementary materials included in this article.


