

Abstract
Recent research suggests that epigenetics, especially DNA methylation, plays a mechanistic role in aging. Epigenetic clocks, which measure changes in a few hundred specific CpG sites, can accurately predict chronological age in a variety of species, including humans. These clocks are currently the bestbiomarkers for predicting mortality in humans. Additionally, several studies have characterized the effects of aging across the methylome in a wide variety of tissues from humans and mice. A small fraction (~2%) of the CpG sites show age-related changes, either hypermethylation or hypomethylation with aging. Evaluation of non-CpG site methylation has only been examined in a few studies, with about ~0.5% of these sites showing achange with age. Therefore, while only a small fraction of cytosines in the genome show changes in DNA methylation with age, this represents 2 to 3 million cytosines in the genome. Importantly, the only study to compare the effect of aging on DNA methylation in male and female mice and humans found that N95% of the age-related changes in DNA methylation in the hippocampus were sexually divergent, i.e., the methylation did not differ between males and females atyoung age but age-related changes occurred in one sex but not the other. The age-related changes in DNA methylation tend to be enriched and under-represented in specific genomic contexts, with some commonalities between tissues and species that require further investigation. The strongest evidence that the age-related changes in DNA methylation play a role in aging comes from studies of anti-aging interventions (e.g., caloric restriction, dwarfism, and rapamycin treatment) in mice. These anti-aging interventions deaccelerate the epigenetic clocks and reverse/prevent 20 to 40% of the age-related changes in DNA methylation. It will be important in the future to demonstrate that at least some of the age-related changes in DNA methylation directly lead to alterations in the transcriptome of cells/tissues that could potentially contribute to aging.
Keywords: DNA methylation, Epigenetics, Aging, Caloric restriction, 5-methyl cytosine, 5-hydroxymethyl cytosine, Epigenetic clocks, Gene Expression
1. Introduction
Epigenetics is often defined as functionally relevant changes to the genome that do not involve a change in the nucleotide sequence, e.g., DNA methylation or histone modification. These changes in DNA methylation and/or histone modification alter the availability of DNA to the binding of proteins that can either induce or repress gene transcription. All cytosines [CpGs and CpHs (H = A, T, C)] in DNA can potentially become methylated; however, 5-methyl cytosine (5mC) is enriched in CpG dinucleotides. In addition, these palindromic sites have the unique potential for methylation occurring on both strands of DNA, which can then be copied during cell replication from the parent to daughter strand. Therefore, most of the attention on DNA methylation has focused on CpG sites. However, there are more CpH sites in the genome than CpG sites, and CpH sites have been found to be associated with some cellular outcomes (He & Ecker, 2015). Functionally, 5mC can bidirectionally regulate chromatin status, e.g., methylated DNA colocalizes with heterochromatin (Mellen, Ayata, Dewell, Kriaucionis, & Heintz, 2012) and can directly affect the ability of transcription factors and other DNA binding proteins to access DNA. In the context of gene promoters, hypomethylated CpGs are generally associated with active, constitutively-expressed genes, while hypermethylated CpGs are associated with genes that are silenced or have low expression (Bird, 2002).
Fig. 1A shows the pathway involved in the methylation and demethylation of DNA. Cytosine methylation is catalyzed by three independently encoded DNA methyl transferases (DNMTs), which use S-adenosyl methionine as the methyl donor: DNMT1, DNMT3a and DNMT3b. DNMT1 is generally considered a maintenance methylase, because it methylates only hemi-methylated DNA at CpG sites (Groth, Rocha, Verreault, & Almouzni, 2007; Li, Bestor, & Jaenisch, 1992). Thus, DNMT1 plays an important role in the heritability of epigenetic information (Breiling & Lyko, 2015). In contrast to DMNT1, DNMT3a and DNMT3b are de novo methyl transferases, i.e., they are capable of recognizing and methylating both hemi-methylated and unmethylated DNA (Lim et al., 2010; Okano, Bell, Haber, & Li, 1999). These two methylases are also responsible for DNA methylation that occurs at CpH sites. While transcription factors and histones are known to direct DNMTs to specific genomic regions, these mechanisms are poorly understood (Marchal & Miotto, 2015). Knocking out any of these three DNMTs in mice is embryonically lethal because DNA methylation patterns are essential in embryonic development, (Li et al., 1992; Okano et al., 1999). Our understanding of DNA methylation has evolved from one in which methylation patterns are set during development and generally immutable, to a braoder perspective where DNA methylation is dynamically regulated in the cell (Smith & Meissner, 2013).
Fig. 1.
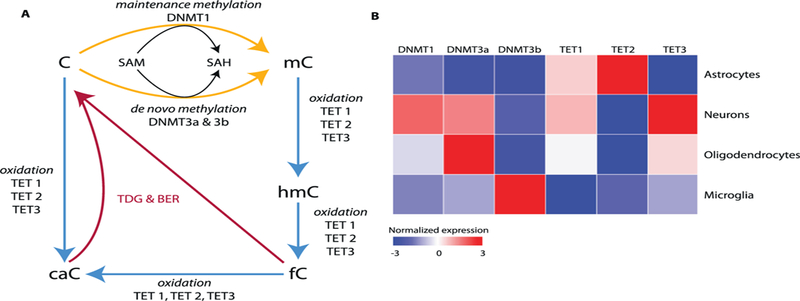
The pathway for DNA methylation. A) The steps involved in the formation and elimination of 5-methyl cytosine (mC) in DNA is shown. Abbreviations: SAM, S-adenosyl methionine; SAH, S-adenosyl homocysteine; hmC, 5-hyroxymethyl cytosine; fC, 5-formyl cytosine; caC, 5-carboxyl cytosine; BER, base excision repair; TDG, thymidine DNA glycosylase. B) Expression of genes involved in methylation varies between cell types and tissues. For example, different cell types in brain express various levels of the mRNA transcripts for DNMTs and TETs. Data taken from Zhang et al. (2014).
The 5mC residues in the genome can be lost spontaneously when the cytosines are not methylated during replication, from the deamination of 5mC to thymine, or from the repair of regions of the genome that contained 5mCs. In addition, the demethylation of 5mC sites can occur through an active pathway where the methyl group on cytosine is first modified and then removed and replaced by DNA repair as shown in Fig. 1A. Ten-eleven translocation (TET) proteins (also termed 5-mC dioxygenases) initiate the specific demethylation of 5mC residues in DNA. The TET family of proteins includes three proteins: TET 1, TET 2, and TET 3. All three TETs have similar activity and catalyze similar reactions (Ito et al., 2010). The three TET proteins catalyze the oxidation of the methyl group on cytosine to 5-hydroxymethyl cytosine, 5hmC (Tan & Shi, 2012). Because the increase in 5hmC levels coincides with the reduction of 5mC (Iqbal, Jin, Pfeifer, & Szabo, 2011; Wossidlo et al., 2011), the formation of 5hmC is believed to be the first step in the active demethylation of 5mC residues in DNA. However, it is now becoming apparent that 5hmC might be important in the epigenetic regulation of gene expression in its own right (Chen, Dzitoyeva, & Manev, 2012), especially in stem cells (Cheng, Bernstein, Chen, & Jin, 2015).
The TET proteins are also involved in the oxidation of 5hmC to 5-formylcytosine and 5-carboxylcytosine. In turn the 5-formylcytosine and 5-carboxylcytosine are directly excised and repaired by the base excision repair pathway (Pastor, Aravind, & Rao, 2013). 5hmC can also be deaminated by activation-induced cytosine deaminase to 5-hyroxymethyluracil; therefore, 5hmC is also removed and replaced with a non-methylated cytosine by the base excision repair pathway (Guo, Su, Zhong, Ming, & Song, 2011). Because changes in one or more of the enzymes involved in DNA methylation could have a global impact on DNA methylation, several groups have studied the effect of age on the expression of DMNTs and TETs. In a recent review, we showed there is currently no consensus on how the expression of any of the DMNTs or TETs changed with age; some studies show an increase, some a decrease, and others no change with age (Unnikrishnan et al., 2018).
The expression of the DNMTs and TETs vary greatly from tissue to tissue, and for example the TET proteins are generally highly expressed in brain (Ito et al., 2010; Khare et al., 2012). As shown in Fig. 1B, the relative levels of the the DNMTs and TETs differs greatly in the various cell types found in the central nervous system. The functional implications of these different patterns of expression of DNMTs and TETs remains to be determined.
The first evidence that aging might have an effect on DNA methylation came from studies using high-performance liquid chromatography (HPLC) to measure the 5mC content of hydrolyzed DNA. In 1973, Vanyushin et al. reported that the total levels of 5mC in DNA isolated from various tissues of rats decreased with age. Subsequently, Wilson, Smith, Ma, and Cutler (1987) reported that the levels of 5mC decreased with age in DNA isolated from various tissues or cells from mice, Peromyscus, and humans; this decrease was greatest in the shorterlived mice. These reports lead to the hypomethylation hypothesis of aging, which proposed that the spontaneous, random loss of 5mCs with age leads to the abnormal expression of genes in cells/tissues of old animal that are normally repressed (Zs-Nagy, Cutler, & Semsei, 1988). However, investigators have not been able to demonstrate a relaxation in gene regulation with age. In addition, most of the current research reports no change in the total 5mC content of the genome occurs with increasing age (see review by Unnikrishnan et al., 2018).
Over the past three decades several assays for measuring DNA methylation have been developed, and Masser et al. (2018) have described the advantages and disadvantages of these assays. For example, anti-bodies have been generated that are specific for mC or hmC, which allow investigators to measure global levels of methylation in a DNA sample or in various tissues by immunochemistry. Using these antibodies combined with next-generation-sequencing assays such as methylated DNA immunoprecipitation (meDIP-Seq) (Weber et al., 2005), and methyl-binding domain sequencing (MBD-Seq) (Rauch & Pfeifer, 2005), assays have been developed that can identify the regions of the genome where changes in DNA methylation occur. However, these affinity-based approaches only give one a general view of what regions of the genome show a change in methylation; changes in the methylation at specific sites cannot be measured with these assays.
A major development in studying DNA methylation occurred when it was shown that treating DNA with bisulfite, which specifically deaminates unmethylated cytosine to uracil but not methylated cytosines, combined with DNA sequencing allowed investigators to measure DNA methylation in specific cytosine residues (Clark, Harrison, Paul, & Frommer, 1994; Frommer et al., 1992). Using bisulfite conversion, investigators can measure changes in DNA methylation at specific sites throughout the genome using either oligonucleotide-arrays or next-generation-sequencing. The current oligonucleotide-arrays commercially available allow investigators to measure DNA methylation at b2% of the CpG sites in the human genome. On the other hand, next-generation-sequencing theoretically allows investigators to measure methylation at all cytosines, both CpG and CpH sites, in any genome. Although the global amount of 5mC in a genome does not appear to change significantly with age (Unnikrishnan et al., 2018), it is becoming clear that DNA methylation at specific sites in the genome changes with age; they can become either hypo-or hypermethylated. Over the past five years, several reviews on the effect of age on DNA methylation have appeared (Horvath & Raj, 2018; Johnson et al., 2012; Jung & Pfeifer, 2015; Zampieri et al., 2015). In this review, we focus on the effect of age and anti-aging interventions on the methylation of cytosine resides in specific regions or at specific sites in the genome of humans and laboratory rodents. With the development of deep sequencing, methylation of adenine (N6-methyl-adenine, 6 mA) in DNA has been observed, albeit at very low levels, in a variety of eukaryotes including humans (Xiao et al., 2018). While 6 mA has been recognized as an epigenetic signal in microorganisms (Wion & Casadesus, 2006), its role in eukaryotes is poorly understood; therefore, we have focused our review on cytosine methylation and hydroxymethylation.
2. Epigenetic clocks
With the availability of oligonucleotide-arrays to specific CpG sites in the human genome, investigators have studied how DNA methylation changes at specific CpGs in various age-related diseases and with aging. Reports by Bjornsson et al. (2008), Christensen et al. (2009), and Teschendorff et al. (2010) were some of the first to show that methylation at specific loci across the human genome changed with age. The report by Bocklandt et al. (2011) showing that 88 CpG sites in DNA from saliva were highly correlated with age stimulated the search for CpG sites that would be a biomarker of chronological age. Building from these initial observations, investigators used supervised machine learning methods (e.g., elastic net) on datasets containing both DNA methylation data and chronological age information to ‘learn’ which CpG sites in the human genome predict chronological age with high accuracy. The predictive accuracy of the trained models in estimating chronological age were then validated in independent cohorts of subjects of various ages. Using this methodology, several epigenetic clocks have been developed that predict chronological age based the rate of change in methylation in 3 to 513 CpG sites in DNA from a tissue or blood.
2.1. Human epigenetic clocks
Currently, four clocks have been developed to measure chronological age in tissues from humans, and they are described in Table 1. The most widely used epigenetic clock was developed by Horvath (2013). The Horvath clock used DNA methylation data obtained from publicly available datasets for various human tissues and cell types. Using 353 CpG sites, the Horvath clock predicts chronological age with a mean absolute deviance of 3.6 years. Interestingly, while many of the CpG sites individually show only a weak correlation with age, this subset of CpG sites predicts chronological age with great accuracy. Hannum et al. (2013) also developed an epigenetic clock using DNA methylation data from blood. The Hannum clock model is based on 71 CpG sites and when applied to an independent cohort shows high age correlation of with a mean absolute deviance of 4.9 years. Even though the Horvath and Hannum clocks are robust measures of chronological age (see review by Horvath & Raj, 2018) only 5 CpG sites are shared between the clocks. The predicative accuracy of the Hannum clock, which was developed using blood samples, declines when applied to other tissues. In contrast, the Horvath clock performs well with a variety of tissues; how-ever, the accuracy of the Horvath clock in predicting age is less for skeletal muscle, heart, and breast (Horvath, 2013).
Table 1.
List of epigenetic clocks developed for humans.
| Epigenetic clock | Platform used | Tissues used in training | CpG Sites identified | Accuracy in predicting age |
|---|---|---|---|---|
| Horvath Clock Horvath (2013) | 27 k & 450 K arrays | Blood, brain, breast, buccal cells, colon, heart, liver, lung, placenta, saliva, CD4 cells, immortalized B cells, adipose, kidney, muscle, uterine tissue | 353 | r2 = 0.96 |
| Hannun Clock Hannun et al. (2013) | 27 k & 450 K arrays | Blood | 71 | r2 = 0.91 |
| Weidner Clock Weidner et al. (2014) | 27 k & 450 K arrays | Blood | 3 | r2 = 0.98 |
| PhenoAge Clock Levine et al. (2018) | 27 k, 450 K, & EPIC arrays | Blood | 513 | r2 = 0.92 |
In 2014, Weidner et al. described an epigenetic clock derived from blood that could predict age using just 3 CpG sites. For site selection the authors first reduced their dataset to 102 CpG sites that were highly correlated with age (mean absolute deviance = 3.3 years), and from these sites, 3 sites located on the ITGA2B, ASPA and PDE4C genes were able to predict chronological age in human blood samples.
Can the epigenetic clocks also predict biological age, i.e., the decline in function of an animal, as well as chronological age? Over the past 5 years, several reports suggest that the Horvath and Hannum clocks might be useful in measuring biological age in human tissues/cells, for example:
Several age-related conditions are linked to epigenetic age acceleration, e.g., Alzheimer’s disease, cancer, cardiovascular disease, and Huntington’s disease (for a review see Horvath & Raj, 2018). However, the Horvath clock was not associated with cognitive decline in monozygotic twins (Starnawska et al., 2017).
Frailty (Breitling et al., 2016) and frailty outcomes such as grip strength (Sillanpaa et al., 2018) were associated with epigenetic age acceleration; however, standing balance and chair-rise time were not correlated to accelerated epigenetic aging (Simpkin, Suderman, & Howe, 2017).
Accelerated epigenetic aging is observed in individuals with Werner’s syndrome who exhibit many signs of accelerated aging (Maierhofer et al., 2017); however, decelerated aging observed in Syndrome X patients is not correlated to changes in the epigenetic clock (Walker et al., 2015).
HIV related changes that mimic accelerated aging are correlated with accelerated epigenetic aging (Horvath & Levine, 2015; Levine et al., 2016; Horvath et al., 2018). In addition, measures of obesity such as BMI and waist circumference are shown to be associated with accelerated epigenetic aging (Grant et al., 2017; Horvath et al., 2014). How-ever, such a correlation was not observed in other studies (Nevalainen et al., 2017; Sillanpaa et al., 2018), and Grant et al. (2017) did not find a significant correlation to their 7 diabetesrelated phenotypes.
The epigenetic clocks predict all-cause mortality in a variety of human cohorts (Chen et al., 2016; Christensen et al., 2016; Perna et al., 2016; Levine et al., 2018; Marioni et al., 2018). However, Kim, Myers, Wyckoff, Cherry, and Jazwinski (2017) found that the Horvath clock did not predict mortality in blood from a cohort of 262 subjects ranging in age from 60 to 103.
Because the Horvath, Hannum, and Weidner clocks were trained primarily on chronological age, Horvath’s group set out to develop an epigenetic clock that would better predict biological aging by incorporating clinical measures (e.g., levels of albumin, creatinine, glucose, C-reactive protein, etc.) in addition to chronological age to capture changes in healthspan. The resulting PhenoAge clock described in Table 1 uses 513 CpG sites (Levine et al., 2018). Forty-one of the CpG sites were shared with the Horvath clock and 6 shared with the Hannun clock. The PhenoAge is highly correlated with chronological age (r = 0.94) and outperforms earlier iteration of the epigenetic clock in prediction of disease risk and mortality using various tissues and cells.
2.2. Animal epigenetic clocks
Due to the potential utility of the epigenetic clock in predicting accelerated aging in humans, investigators began developing epigenetic clocks to predict chronological age in other animal species. In 2017, four epigenetic clocks were developed for mice and dogs/wolves (Table 2). In contrast to the human clocks, which used oligonucleotide-arrays to identify subsets of CpG sites that predicted chronological age, these clockswere developed using reduced representation bisulfite sequencing (RRBS), which analyzes a greater number of CpG sites (< 1 million) compared to the array-based methods. Thompson, Vonholdt, Horvath, and Pellegrini (2017) used DNA from the blood of domestic dogs and gray wolves to generate an epigenetic clock of 115 CpG sites (41 CpGs for doges and 67 CpGs for wolves). When comparing the syntenic locations of the 115 CpG sites to CpG sites generated for human clocks, they found there was a statistically significant (but small) conservation of sites, which is striking because the studies used different platforms to measure DNA methylation and the relatively small number of animals used by Thompson et al. (2017).
Table 2.
List of epigenetic clocks developed for animals.
| Epigenetic Clock | Species | Platform Used | Tissues Used in Training | CpG Sites Identified | Accuracy in Predicting Age |
|---|---|---|---|---|---|
| Thompson et al. (2017) | Dogs & wolves | RRBS | Blood | 115 | r2 = 0.79 |
| Petkovic et al. (2017) | Mice (C57BL/6) | RRBS | Blood | 90 | r2 = 0.90 |
| Stubbs et al. (2017) | Mice (C57BL/6) | RRBS | Liver, lung, muscle, spleen, cortex, & cerebellum | 329 | r2 = 0.84 |
| Wang et al. (2017) | Mice (Ames wild type) | RRBS | Liver | 148 | r2 = 0.91 |
The epigenetic clocks for mice are of particular interest to the aging community because mice are the most studied mammalian model with respect to the biological pathways and processes involved in aging. Thus, epigenetic clocks for mice have the potential to provide new information on how changes in DNA methylation might impact aging. The three epigenetic clocks developed for mice were generated with tissues from male C57BL/6 mice (Table 3). The three clocks used the following number of CpG sites: 90 (Petkovich et al., 2017), 329 (Stubbs et al., 2017), and 148 (Wang et al., 2017). These CpG sites were distributed across the mouse genome. The Petkovich and Stubbs clocks predicted the chronological age in both male and female C57BL/6 mice. The Petkovich clock also accurately predicted the chronological age of B6D2F1 mice, and the Wang clock predicted chronological age in Ames wild type mice and UM-HET3 mice. None of the CpG sites identified by Petkovich et al. (2017) matched the CpG sites used in either the Horvath and Hannum clocks.
Table 3.
The effect of age on methylation of specific CpG sites in the genome.
| Age | Sex | Tissue/cell type | Method | CpG sites |
References | |||
|---|---|---|---|---|---|---|---|---|
| Total Sites Studied | Total changed | Hyper-methylated | Hypo-methylated | |||||
| Humansa | ||||||||
| 19–101 | M & F | Blood | Array | 485,577 | 70,387 (14.5%) | _ | – | Hannum et al., 2013 |
| 34–61 | M | PBMC | Array | 463,228 | 10,625 (2.3%) | 7081 | 3544 | Steegenga et al., 2014 |
| 28–64 | M & F | Liver | Array | 455,526 | 20,396 (4.4%) | 19,548 | 848 | Bysani et al., 2017 |
| Miceb | ||||||||
| 4 & 24 | M (C57Bl/6) | HSC | WGBS | ~20 million | 448,166 (2.2%) | 275,622 | 172,543 | Sun et al., 2014 |
| 3 & 24 | M (C57Bl/6) | Hippocampus | BOCS | ~3 million | 36,170 (1.2%) | 21,295 | 14,294 | Masser et al., 2017 |
| 3 & 24 | F (C57Bl/6) | Hippocampus | BOCS | ~ 3 million | 48,410 (1.6%) | 27,987 | 19,842 | Masser et al., 2017 |
| 5 & 27 | F (C3B6F1) | Liver | BS-Seq | ~29 million | 79,400 (0.3%) | 48,625 | 30,775 | Hahn et al., 2017 |
| 2 & 22 | M (UM-Het3) | Liver | WGBS | ~ 21 million | 49,899 * | 14,365* | 35,534* | Cole et al., 2017 |
| 3 & 24 | M (C57Bl/6) | Hippocampus | BOCS | ~2 million | 41,585 (2.0%) | 26,180 | 15,425 | Hadad et al., 2018 |
M&F–samplesfrom malesand femalescombined fordata generation
humanageinyears
mouseage inmonths;WGBS- WholeGenomeBisulfiteSequencing;BOCS-BisulfiteoligonucleotideCapture Sequencing; BS-Seq-Bisulfite Sequencing; Array-Illumi na BeadChip
- numbers represent differential methylated regionsand not CpG sites.
A major advantage of studying mice is that several interventions have been shown to increase the lifespan and delay aging in mice (Unnikrishnan et al., 2018). Therefore, it is possible to determine if the mouse clocks able to predict reduced aging in these models. Petkovich et al. (2017) studied the mice fed a calorie-restricted (CR) diet, Snell dwarf mice, and growth hormone receptor knockout mice (GHR-KO). All of these manipulations increase lifespan, improve most physiological functions, and reduce most pathological lesions (for review see Unnikrishnan et al., 2017); therefore, it is well accepted that aging is delayed/retarded in these mice, i.e., they are biologically younger than their chronological age. Petkovich et al. (2017) found that the epigenetic age of mice fed a CR diet was 20% lower than the chronological age. The epigenetic age of the Snell dwarf mice and the GHR-KO dwarf mice was also lower than the chronological age of their littermate controls. Wang et al. (2017) also studied the effect of dwarfism and CR on their clock as well as rapamycin, which has been shown to increase the lifespan of a variety of mouse models (Richardson, Galvan, Lin, & Oddo, 2015) the epigenetic age was significantly less for all three of these mouse models of delayed aging. At 22 months of age, the Ames dwarf mice, CR mice, and rapamycin treated mice showed an average reduction in epigenetic age of 10.1, 9.4, and 6 months, respectively compared to their age-matched controls. Thus, these data suggest that the clocks developed by Petkovich et al. (2017) and Wang et al. (2017) appear to not only measure chronological age, but are a reflection of biological age. Stubbs et al. (2017) reported that ovariectomy accelerated their clock in female mice, and they suggested that this was due to accelerated aging. However, the effect of ovariectomy on aging in rodents is uncertain. For example, while Asdell, Doornenbal, Joshi, and Sperling (1967) reported that ovariectomy reduced the lifespan of rats, Iwasa et al. (2017) found that ovariectomy increased the lifespan of female rats.
Recently, Frobel et al. (2018) reported an interesting use of the epigenetic clock in determining the effect of the tissue micro-environment on the cellular aging of human hematopoietic stem cells. They used the Horvath and Hannum clocks to determine whether human stem cells transplanted into mice showed an increased rate of epigenetic aging because of the accelerated aging environment of the mouse. Nineteen weeks after transplanting the human stem cells into mice, they found that epigenetic aging was only modestly increased in mice, leading the authors to conclude that the accelerated aging xenogenetic environment of the mouse had minimal effect on the epigenetic clock of the human stem cells.
2.3. Summary
In less than five years, epigenetic clocks have become a well-accepted, robust measure of chronological age in humans, dogs/wolves, and mice that works effectively in both males and females. In addition, Ito, Udono, Hirata, and Inoue-Murayama (2018) recently reported that methylation of CpG sites within three genes predicted age in chimpanzees. It is clear from the current studies that there is no ‘one’ unique clock; rather, methylation at various combinations of CpG sites are able to predict chronological age. In addition, epigenetic clocks appear to be a more accurate measure of chronological age than other biomarkers that have been developed in the past. For example, telomere length has been the most used biomarker of aging in the past, with telomere length predicting mortality better than age (Bize, Criscuolo, Metcalfe, Nasir, & Monaghan, 2009). However, telomere length’s actual age prediction is very poor (r2 = 0.14) compared to the epigenetic clocks.
While epigenetic clocks have been highly accurate in predicting chronological age, it is research is now focused on whether these clocks can accurately measure biological age, i.e., the functional status of an individual. As discussed above, a large number of studies show that accelerated epigenetic aging is associated with various age-related diseases and conditions associated with aging. In addition, the clocks appear to predict mortality in humans. However, there are a few reports showing no significant correlation of the clock to conditions that are associated with aging. For example, Quach et al. (2017) reported that metformin treatment, which is used to treat type 2 diabetes and has some anti-aging properties (Martin-Montalvo et al., 2013) does not delay epigenetic aging. Currently, strongest evidence that the epigenetic clock can predict biological age comes from studies by Petkovich et al. (2017) and Wang et al. (2017), which showed that interventions that increased lifespan and delayed aging in mice decelerated epigenetic aging. Thus, epigenetic clocks are currently the best biomarker for predicting chronological age. In addition, these clocks appear to predict biological aging, which makes them the only biomarker available to invesitagors at the present time for assessing biological aging.
3. Effect of age on DNA methylation
3.1. Effect of Age on changes in 5mC at specific Sites in the Genome
The reports by Horvath (2013) and Hannum et al. (2013) showing that changes in a few hundred CpG sites were able to predict chronological age sparked a great deal of interest in the role DNA methylation might play in aging. Because the epigenetic clocks use only a small fraction of the ~40 million CpG sites and none of the ~430 million CpH sites in the genome to measure age, the epigenetic clocks are of limited value in understanding the mechanisms by which DNA methylation may regulate the genome and aging. With the ability to measure methylation at specific cytosines throughout the genome, investigators are now beginning to gain insight into how DNA methylation throughout the genome changes with age, which is the first step in determining the functional importance of changes in DNA methylation. In this section, we focus on those reports that have studied the effect of age on major portions of the genome (N 400 million cytosines); we have not included studies that have looked at the effect of age on a few promotors or a small region of the genome. Table 3 lists the nine studies that have been reported over the past five years that have interrogated the methylation at specific cytosines in a large portion of the genome. Depending on the amount of the genome interrogated, 10 thousand to several hundred thousand CpG sites show significant changes (increase or decrease) in methylation with age. In humans, where ~450 thousand CpG sites were analyzed using commercial arrays, 2 to 14% of the CpG sites studied showed a change in methylation. In mice, where a greater fraction of the genome was analyzed, 0.3 to 2% of the CpG sites studied showed a significant change with age. Except for the study by Hannum et al. (2013), all the studies showed that b5% of the CpG sites analyzed show a significant change in methylation with age in humans and mice, i.e., it appears that only a small fraction of the CpG sites in the genome is altered with age; however, even if 2% (the average of the studies showing a 0.3 to 4% change) of the CpG sites change with age, it would mean that the methylation of ~800 thousand CpG sites are likely to change with age in the genome of a tissue/cell.
The data in Table 3 also show that CpG sites become both hyper- and hypomethylated with age. Except for the study by Cole et al. (2017), all eight studies show more hypermethylation with age than hypomethylation. It will be interesting in the future, as more studies are reported, if there continues to be a predisposition for hypermethylation with age at specific sites and whether this is similar across tissues and cell types.
There have been two studies that have looked at the effect of age on the methylation of CpH sites in the genome. Both of these studies focused on the hippocampal genome of mice. Masser et al. (2017) reported that out of ~28 million CpHs sites analyzed, 150 and 191 thousand CpH sites changed with age (3 to 24 months) in male and female mice respectively. Of the CpH sites that changed significantly with age, 57% and 66% became hypermethylated in male and female mice, respectively. Subsequently, Hadad et al. (2018) observed a significant change in methylation at 79 thousand CpH sites in the ~25 million sites analyzed in male mice. They also observed that ~56% of the sites were hypermethylated. Based on these limited data, it would appear that only 0.3 to 0.7% of the CpH sites in the genome would show changes in methylation with age. However, this would correspond to over 2 million CpH sites in the entire genome, and thus the majority of age related changes in DNA methylation may actually be in the CpH context.
Because changes in DNA methylation with age are likely to occur in hundreds of thousands of cytosines, the question arises as to how many of the changes are spontaneous and random and how many are regulated responses directed to specific genomic locations. As described above, the robust nature of epigenetic clocks and the statistically significant changes described above, which were built on increases or decreases in methylation at specific CpG sites, strongly suggest the changes in methylation are regulated in some manner to specific genomic loci. That does not preclude the possibility that other sites in the genome experience random gains or losses of methylation with aging as these sites would be eliminated in the mathematical development of an aging clock or in statistical tests for age-related differences. To begin to address this question, we have measured the effect of age on the variance in DNA methylation in the mouse brain. As shown in Fig. 2, we observe sex differences in variance with age. Young and old females showed very little difference in variance in methylation patterns, while in male mice there was a significant increase in variance of methylation in old mice compared to young mice. Evaluating the contribution of stochastic changes in DNA methylation with aging would be best understood at the single cell level, which several investigators have attempted to do. While single cell bisulfite sequencing approaches still require refinement to provide base-specific data at the same sites across cells, there is some evidence that the patterns of methylation become more random with age (Vijg, Gravina, & Dong, 2018). Thus, more studies are required to determine the contribution of regulated and random changes to DNA methylation patterns that occur with age. This also leads to another issue in nomenclature – the term ‘epigenetic drift’, which has been utilized both in the context of regulated changes and stochastic changes thereby leading to confusion as to what is actually meant by this term (Martin, 2005, 2009). We suggest the term epigenetic drift should be used to define only those stochastic changes in methylation with age.
Fig. 2.
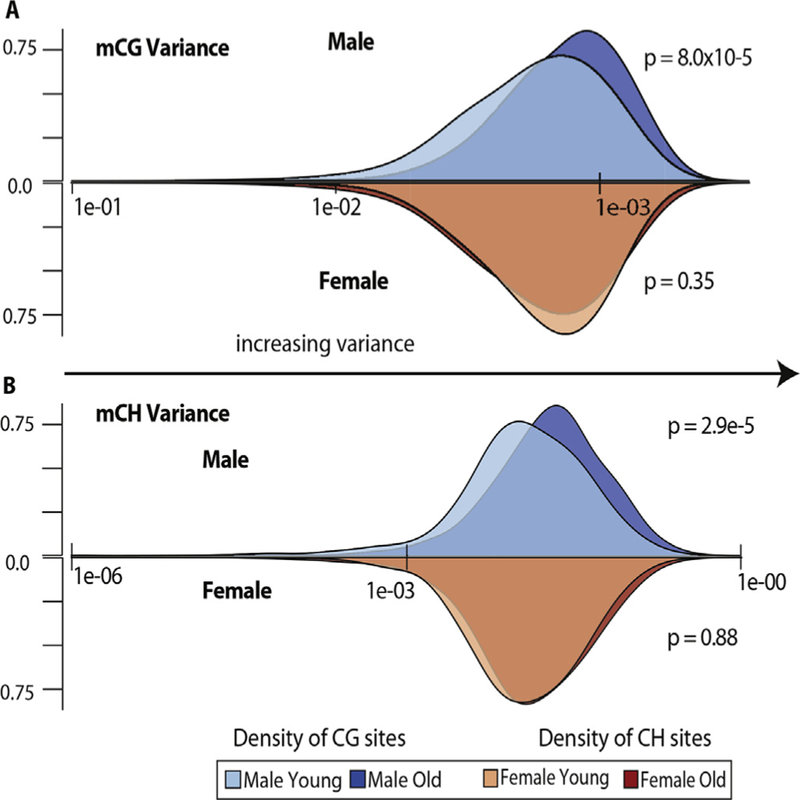
DNA methylation variance with age. A) Mean inter-animal mCG variance of cytosines present at ≥20× sequencing depth in every sample (354,522 CG sites) among young and old males (blue distributions) and females (red distributions) relative to density of sites at a given mean variance. mCG variance distribution in old males (mean variance = 0.157774) compared to young males (mean variance = 0.103581) was significantly higher (p = 8.0 × 10⁻⁵), while comparison of mCG variance in old females (mean variance = 0.112484) to young females (mean variance = 0.107045) was not significant (p = .35). B) Mean inter-animal mCH variance of cytosines present at ≥20× sequencing depth in every sample (5,577,396 CH sites) among young and old males (blue distributions) and females (red distributions) relative to density of sites at a given mean variance. mCH variance distribution in old males (mean variance = 0.050142) compared to young males (mean variance = 0.034209) was significantly higher (p = 2.9 × 10⁻⁵), while comparison of mCH variance in old females (mean variance = 0.038597) to young females (mean variance = 0.033432) was not significant (p = .88).
3.2. Effect of sex on the changes in DNA methylation that occur with aging
Because the epigenetic clocks for humans and mice work effectively in both males and females (see above section), it is generally assumed that the age-related changes in DNA methylation are largely similar in the two sexes. However, as can be seen from Table 3, all of the current studies to date, except one, only studied males. Therefore, except for the study by Masser et al. (2017), we have no information as to whether age-related changes in DNA are similar or differ in males and females. Masser et al. (2017) measured the methylation in both CpG and CpH sites in DNA isolated from the hippocampus of 3-and 24-month-old male and female C57BL/6 mice. The principle finding was that while males and females share common age-related changes in methylation, the majority (N95%) of the changes that occurred with age were sex specific as shown in Fig. 3. In other words, b5% of the changes in DNA methylation with age are common in males and females. It is important to reiterate that these are sex divergences with aging and not life-long sex differences. Thus, although the epigenetic clocks showed no sex differences in predicting chronological age, it is clear from the study by Masser et al. (2017) that male and female have quite different effects on what specific cytosines are altered by aging in the brains of mice. These findings demonstrate the complex interaction of sex and aging that requires a careful and specific terminology because the term ‘sex differences’ is often used indiscriminately. A suggested nomenclature is that changes in only one or the other sex with aging should be described as ‘sex divergences’, i.e., methylation does not differ between sexes at young age but an age-related change occurs in one sex (McCarthy, Arnold, Ball, Blaustein, & De Vries, 2012). Masser et al. (2017) found that N95% of the CpG sites and ~99% of the CpH sites that showed age-related changes in methylation were sex divergent. A ‘sex difference’ would describe a lifelong differential methylation that is unaffected by aging. A few thousand autosomal CpG and CpH sites analyzed by Masser et al. (2017) fit this definition. Sex differences in epigenetic patterns of sex chromosomes would be expected given the different chromosomal content between males and females. Lastly, the often inappropriately used term sex dimorphism should not be used in the context of DNA methylation as this is best defined as a characteristic, such as specific gonads, which is only observed in one sex.
Fig. 3.

– Sex divergence with aging. Hippocampal methylation changes (mCpG) with aging (young = 3 months, old = 24 months, q b 0.01, |Δ%| N 10) are primarily sex-specific. When viewed in this scatterplot there are common changes with age in both males and females (black circle) but the majority of changes occur in only males (blue) or females (pink). Data taken from Masser te al. (2017).
3.3. The genomic context of age-related changes in DNA methylation
As described above, age-related changes in DNA methylation have been observed to occur in tens to hundreds of thousands of CpG sites throughout the genome. Investigators have begun to determine if these changes are randomly distributed throughout the genome or if there are ‘hot spots’ where the changes in DNA methylation preferentially occur as well as regions where the changes do not occur. Therefore, CpGs that are differentially methylated with age (DMCGs) have been mapped to coordinates of known features of the genome (e.g., promotors (TSS sites), CG-islands, shores, and shelves) as well as histone marks (acetylated and methylated histones), which are associated with gene regulatory regions (e.g., activated genes, enhancers, and repressors). Table 4 lists the nine reports that have characterized distribution of DMCGs in the genome. These studies show that DMCGs (or DMRs, differentially methylated regions) are enriched in some areas of the genome and under-represented in other regions. In other words, the age-related changes in CpG methylation are not totally random but the changes appear to occur preferentially in certain genomic contexts. However, the current studies do not show a clear trend as to the regions of the genome where DMCGs are enriched or under-represented. For example, several studies indicate that DMCGs are enriched in CG-islands (Cole et al., 2017; Day et al., 2013; Steegenga et al., 2014), while other studies report a depletion/under-representation of DMCGs in CG-islands (Hadad et al., 2018; Masser et al., 2017; Sun et al., 2014). These contradictory observations are likely due to the limited information currently available, e.g., some studies analyzed only ~25 thousand CpG sites while others analyzed 2 to 28 million sites. In addition, the studies listed in Table 4 have studied a variety of tissues, and it is likely that the distribution of DMCGs in genomic contexts varies from tissue to tissue. For example, the three studies with liver tissue (Bysani et al., 2017; Cole et al., 2017; Hahn et al., 2017) observed that DMCGs (or DMRs) were enriched in areas of the genome involved in transcription (promoters and enhancers). On the other-hand, DMCGs were found to be under-represented in promoters in the hippocampus (Hadad et al., 2018; Masser et al., 2017). Two studies (Hadad et al., 2018; Masser et al., 2017) have also analyzed the genomic distribution of CpH sites that show changes in methylation with age in hippocampus. In general, the genomic distribution of the differentially methylated CpH sites appear to be similar to what was observed for CpG sites, e.g., they were under-represented in CG-islands, shelves, and promoters.
Table 4.
Genomic locations of age-related changes in DNA methylation.
| Reference | Age | Tissue/cell | Genomic coordinates |
|---|---|---|---|
| Humans* | |||
| Day et al. (2013) | 30–90 | Blood, brain, kidney, muscle | Hypermethylated CpGs are found primarily in CG-islands while hypomethylated sites are very rare in cG-islands in all tissues. For Brain and kidney, the trend was similar for shores. in blood and muscle, the shores were enriched in hypomethylated CpGs. |
| Raddatz et al. (2013) | 18–75 | Epidermis | Hypermethylated DMRs are enriched in promoters and hypomethylated DMRs are enriched in enhancers. |
| Steegenga et al. (2014) | 30–43 & 52–66 | PBMCs | Hypermethylated DMCGs predominantly present in CC-islands while hypomentylated DMCGs found in less dense CpG regions, e.g., shelves and single CpGs. |
| Bysani et al. (2017) | 28–64 | Liver | Enrichment of DMCGs observed at transcription start sites, 5′-untranslated regions, and first exons. Under-representation of DMCGs at the gene body, 3’-UTR, and intergenic regions. Significant enrichment of DMGCs observed at GC-islands and under-represented in shelfs. |
| Mice* | |||
| Sun et al. (2014) | 4 & 24 | Hematopoietic stem cells | The distribution of CpG sites that are hypo- and hypermethylated with age is similar in CG-islands, shores, and promoters. However, these sites are enriched in the shores and depleted in CG-islands. |
| Cole et al. (2017) | 2 & 22 | Liver | DMRs are most abundant in genes, introns, and enhancers and disproportionately enriched at genic super-enhancers in highly expressed genes involved in liver function. |
| Masser et al. (2017) | 3 & 24 | Hippocampus | Differential methylation for both CpG and CpH sites is enriched in intergenic and intronic regions and under-represented in promoters, CG islands and specific enhances in both male and female mice. |
| Hahn et al., 2017 | 5 & 27 | Liver | DMRs are strongly enriched for open chromatin histone marks. Enrichment was more pronounced for hypomethylated DMRs. Hypomethylated DMRs are also strongly enriched for distal and intragenic active enhances and active promoters. |
| Hadad et al. (2018) | 3 & 24 | Hippocampus | DMCGs were enriched in introns and shores and under-represented in CG-islands and shelves, exons, and promoters. The depletion of DMCGs is most pronounced in promoters containing CGIs. Enrichment of DMCGs was associated with both repressive and activation histone marks. |
Age for humans given in years and from mice in months. Abbreviations: PBMC = peripheral blood mononucleated cells; DMR = differentially methylated regions; DMGC = differentially methylated CpG sites. The methylation of these regions or CpG sites change (either increase or decrease) change significantly with increasing age.
Masser et al. (2017) compared the genomic distribution of CpG and CpH sites that were differentially methylated with age in the hippocampus of male and female mice. As noted in the previous section, over 95% changes in methylation at specific CpG or CpH sites that occurred with age were sex specific (Fig. 3). However, when the changes in DNA methylation are mapped to genomic regions, they observed similar genomic distribution of DMCGs and DMCHs for males and females. For example, differential methylation with age for both CpG and CpH sites were enriched in intergenic and intronic regions and under-represented in promoters, CG-islands and specific enhance regions in both sexes. Thus, age-related changes in DNA methylation were occurring in the same genomic regions for males and females even though the exact CpG/CpH sties that were altered with age were sex specific. These data suggest that certain genomic elements are labile with age inboth males and females even though the exact cytosines altered are sex-specific.
3.4. The relationship of the age-related changes in DNA methylation to changes in gene expression
The current data demonstrate that major changes in DNA methylation occur with age (Table 3); however, a major question is whether the age-related changes in DNA methylation have a functional significance. It is well accepted that DNA methylation is essential in mammalian development and promoter methylation tracks inversely with gene expression across genes or between tissues (Smith & Meissner, 2013). In the context of gene promoters, hypomethylated CpGs are generally associated with active, constitutively-expressed genes, while hypermethylated CpGs are associated with lowly expressed/silenced genes (Bird, 2002). It is not known whether this generalization will hold for changes in DNA methylation that occur with age. Currently, there is very little information on how the age-related changes in DNA methylation effect the transcriptome or function of a tissue or cell. There is evidence that some genes that are associated with aging are also regulated epigenetically. For example, POLG mutant mice display accelerated aging (Bailey et al., 2009). The POLG gene’s promoter is controlled by methylation (Tsai, Tyagi,& St John, 2018), and its methylation status has been observed to be influenced by factors such as inflammation (Maiuri, Li, Stein, Tennessen, & O’Hagan, 2018), which is known to increase with age (Franceschi & Campisi, 2014). Similarly, SOD3 mutants show premature aging (Kwon, Lee, Lee, Kim, & Kim, 2015), and this gene is epigenetically regulated by DNA methylation (Kamiya, Nakahara, Mori, Hara, & Adachi, 2017). CDKN2A (p16 ink4a/arf) is a cell-cycle inhibitor, and its expression is a well-established marker of aging (Krishnamurthy et al., 2004) and cellular senescence. Its expression is controlled by methylation and is often activated in various cancers (Matsuda, Ichida, Matsuzawa, Sugimura, & Asakura, 1999). BMAL1 is a circadian rhythm gene associated with cellular senescence (Khapre, Kondratova, Susova, & Kondratov, 2011) and is controlled epigenetically by both DNA methylation and histone modification (Sahar & Sassone-Corsi, 2013). Age-related changes in promoter and intragenic methylation of MHC1 genes, which are involved in immune function, have been observed to track with altered gene expression (Mangold et al., 2017).
Investigators are beginning to collect transcriptome data along with the DNA methylation profile to identify the genes whose expressions are potentially altered by DNA methylation, i.e., those changes in gene expression that are correlated to age-related changes in DNA methylation. Currently, there are two studies that have conducted a paired comparison of the changes in the transcriptome and methylome in humans. Steegenga et al. (2014) compared the changes they observed in CpG methylation to changes in gene expression in human peripheral blood mononucleated cells. Of the 470 probes that were highly methylated, 334 were associated with 168 genes that were downregulated and 136 probes were associated with 78 genes that were up-regulated. Similarly, 256 probes were found to be highly hypomethylated, out of which 130 were associated with 101 genes that were up-regulated and 126 probes associated with 95 genes that were down-regulated. Bysani et al. (2017) reported that the CpG sties that changed with age (~20 thousand) in liver were annotated to 6021 genes; 3852 of the genes harbored a significant number of CpG sites annotated to CpG islands. The expression of only 151 of these genes showed a significant correlation to DNA methylation, which was observed at 351 CpG sites. In other words, only ~2% of the CpG sites that changed with age were associated with a change in gene expression.
There have been three studies with mice comparing the age-related changes in DNA methylation to changes in the transcriptome. Using hematopoietic stem cells (HSCs) from 4-and 24-month-old mice, Sun et al. (2014) reported that of all the HSC specific genes analyzed 70% changed with age are were correlated to differential DNA methylation. Cole et al. (2017) evaluated the relationship between DMR’s (hypo- or hypermethylation) and gene expression in the livers of 2- and 22- month-old mice. Out of the 4444 genes (3901 of which harbored hypomethylated enhancers and 543 genes with hypermethylated promoters), 168 genes were up-regulated and 71 were down-regulated. Hahn et al. (2017) studied whether age-related DMRs (which showed significant enrichment in specific genes) were associated with age-related changes in gene expression in the livers of 5- and 27-month-old mice. Of the 403 genes that showed differential methylation with age in their promoters, b10% (39) showed a correlation to expression, and this correlation was not statistically significant. These findings point to a relationship between DNA methylation and gene expression, but one that is not as simple to as initially thought. It is also important to consider that most gene expression data collected above are from a single time point or condition. Gene expression is highly dynamic in response to feeding, circadian rthythms and other stimuli. Future studies will need to examine the relationship of DNA methylation to stimulus- responsive gene expression.
3.5. Summary
The current studies clearly demonstrate that aging has a major effect on DNA methylation. Almost all the studies to date have focused on methylation at CpG sites, and the studies suggest that ~2% of the CpG sites show changes in DNA methylation with age. Currently, there are only three reports that have studied the effect of aging on methylation at CpH sites, and these studies show that ~0.5% of the CpH sites analyzed change significantly with age. Thus, the current data indicate that the cytosines in the genome show changes in methylation with age, this translates into a change in large number of sites in the genome, e.g., ~800,000 CpG sites and over 2 million CpH sites.
Currently, there is interest in other DNA modifications that could play a role in epigenetic regulation. One modification that is gaining a great deal of interest is 5-hydoxymethyl cytosine (5hmC). In contrast to 5mC, which is found mostly at intragenic regions, 5hmC is found primarily in promoter regions (Jin, Wu, Li, & Pfeifer, 2011). The presence of 5hmC is generally associated with increased gene expression (Chen et al., 2012; Jin et al., 2011), which coincides with the co-localization of 5hmC to euchromatin (Kubiura, Okano, Kimura, Kawamura, & Tada, 2012; Mellen et al., 2012). Using immunostaining, Szulwach et al. (2011) quantified the total level of 5hmC in the brains of 6 week and 1 year old mice. They found a significant increase in 5hmC levels in the cerebellum but not the hippocampus. Contrary to this finding, Gontier et al. (2018) reported an age related decrease in 5hmC using dot blot analysis to measure 5hmC levels. The traditional bisulfite sequencing technology cannot differentiate between 5mC and 5hmC, therefore, all the studies described above represent a sum of 5mC and 5hmC. The levels of 5hmC have been reported to vary from tissue to tissue (Li & Liu, 2011), and it is generally assumed that this not a major problem because the levels of 5hmC in most tissues is much b5mC. In analyzing ten tissues from mice, we have found that 5hmC levels are b5% of 5mC levels in most tissues. However, 5hmC in brain makes up 20–25% of methylated cytosines (Fig. 4). It is now possibly to differentiate between 5mCs and 5hmCs at the nucleotide level by oxidative bisulfite sequencing where DNA is first oxidized with potassium perruthenate before bisulfite conversion. The oxidation step converts 5hmC to uracil, which results in a final sequence output of only 5mC (Masser et al., 2018). As Fig. 4 shows, the ability to differentiate 5mC and 5hmC can be important in interpreting DNA methylation data. Using oxidative bisulfite sequencing, Hadad et al. (2016) found no change in total levels of hippocampal 5hmC with aging in male or female mice. Because potential changes in 5hmC could be functionally important, especially in tissue from the central nervous system, future studies should analyze the effect of age on hydroxymethylation of DNA.
Fig. 4.
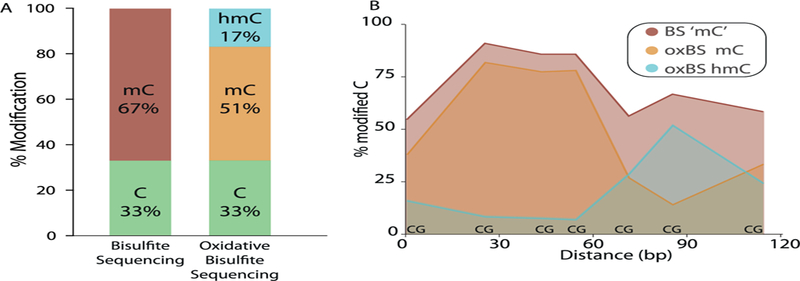
Comparison of methylation and hydroxymethylation of cytosines in hippocampus. Graph A. The 5mC and 5hmC levels in DNA from the hippocampus is shown when measured by the traditional bisulfite sequencing assay versus the oxidative bisulfite assay. Approximately 25% of the cytosines that would be classified as 5mC by the bisulfite assay are 5hmC residues. Graph B. The distribution of 5mC and 5hmC over a small region (~120 bp of Fkbp6) of the hippocampus genome. Data taken from Messer et al. (2018).
To determine if the age-related changes in methylation have functional consequences, investigators are pairing genome wide DNA methylation profiles to transcriptome data to identify genes whose expression changes with age and is correlated to changes in methylation. However, this analysis is difficult because methylation tends to affect regulatory interactions and is not a direct measurement (e.g., like transcription) of molecular species abundance. In addition, it is difficult to identify which methylation changes may affect long-range interactions (e.g., enhancers) with specific genes. Data from the current studies show that age-related changes in methylation can be correlated to some of the genes that show changes in expression with age. However, the simple relationship of increased expression correlating to hypomethylation and reduced expression correlating to hypermethylation does not appear to hold with aging. For example, several studies report that hypo- and hypermethylation were correlated with both increased and decreased expression of specific genes. However, it is not known if the changes in methylation that correlate to changes in expression are causative.
4. Effect of anti-aging interventions on DNA methylation
Manipulations that retard/delay aging are an essential tool in identifying the biological mechanism(s) or pathways involved in aging. By identifying the molecular process that are altered by these manipulations, investigators can begin to discover the molecular processes that are important in aging. Over the past two decades, a number of manipulations have been reported to increase the lifespan of mice (for review see Unnikrishnan et al., 2018). Currently, the most studied and robust anti-aging manipulations are caloric restriction (CR), dwarfism, and rapamycin treatment. These manipulations have been shown to increase lifespan by several laboratories, and the increase in lifespan is accompanied by improved physiological functions and reduced pathology. In other words, the mice appear younger and healthier than their littermate controls.
CR (also called dietary restriction) was the first and is the most studied anti-aging manipulation. In 1936, McCay, Crowell, & Maynard, 1989 showed that a severe restriction of food increased the lifespan of mice. Since this report, numerous laboratories have repeated McCay’s observation with a variety of strains of laboratory rats and mice. In addition, CR has been shown to increase the lifespan of invertebrates (yeast, Drosophila, and nematodes), dogs, and non-human primates (Unnikrishnan et al., 2018). Therefore, CR has become the “gold standard” by which all anti-aging interventions are compared. The lifespan of rodents is increased 20 to 25% when the caloric intake is reduced 30 to 50%. In 1996, Bartke’s laboratory published the first report showing that the lifespan of a mammal could be increased by a mutation in a specific gene (Brown-Borg, Borg, Meliska, & Bartke, 1996), Prof1 resulting in Ames dwarf mice. Subsequently, increased lifespan has been shown in other dwarf mouse models: Snell dwarf mice, which have a mutation in Pit 1 gene (Flurkey, Papaconstantinou, & Harrison, 2002), ‘little’ mice with a mutation in the Ghrhr(lit) gene (Flurkey, Papaconstantinou, Miller, & Harrison, 2001), and growth hormone receptor knockout mice (Coschigano et al., 2003). The lifespan of the dwarf mice is increased 20 to 50% over that of their control littermates (Unnikrishnan et al., 2018). More recently, Harrison et al. (2009) showed that lifespan could be increased pharmacologically by feeding mice rapamycin (commercially known as Sirolimus). Subsequently, there have been a large number of studies showing rapamycin increases the lifespan of various strains of mice and various disease models of mice (Richardson et al., 2015). A unique aspect of rapamycin is that rapamycin can increase lifespan even when implemented late in life (Bitto et al., 2016).
As described above, the epigenetic clocks developed by Petkovich et al. (2017) and Wang et al. (2017) showed that CR decelerated epigenetic aging in mice. Recently, four studies have been published that compared the effect of age on DNA methylation in tissues of rats and mice fed ad libitum or a CR-diet. These studies are described in Table 5. All four studies show that CR attenuated many of the age-related changes in CpG methylation. As shown in Fig. 5, Hadad et al. (2018) found that CR prevented ~35% of the age-related changes in CpG methylation in the hippocampus of mice. While CR prevented a similar percentage of the age-related changes in CpH methylation, the effect of CR on hypo- and hypermethylation differed for CpG and CpH sites (Fig. 5). CR attenuated hypo- and hypermethylation of CpG sites similarly; however, CR had a much greater effect (5-fold) on hypermethylated CpH sites than hypomethylated CpH sites. Hahn et al. (2018) reported that ~19% of the CpG sites that change with age in liver were prevented by CR. However, they found that CR had a greater effect on hypomethylated CpG sites than hypermethylated CpG sites (14% vs 4%). A recent report from Maegawa et al. (2017) also suggests that CR in Rhesus monkeys prevents age-related changes in DNA methylation.
Table 5.
List of studies investigating the effect of caloric restriction on DNA methylation.
| Reference | Animal | Sex | Method | Tissue | Length of CR* | Age Studied* | CpG Sites Studied | % Sites Altered by CR |
|---|---|---|---|---|---|---|---|---|
| Kim et al. (2016) | Rat (Sprague Dawley) | Male | MeDIP-Seq | Kidney | 1 | 25 | Unknown | Unknown |
| Cole et al. (2017) | Mice (UM-HET3) | Female | WGBS | Liver | 18 | 22 | ~42 million | ~3%** |
| Hahn et al. (2017) | mice (c3b6f1) | Female | BS-Seq | Liver | 24 | 27 | ~29 million | ~18% |
| Hadad et al. (2018) | Mice (C57BL/6) | Male | BOCS | Hippocampus | 21 | 24 | ~2 million | ~35% |
Given in months.
This percentage is based on differentially methylated regions and not specific CpG sites.
Fig. 5.
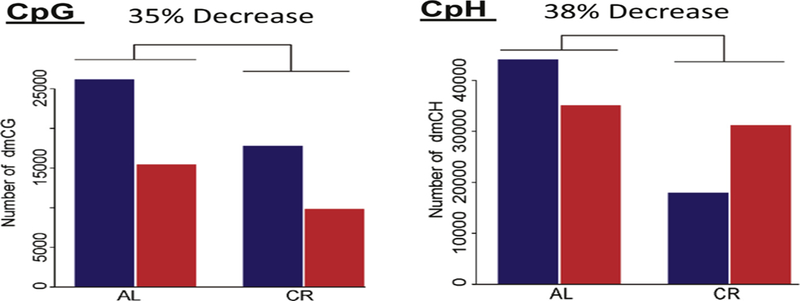
Effect of age and CR on DNA methylation. DNA was obtained from the hippocampus of 3- and 24-month-old mice fed ad libitum and 24-month-old mice fed a CR diet. The number of CpG and CpH sites that changed with age are shown: blue bars are sites that become hypermethylated and red bars are sites that become hypomethylated. The methylation of ~120 K Cs changed with age (~41 K CpGs and 80 K CpHs). CR reduced the number of sites that changed with age from 35 to 38%. For CpG sites, CR reduced hyper- and hypomethylated sites equally (32 to 36%). However, for CpH sites, CR had had a much greater effect on hypermethylated sites (59%) compared to hypomethylated sites (11%). Data taken from Hadad et al. (2018).
Cole et al. (2017) studied the effect of CR as well as dwarfism (Ames dwarf mice) and rapamycin treatment on DNA methylation in liver by identifying regions (500 bp) of the genome that were differentially methylated (DMRs) with age or the anti-aging manipulations. CR increased methylation in the age-associated hypomethylated DMRs (45% to 55%) and decreased methylation in the age-associated hypermethylated DMRs (62% to 58%) in the liver of female mice. Cole et al. (2017) also studied the effect of rapamycin treatment (42 ppm for 18 months) on DNA methylation in the liver of female mice. Similar to CR, rapamycin increased methylation in the hypomethylated DMRs but to a lesser extent (45% to 50%). However, rapamycin did not significantly alter the methylation of hypermethylated DMRs. Cole et al. (2017) also compared the age-related changes in CpG methylation in male Ames dwarf mice and wild type mice. Dwarf mice had 10-times more hypermethylated CpGs than the WT mice, which increased further with age, suggesting that the wild type and dwarf mice exhibit more epitype differences with age. In contrast, hypomethylated DMRs were 2-fold higher in wild type mice than the dwarf mice, but the the dwarf mice were more resistant to age-related hypomethylation. Thus, dwarf mice exhibited more stability against age-associated hypomethylation than hypermethylation. When Cole et al. (2017) compared the CpG sites that were differentially methylated with age, they found 3-times more CpG sites changed with age in wild type mice than dwarf mice, suggesting that the methylome of dwarf mice is more stable with age.
The emphasis of the studies on CR have focused on how CR attenuats the age-related changes in DNA methylation as a way to identify sites of methylation that potentially play an important role in aging. However, it is clear from the study by Hadad et al. (2018) that CR has a greater effect on the methylome than just altering the age-related changes in DNA methylation. As shown in Fig. 6, they found that 70% of the CpG sites that were differentially methylated in the hippocampus of old CR mice occurred at CpG sites that did not change with age. Hahn et al. (2017) reported that CR induced the methylation ~28 K CpG sites in liver that were independent of age; over 80% of these sites were hypermethylated. Cole et al. (2017) also observed that CR resulted in age-independent hypo- and hypermethylation (1301 hypomethylated and 3269 hypermethylated DMRs) in liver. Interestingly, they found that rapamycin induced substantially more age-independent changes in CpG methylation than CR.
Fig. 6.
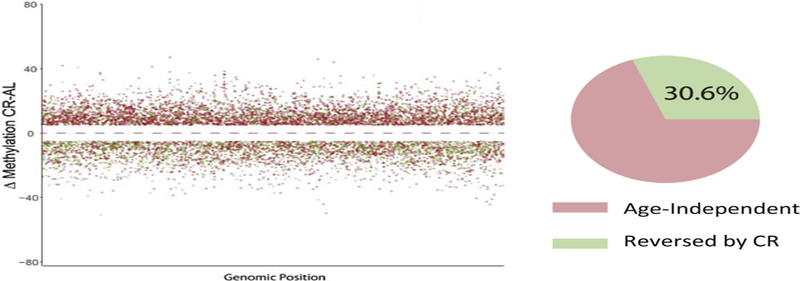
Effect of CR on DNA methylation. The CpG sites differentially methylated between old mice fed ad libitum and CR is shown. The CpG sites that change with age in the ad libitim fed mice that were prevented by CR are shown in green. The changes in methylation induced by CR that did not change with age in ad libitum fed mice are shown in red. Approximately 70% of the changes in DNA methylation induced by CR are age independent, i.e., do not occur with age in mice fed ad libitum. Data taken from Hadad et al. (2018).
Hadad et al. (2018) found that the genomic context of the CpG sites that changed with CR were markedly different from those CpG sites that changed with age. CR hypermethylated CpGs were over represented in CG-inlands and shores and under-represented in shelves. CR hypomethylated CpGs were only enriched in shores. In addition, they found that CR hypermethylated CpGs were associated with repressive histone marks and hypomethylated CpGs were over-represented in both activational and repressive marks. Cole et al. (2017) found that CR suppressed the age-associated changes in genes, enhancers, and CG-islands. Interestingly, rapamycin suppressed the age-related changes in CpG methylation in a smaller number of genes, enhancers, and CG-islands than CR, i.e., CR appeared to be more efficient than rapamycin in suppression of methylation in specific genomic regions. Hahn et al. (2017) found an enrichment of CR DMRs in the genes involved in the expression of fatty acid, triglyceride, and ketone body metabolism. When differential DNA methylation was correlated to differential gene expression, DNA methylation was significantly correlated negatively to the expression of 69 genes out of the 149 genes that showed differential methylation.
An important facet of CR that has been largely overlooked is that CR can have early effects and can create a cellular memory that persists even when CR is discontinued. For example, 4.5 months of CR early in life (Yu, Masoro, & McMahan, 1985) or CR pre-weaning (Sun, Sadighi Akha, Miller, & Harper, 2009) significantly increased the lifespan of rats and mice, respectively, when they were fed ad libitum for the reminder of their life. Thus, CR can have early effects on longevity that create a molecular memory, which persists even when CR is discontinued, suggesting that the life-extending action of CR might occur, at least partially, through an epigenetic mechanism, such as DNA methylation. Three studies show that short-term CR can induce changes to DNA methylation. Kim et al. (2016) reported that one month of CR in old (25 months of age) rats reversed methylation in kidney for ~17 thousand DMRs that changed significantly with age. The short-term CR had no effect on the methylation profile in different genomic contexts. Hahn et al. (2017) reported that 2 months of CR in young mice (5 months of age) induced ~50 thousand DMRs in liver. Interestingly, short-term CR resulted in significantly more DMRs in 5-month-old mice that long-term (18 months) CR. Unnikrishnan et al. (2017) showed that 1 month of CR in 4-month-old male mice induced significant changes in the expression of hundreds of genes across five tissues, and 20 to 50% of the changes in gene expression persisted 2 months after DR was discontinued, suggesting the possibility of epigenetic regulation of the expression of these genes. Unnikrishnan et al. (2017) then measured DNA methylation in the promoter regions of several genes whose expression was found to be significantly altered by CR and remained altered when CR was discontinued. Short-term CR was found to induce a significant decrease in methylation in each of the three CpG sites in the promoter of the Nts1 gene, and the hypomethylation of these sites persisted even when CR was discontinued and was correlated with increased Nts1 mRNA expression.
5. Conclusion
Epigenetic clocks, which measure the changes in the methylation of a few hundred CpG sites, accurately predict chronological age and are currently the best biomarkers for predicting mortality in humans. How-ever, it is uncertain as to how well epigenetic clocks can predict biological age. The discovery of epigenetic clocks has lead investigators to study the role DNA methylation plays in the molecular mechanism (s) underlying aging. Over the past five years, several laboratories have characterized the effect of aging on the methylation of specific cytosines throughout the genome. Most of these studies have focused on 5mCs at specific CpG sites and have shown that ~2% of the CpG sites change significantly with age. While both hypomethylation and hypomethylation occurs with age, the tendency is for more hypermethylation. Two studies have shown that ~0.5% of the CpH sites change with age. Therefore, it currently appears that only a small fraction of cytosines in the genome show changes in DNA methylation; however, these changes translate to 2 to 3 million cytosines. A crucial caveat to our current understanding is that the data have been collected at the tissue level. Tissues have heterogenous cell populations, and it is well established that different cell types have different epigenetic profiles. Therefore, a critical goal of the field should be to collect cell-type specific data when studying the effect of aging on DNA methylation.
The only study that has compared the effect of aging on DNA methylation in male and females found that N95% of the age-related changes in DNA methylation in the hippocampus were sex divergent (Masser et al., 2017), i.e., methylation did not differ between the males and females when they were young but age-related changes occurred in methylation at specific sites in one sex but not the other. This observation is surprising in that the epigenetic clocks work equally well in predicting chronological age in male and female humans and mice. Therefore, future studies should measure DNA methylation in both males and females as they age to determine if the sex divergence in DNA methylation is common and found in other tissues. In future studies, it will be important that the effect of age on the methylation of CpH sites as well CpG sites be measured because (1) age-related changes in the methylation of specific CpH sites have been reported, the total number of cytosines in CpH sites that can potentially become methylated are ~10-fold greater than CpG sites, and methylation at CpH sites has been associated with some cellular changes (He & Ecker, 2015). In addition, it will be important in the future that investigators also measure 5hmC because 5hmC is associated with changes in gene expression (Chen et al., 2012; Jin et al., 2011), and all the current studies reporting changes in 5mC at specific CpG or CpH sites are actually measuring both 5mC and 5hmC, i.e., one cannot determine if the changes in methylation are due to 5mC or 5hmC. While levels of 5hmC are minor in most tissues (e.g., b5% of 5mC levels), 5hmC in relatively high in some tissues, e.g., 5hmC makes up N20% of the methylated cytosines in brain (Fig. 4).
While the age-related changes in DNA methylation occur through-out the genome, these changes are enriched or under-represented in certain genomic contexts (e.g., promotors/gene bodies, GC-islands, shores, and shelves). However, there is currently no consensus as to what genomic contexts are more or less prone to change with age. Investigators have begun to pair genome wide DNA methylation profiles to transcriptome data to identify genes whose expression changes with age and is correlated to changes in methylation. Data from several studies show that hypo- and hypermethylation that occurs with aging in specific genes is correlated with both increased and decreased expression of some genes. Thus, the simple relationship of increased expression correlating to hypomethylation and reduced expression correlating to hypermethylation does not appear to hold with aging. However, it is not known if the changes in methylation that correlate to changes in expression are causative. Therefore, it will be important in the future to establish that the changes in gene expression are actually responsible for the changes in expression. Using genome editing technology, it may be possible to determine in the future if methylation at specific cytosines can directly alter the expression of a gene. For example, using CRISPR to drive fusion proteins with DNMTs or TETs to specific locations in the genome, it may be possible to alter methylation at specific sites and determine how these changes alter the transcriptome of the cell (Masser et al., 2018; Vojta et al., 2016).
Currently, the strongest data in support of DNA methylation playing a role in aging comes from studies that have evaluated the effect of anti- aging interventions on DNA methylation, especially CR. First, epigenetic aging is deaccelerated by CR, dwarfism, and rapamycin. Second, CR has been shown to attenuate many of the changes in CpG methylation that occurs with age. CR also induces changes in DNA methylation that are independent of age. Therefore, CR could have an impact on age by preventing change in DNA methylation that occur with age as well as inducing changes in DNA methylation that alters gene expression that have anti-aging affects. Third, CR may act through an epigenetic mechanism because it has been shown that CR has early effects and can create a cellular memory that persists even when CR is discontinued. For example, CR early in life can significantly increase the lifespan of rats (Yu et al., 1985) and mice (Sun et al., 2009) and improve glucose/insulin tolerance when CR is discontinued (Matyi et al., 2018). Several studies have shown CR for 1 to 2 months can induce changes in DNA methylation, and the changes in DNA methylation in a specific gene has been shown to persist after CR is discontinued.
In summary, the current data clearly demonstrate that major changes in DNA methylation occur with age. The major hurdle facing researchers is to determine which, if any, of these changes in DNA methylation are functionally important in the aging phenotype. In other words, do the changes in methylation play a role in the molecular and physiological changes that lead to aging?
Acknowledgments
The efforts of authors were supported by NIH grants R01AG045693 (AU and AR), the Oklahoma Center for Advancement of Science and Technology HR17–098 (AU), The Oklahoma Center for Adult Stem Cell Research (AR), the American Federation of Aging Research 17132 (AU), R01EY021716, R21EY024520 (WMF), a Senior Career Research Award (AR) and a Merit grant, I01BX003906 (WMF) from the Department of Veterans Affairs, the Oklahoma Center for Advancement of Science and Technology (HR14–174) (WMF), the Donald W. Reynolds Foundation (AR and WMF), and the Oklahoma Nathan Shock Aging Center (P30 AG050911).
Abbreviations:
- 5hmC
5-hyroxymethyl cytosine
- 5mC
5-methyl cytosine
- DNMT
DNA methyl transferase
- Tet
Ten eleven translocation
- WGBS
Whole Genome Bisulfite Sequencing
Footnotes
Conflict of interest
The authors declare no conflict of interest.
References
- Asdell SA, Doornenbal H, Joshi SR, & Sperling GA (1967). The effects of sex steroid hormones upon longevity in rats. Journal of Reproduction and Fertility 14(1), 113–120. [DOI] [PubMed] [Google Scholar]
- Bailey LJ, Cluett TJ, Reyes A, Prolla TA, Poulton J, Leeuwenburgh C, & Holt IJ (2009). Mice expressing an error-prone DNA polymerase in mitochondria display elevated replication pausing and chromosomal breakage at fragile sites of mitochondrial DNA. Nucleic Acids Research 37(7), 2327–2335. 10.1093/nar/gkp091. [DOI] [PMC free article] [PubMed] [Google Scholar]
- Bird A (2002). DNA methylation patterns and epigenetic memory. Genes & Development 16(1), 6–21. 10.1101/gad.947102. [DOI] [PubMed] [Google Scholar]
- Bitto A, Ito TK, Pineda VV, Letexier NJ, Huang HZ, Sutlief E, & Kaeberlein M (2016). Transient rapamycin treatment can increase lifespan and healthspan in middle-aged mice. eLife, 5 10.7554/eLife.16351. [DOI] [PMC free article] [PubMed] [Google Scholar]
- Bize P, Criscuolo F, Metcalfe NB, Nasir L, & Monaghan P (2009). Telomere dynamics rather than age predict life expectancy in the wild. Proceedings of the Biological Sciences 276(1662), 1679–1683. 10.1098/rspb.2008.1817. [DOI] [PMC free article] [PubMed] [Google Scholar]
- Bjornsson HT, Sigurdsson MI, Fallin MD, Irizarry RA, Aspelund T, Cui H, & Feinberg AP (2008). Intra-individual change over time in DNA methylation with familial clustering. JAMA 299(24), 2877–2883. 10.1001/jama.299.24.2877. [DOI] [PMC free article] [PubMed] [Google Scholar]
- Bocklandt S, Lin W, Sehl ME, Sanchez FJ, Sinsheimer JS, Horvath S, & Vilain E (2011). Epigenetic predictor of age. PLoS One 6(6), e14821 10.1371/journal.pone.0014821. [DOI] [PMC free article] [PubMed] [Google Scholar]
- Breiling A, & Lyko F (2015). Epigenetic regulatory functions of DNA modifications: 5- methylcytosine and beyond. Epigenetics & Chromatin 8, 24 10.1186/s13072-015-0016-6. [DOI] [PMC free article] [PubMed] [Google Scholar]
- Breitling LP, Saum KU, Perna L, Schottker B, Holleczek B, & Brenner H (2016). Frailty is associated with the epigenetic clock but not with telomere length in a German cohort. Clinical Epigenetics 8, 21 10.1186/s13148-016-0186-5. [DOI] [PMC free article] [PubMed] [Google Scholar]
- Brown-Borg HM, Borg KE, Meliska CJ, & Bartke A (1996). Dwarf mice and the ageing process. Nature 384(6604), 33 10.1038/384033a0. [DOI] [PubMed] [Google Scholar]
- Bysani M, Perfilyev A, de Mello VD, Ronn T, Nilsson E, Pihlajamaki J, & Ling C (2017). Epigenetic alterations in blood mirror age-associated DNA methylation and gene expression changes in human liver. Epigenomics 9(2), 105–122. 10.2217/epi-2016-0087. [DOI] [PubMed] [Google Scholar]
- Chen BH, Marioni RE, Colicino E, Peters MJ, Ward-Caviness CK, Tsai PC, & Horvath S (2016). DNA methylation-based measures of biological age: Meta-analysis predicting time to death. Aging (Albany NY) 8(9), 1844–1865. 10.18632/aging.101020. [DOI] [PMC free article] [PubMed] [Google Scholar]
- Chen H, Dzitoyeva S, & Manev H (2012). Effect of aging on 5-hydroxymethylcytosine in the mouse hippocampus. Restorative Neurology and Neuroscience 30(3), 237–245. 10.3233/RNN-2012-110223. [DOI] [PMC free article] [PubMed] [Google Scholar]
- Cheng Y, Bernstein A, Chen D, & Jin P (2015). 5-Hydroxymethylcytosine: A new player in brain disorders? Experimental Neurology 268, 3–9. 10.1016/j.expneurol.2014.05.008. [DOI] [PMC free article] [PubMed] [Google Scholar]
- Christensen BC, Houseman EA, Marsit CJ, Zheng S, Wrensch MR, Wiemels JL, & Kelsey KT (2009). Aging and environmental exposures alter tissue-specific DNA methylation dependent upon CpG island context. PLoS Genetics 5(8), e1000602 10.1371/journal.pgen.1000602. [DOI] [PMC free article] [PubMed] [Google Scholar]
- Clark SJ, Harrison J, Paul CL, & Frommer M (1994). High sensitivity mapping of methylated cytosines. Nucleic Acids Research 22(15), 2990–2997. [DOI] [PMC free article] [PubMed] [Google Scholar]
- Cole JJ, Robertson NA, Rather MI, Thomson JP, McBryan T, Sproul D, & Adams PD (2017). Diverse interventions that extend mouse lifespan suppress shared age-associated epigenetic changes at critical gene regulatory regions. Genome Biology 18 (1), 58 10.1186/s13059-017-1185-3. [DOI] [PMC free article] [PubMed] [Google Scholar]
- Coschigano KT, Holland AN, Riders ME, List EO, Flyvbjerg A, & Kopchick JJ (2003). Deletion, but not antagonism, of the mouse growth hormone receptor results in severely decreased body weights, insulin, and insulin-like growth factor I levels and increased life span. Endocrinology 144(9), 3799–3810. 10.1210/en.2003-0374. [DOI] [PubMed] [Google Scholar]
- Day K, Waite LL, Thalacker-Mercer A, West A, Bamman MM, Brooks JD, & Absher D (2013). Differential DNA methylation with age displays both common and dynamic features across human tissues that are influenced by CpG landscape. Genome Biology 14(9), R102 10.1186/gb-2013-14-9-r102. [DOI] [PMC free article] [PubMed] [Google Scholar]
- Flurkey K, Papaconstantinou J, & Harrison DE (2002). The Snell dwarf mutation Pit1 (dw) can increase life span in mice. Mechanisms of Ageing and Development 123 (2–3), 121–130. [DOI] [PubMed] [Google Scholar]
- Flurkey K, Papaconstantinou J, Miller RA, & Harrison DE (2001). Lifespan extension and delayed immune and collagen aging in mutant mice with defects in growth hormone production. Proceedings of the National Academy of Sciences of the United States of America 98(12), 6736–6741. 10.1073/pnas.111158898. [DOI] [PMC free article] [PubMed] [Google Scholar]
- Franceschi C, & Campisi J (2014). Chronic inflammation (inflammaging) and its potential contribution to age-associated diseases. The Journals of Gerontology. Series A, Biological Sciences and Medical Sciences 69(Suppl. 1), S4–S9. 10.1093/gerona/glu057. [DOI] [PubMed] [Google Scholar]
- Frobel J, Rahmig S, Franzen J, Waskow C, & Wagner W (2018)). Epigenetic aging of human hematopoietic cells is not accelerated upon transplantation into mice. Clin Epigenetics 10, 67 PMID: . [DOI] [PMC free article] [PubMed] [Google Scholar]
- Frommer M, McDonald LE, Millar DS, Collis CM, Watt F, Grigg GW, & Paul CL (1992). A genomic sequencing protocol that yields a positive display of 5- methylcytosine residues in individual DNA strands. Proceedings of the National Academy of Sciences of the United States of America 89(5), 1827–1831. [DOI] [PMC free article] [PubMed] [Google Scholar]
- Gontier G, Iyer M, Shea JM, Bieri G, Wheatley EG, Ramalho-Santos M, & Villeda SA (2018). Tet2 Rescues Age-Related Regenerative Decline and Enhances Cognitive Function in the Adult Mouse Brain. Cell Reports 22(8), 1974–1981. 10.1016/j.celrep.2018.02.001. [DOI] [PMC free article] [PubMed] [Google Scholar]
- Grant CD, Jafari N, Hou L, Li Y, Stewart JD, Zhang G, & Conneely KN (2017). A longitudinal study of DNA methylation as a potential mediator of age-related diabetes risk. Geroscience 39(5–6), 475–489. 10.1007/s11357-017-0001-z. [DOI] [PMC free article] [PubMed] [Google Scholar]
- Groth A, Rocha W, Verreault A, & Almouzni G (2007). Chromatin challenges during DNA replication and repair. Cell 128(4), 721–733. 10.1016/j.cell.2007.01.030. [DOI] [PubMed] [Google Scholar]
- Guo JU, Su Y, Zhong C, Ming GL, & Song H (2011). Emerging roles of TET proteins and 5-hydroxymethylcytosines in active DNA demethylation and beyond. Cell Cycle 10(16), 2662–2668. 16.17093. [DOI] [PMC free article] [PubMed] [Google Scholar]
- Hadad N, Masser DR, Logan S, Wronowski B, Mangold CA, Clark N, & Freeman W (2016). Absence of genomic hypomethylation or regulation of cytosine-modifying enzymes with aging in male and female mice. Epigenetics & Chromatin 9, 30 10.1186/s13072-016-0080-6. [DOI] [PMC free article] [PubMed] [Google Scholar]
- Hadad N, Unnikrishnan A, Jackson JA, Masser DR, Otalora L, Stanford DR, & Freeman WM (2018). Caloric restriction mitigates age-associated hippocampal differential CG and non-CG methylation. Neurobiology of Aging 67, 53–66. 10.1016/j.neurobiolaging.2018.03.009. [DOI] [PMC free article] [PubMed] [Google Scholar]
- Hahn O, Gronke S, Stubbs TM, Ficz G, Hendrich O, Krueger F, & Partridge L (2017). Dietary restriction protects from age-associated DNA methylation and induces epigenetic reprogramming of lipid metabolism. Genome Biology 18(1), 56 10.1186/s13059-017-1187-1. [DOI] [PMC free article] [PubMed] [Google Scholar]
- Hannum G, Guinney J, Zhao L, Zhang L, Hughes G, Sadda S, & Zhang K (2013). Genome-wide methylation profiles reveal quantitative views of human aging rates. Molecular Cell 49(2), 359–367. 10.1016/j.molcel.2012.10.016. [DOI] [PMC free article] [PubMed] [Google Scholar]
- Harrison DE, et al. (2009). Rapamycin fed late in life extends lifespan in genetically heterogeneousmice. Nature 460(7253), 392–395. [DOI] [PMC free article] [PubMed] [Google Scholar]
- He Y, & Ecker JR (2015). Non-CG Methylation in the Human Genome. Annual Review of Genomics and Human Genetics 16, 55–77. 10.1146/annurev-genom-090413-025437. [DOI] [PMC free article] [PubMed] [Google Scholar]
- Horvath S (2013). DNA methylation age of human tissues and cell types. Genome Biology 14(10), R115 10.1186/gb-2013-14-10-r115. [DOI] [PMC free article] [PubMed] [Google Scholar]
- Horvath S, Erhart W, Brosch M, Ammerpohl O, von Schonfels W, Ahrens M, & Hampe J (2014). Obesity accelerates epigenetic aging of human liver. Proceedings of the National Academy of Sciences of the United States of America 111(43), 15538–15543. 10.1073/pnas.1412759111. [DOI] [PMC free article] [PubMed] [Google Scholar]
- Horvath S, & Levine AJ (2015). HIV-1 Infection Accelerates Age according to the Epigenetic Clock. The Journal of Infectious Diseases 212(10), 1563–1573. 10.1093/infdis/jiv277. [DOI] [PMC free article] [PubMed] [Google Scholar]
- Horvath S, & Raj K (2018). DNA methylation-based biomarkers and the epigenetic clock theory of ageing. Nature Reviews. Genetics 19(6), 371–384. 10.1038/s41576-018-0004-3. [DOI] [PubMed] [Google Scholar]
- Iqbal K, Jin SG, Pfeifer GP, & Szabo PE (2011). Reprogramming of the paternal genome upon fertilization involves genome-wide oxidation of 5-methylcytosine. Proceedings of the National Academy of Sciences of the United States of America 108 (9), 3642–3647. 10.1073/pnas.1014033108. [DOI] [PMC free article] [PubMed] [Google Scholar]
- Ito H, Udono T, Hirata S, & Inoue-Murayama M (2018). Estimation of chimpanzee age based on DNA methylation. Scientific Reports 8(1), 9998 10.1038/s41598-018-28318-9. [DOI] [PMC free article] [PubMed] [Google Scholar]
- Ito S, D’Alessio AC, Taranova OV, Hong K, Sowers LC, & Zhang Y (2010). Role of Tet proteins in 5mC to 5hmC conversion, ES-cell self-renewal and inner cell mass specification. Nature 466(7310), 1129–1133. 10.1038/nature09303. [DOI] [PMC free article] [PubMed] [Google Scholar]
- Iwasa T, Matsuzaki T, Yano K, & Irahara M (2017)). The effects of ovariectomy and lifelong high-fat diet consumption on body weight, appetite, and lifespan in female rats. Hoem Behav. Jan 97, 25–30 PMID: . [DOI] [PubMed] [Google Scholar]
- Jin SG, Wu X, Li AX, & Pfeifer GP (2011). Genomic mapping of 5- hydroxymethylcytosine in the human brain. Nucleic Acids Research 39(12), 5015–5024. 10.1093/nar/gkr120. [DOI] [PMC free article] [PubMed] [Google Scholar]
- Johnson AA, Akman K, Calimport SR, Wuttke D, Stolzing A, & de Magalhaes JP (2012). The role of DNA methylation in aging, rejuvenation, and age-related disease. Rejuvenation Research 15(5), 483–494. 10.1089/rej.2012.1324. [DOI] [PMC free article] [PubMed] [Google Scholar]
- Jung M, & Pfeifer GP (2015). Aging and DNA methylation. BMC Biology 13, 7 doi.org/10.1186/s12915–015-0118–4. [DOI] [PMC free article] [PubMed] [Google Scholar]
- Kamiya T, Nakahara R, Mori N, Hara H, & Adachi T (2017). Ten-eleven translocation 1 functions as a mediator of SOD3 expression in human lung cancer A549 cells. Free Radical Research 51(3), 329–336. 10.1080/10715762.2017.1313415. [DOI] [PubMed] [Google Scholar]
- Khapre RV, Kondratova AA, Susova O, & Kondratov RV (2011). Circadian clock protein BMAL1 regulates cellular senescence in vivo. Cell Cycle 10(23), 4162–4169. 10.4161/cc.10.23.18381. [DOI] [PMC free article] [PubMed] [Google Scholar]
- Khare T, Pai S, Koncevicius K, Pal M, Kriukiene E, Liutkeviciute Z, & Petronis A (2012). 5-hmC in the brain is abundant in synaptic genes and shows differences at the exon-intron boundary. Nature Structural & Molecular Biology 19(10), 1037–1043. 10.1038/nsmb.2372. [DOI] [PMC free article] [PubMed] [Google Scholar]
- Kim CH, Lee EK, Choi YJ, An HJ, Jeong HO, Park D, & Chung HY (2016). Shortterm calorie restriction ameliorates genomewide, age-related alterations in DNA methylation. Aging Cell 10.1111/acel.12513. [DOI] [PMC free article] [PubMed]
- Kim S, Myers L, Wyckoff J, Cherry KE, & Jazwinski SM (2017). The frailty index out-performs DNA methylation age and its derivatives as an indicator of biological age. Geroscience 39(1), 83–92. 10.1007/s11357-017-9960-3. [DOI] [PMC free article] [PubMed] [Google Scholar]
- Krishnamurthy J, Torrice C, Ramsey MR, Kovalev GI, Al-Regaiey K, Su L, & Sharpless NE (2004). Ink4a/Arf expression is a biomarker of aging. The Journal of Clinical Investigation 114(9), 1299–1307. 10.1172/JCI22475. [DOI] [PMC free article] [PubMed] [Google Scholar]
- Kubiura M, Okano M, Kimura H, Kawamura F, & Tada M (2012). Chromosome-wide regulation of euchromatin-specific 5mC to 5hmC conversion in mouse ES cells and female human somatic cells. Chromosome Research 20(7), 837–848. 10.1007/s10577-012-9317-9. [DOI] [PMC free article] [PubMed] [Google Scholar]
- Kwon MJ, Lee KY, Lee HW, Kim JH, & Kim TY (2015). SOD3 Variant, R213G, Altered SOD3 Function, Leading to ROS-Mediated Inflammation and damage in Multiple Organs of Premature Aging mice. Antioxidants & Redox Signaling 23(12), 985–999. 10.1089/ars.2014.6035.< [DOI] [PubMed] [Google Scholar]
- Levine ME, Lu AT, Chen BH, Hernandez DG, Singleton AB, Ferrucci L, & Horvath S (2016). Menopause accelerates biological aging. Proceedings of the National Academy of Sciences of the UniSted States of America 113(33), 9327–9332. 10.1073/pnas.1604558113. [DOI] [PMC free article] [PubMed] [Google Scholar]
- Levine ME, Lu AT, Quach A, Chen BH, Assimes TL, Bandinelli S, & Horvath S (2018). An epigenetic biomarker of aging for lifespan and healthspan. Aging (Albany NY) 10(4), 573–591. 10.18632/aging.101414. [DOI] [PMC free article] [PubMed] [Google Scholar]
- Li E, Bestor TH, & Jaenisch R (1992). Targeted mutation of the DNA methyltransferase gene results in embryonic lethality. Cell 69(6), 915–926. [DOI] [PubMed] [Google Scholar]
- Li W, & Liu M (2011). Distribution of 5-hydroxymethylcytosine in different human tissues. Journal of Nucleic Acids 2011, 870726 10.4061/2011/870726. [DOI] [PMC free article] [PubMed] [Google Scholar]
- Lim DHK, & Maher ER (2010). DNA Methylation: a form of epigenetic control of gene expression. The Obstetrician & Gynaecologist 12, 37–42. [Google Scholar]
- Maegawa S, Lu Y, Tahara T, Lee JT, Madzo J, Liang S, & Issa JJ (2017). Caloric restriction delays age-related methylation drift. Nature Communications 8(1), 539 10.1038/s41467-017-00607-3. [DOI] [PMC free article] [PubMed] [Google Scholar]
- Maierhofer A, Flunkert J, Oshima J, Martin GM, Haaf T, & Horvath S (2017). Accelerated epigenetic aging in Werner syndrome. Aging (Albany NY) 9(4), 1143–1152. 10.18632/aging.101217. [DOI] [PMC free article] [PubMed] [Google Scholar]
- Maiuri AR, Li H, Stein BD, Tennessen JM, & O’Hagan HM (2018). Inflammation-induced DNA methylation of DNA polymerase gamma alters the metabolic profile of colon tumors. Cancer Metab 6, 9 10.1186/s40170-018-0182-7. [DOI] [PMC free article] [PubMed] [Google Scholar]
- Mangold CA, Wronowski B, Du M, Masser DR, Hadad N, Bixler GV, & Freeman WM (2017). Sexually divergent induction of microglial-associated neuroinflammation with hippocampal aging. Journal of Neuroinflammation 14(1), 141 10.1186/s12974-017-0920-8. [DOI] [PMC free article] [PubMed] [Google Scholar]
- Marchal C, & Miotto B (2015). Emerging concept in DNA methylation: Role of transcription factors in shaping DNA methylation patterns. Journal of Cellular Physiology 230 (4), 743–751. 10.1002/jcp.24836. [DOI] [PubMed] [Google Scholar]
- Marioni RE, Suderman M, Chen BH, Horvath S, Bandinelli S, Morris T, & Hagg S (2018). Tracking the Epigenetic Clock across the Human Life Course: A Meta- analysis of Longitudinal Cohort Data. The Journals of Gerontology. Series A, Biological Sciences and Medical Sciences 10.1093/gerona/gly060. [DOI] [PMC free article] [PubMed]
- Martin GM (2005). Epigenetic drift in aging identical twins. Proceedings of the National Academy of Sciences of the United States of America 102(30), 10413–10414. 10.1073/pnas.0504743102. [DOI] [PMC free article] [PubMed] [Google Scholar]
- Martin GM (2009). Epigenetic gambling and epigenetic drift as an antagonistic pleiotropic mechanism of aging. Aging Cell 8(6), 761–764. 10.1111/j.1474-9726.2009.00515.x. [DOI] [PubMed] [Google Scholar]
- Martin-Montalvo A, Mercken EM, Mitchell SJ, Palacios HH, Mote PL, Scheibye-Knudsen M, & de Cabo R (2013). Metformin improves healthspan and lifespan in mice. Nature Communications 4, 2192 10.1038/ncomms3192. [DOI] [PMC free article] [PubMed] [Google Scholar]
- Masser DR, Hadad N, Porter H, Stout MB, Unnikrishnan A, Stanford DR, & Freeman WM (2018). Analysis of DNA modifications in aging research. Geroscience 40(1), 11–29. 10.1007/s11357-018-0005-3. [DOI] [PMC free article] [PubMed] [Google Scholar]
- Masser DR, Hadad N, Porter HL, Mangold CA, Unnikrishnan A, Ford MM, & Freeman WM (2017). Sexually divergent DNA methylation patterns with hippocampal aging. Aging Cell 16(6), 1342–1352. 10.1111/acel.12681. [DOI] [PMC free article] [PubMed] [Google Scholar]
- Matsuda Y, Ichida T, Matsuzawa J, Sugimura K, & Asakura H (1999). p16(INK4) is inactivated by extensive CpG methylation in human hepatocellular carcinoma. Gastroenterology 116(2), 394–400. [DOI] [PubMed] [Google Scholar]
- Matyi S, Jackson J, Garrett K, Deepa SS, & Unnikrishnan A (2018). The effect of different levels of dietary restriction on glucose homeostasis and metabolic memory. Geroscience 40(2), 139–149. 10.1007/s11357-018-0011-5. [DOI] [PMC free article] [PubMed] [Google Scholar]
- McCarthy MM, Arnold AP, Ball GF, Blaustein JD, & De Vries GJ (2012). Sex differences in the brain: The not so inconvenient truth. The Journal of Neuroscience 32 (7), 2241–2247. 10.1523/JNEUROSCI.5372-11.2012. [DOI] [PMC free article] [PubMed] [Google Scholar]
- McCay CM, Crowell MF, & Maynard LA (1989). The effect of retarded growth upon the length of life span and upon the ultimate body size. 1935. Nutrition 5(3), 155–171 (discussion 172). [PubMed] [Google Scholar]
- Mellen M, Ayata P, Dewell S, Kriaucionis S, & Heintz N (2012). MeCP2 binds to 5hmC enriched within active genes and accessible chromatin in the nervous system. Cell 151(7), 1417–1430. 10.1016/j.cell.2012.11.022. [DOI] [PMC free article] [PubMed] [Google Scholar]
- Nevalainen T, Kananen L, Marttila S, Jylhava J, Mononen N, Kahonen M, & Hurme M (2017). Obesity accelerates epigenetic aging in middle-aged but not in elderly individuals. Clinical Epigenetics 9, 20 10.1186/s13148-016-0301-7. [DOI] [PMC free article] [PubMed] [Google Scholar]
- Okano M, Bell DW, Haber DA, & Li E (1999). DNA methyltransferases Dnmt3a and Dnmt3b are essential for de novo methylation and mammalian development. Cell 99 (3), 247–257. [DOI] [PubMed] [Google Scholar]
- Pastor WA, Aravind L, & Rao A (2013). TETonic shift: Biological roles of TET proteins in DNA demethylation and transcription. Nature Reviews. Molecular Cell Biology 14(6), 341–356. 10.1038/nrm3589. [DOI] [PMC free article] [PubMed] [Google Scholar]
- Perna L, Zhang Y, Mons U, Holleczek B, Saum KU, & Brenner H (2016). Epigenetic age acceleration predicts cancer, cardiovascular, and all-cause mortality in a German case cohort. Clinical Epigenetics 8, 64 10.1186/s13148-016-0228-z. [DOI] [PMC free article] [PubMed] [Google Scholar]
- Petkovich DA, Podolskiy DI, Lobanov AV, Lee SG, Miller RA, & Gladyshev VN (2017). Using DNA Methylation Profiling to Evaluate Biological Age and Longevity Interventions. Cell Metabolism 25(4), 954–960 e956 10.1016/j.cmet.2017.03.016. [DOI] [PMC free article] [PubMed] [Google Scholar]
- Raddatz G, Hagemann S, Aran D, Sohle J, Kulkarni PP, Kaderali L, & Lyko F (2013). Aging is associated with highly defined epigenetic changes in the human epidermis. Epigenetics & Chromatin 6(1), 36 10.1186/1756-8935-6-36. [DOI] [PMC free article] [PubMed] [Google Scholar]
- Rauch T, & Pfeifer GP (2005). Methylated-CpG island recovery assay: A new technique for the rapid detection of methylated-CpG islands in cancer. Laboratory Investigation 85(9), 1172–1180. 10.1038/labinvest.3700311. [DOI] [PubMed] [Google Scholar]
- Richardson A, Galvan V, Lin AL, & Oddo S (2015). How longevity research can lead to therapies for Alzheimer’s disease: The rapamycin story. Experimental Gerontology 68, 51–58. 10.1016/j.exger.2014.12.002. [DOI] [PMC free article] [PubMed] [Google Scholar]
- Sahar S, & Sassone-Corsi P (2013). The epigenetic language of circadian clocks. Handbook of Experimental Pharmacology(217), 29–44. 10.1007/978-3-642-25950-0_2. [DOI] [PubMed] [Google Scholar]
- Sillanpaa E, Laakkonen EK, Vaara E, Rantanen T, Kovanen V, Sipila S, & Ollikainen M (2018). Biological clocks and physical functioning in monozygotic female twins. BMC Geriatrics 18(1), 83 10.1186/s12877-018-0775-6. [DOI] [PMC free article] [PubMed] [Google Scholar]
- Simpkin AJ, Suderman M, & Howe LD (2017). Epigenetic clocks for gestational age: Statistical and study design considerations. Clinical Epigenetics 9, 100 10.1186/s13148-017-0402-y. [DOI] [PMC free article] [PubMed] [Google Scholar]
- Smith ZD, & Meissner A (2013). DNA methylation: Roles in mammalian development. Nature Reviews. Genetics 14(3), 204–220. 10.1038/nrg3354. [DOI] [PubMed] [Google Scholar]
- Starnawska A, Tan Q, McGue M, Mors O, Borglum AD, Christensen K, & Christiansen L (2017). Epigenome-Wide Association Study of Cognitive Functioning in Middle-Aged Monozygotic Twins. Frontiers in Aging Neuroscience 9, 413 doi.org/10.3389/fnagi.2017.00413. [DOI] [PMC free article] [PubMed] [Google Scholar]
- Steegenga WT, Boekschoten MV, Lute C, Hooiveld GJ, de Groot PJ, Morris TJ, & Muller M (2014). Genome-wide age-related changes in DNA methylation and gene expression in human PBMCs. Age (Dordrecht, Netherlands) 36(3), 9648 10.1007/s11357-014-9648-x. [DOI] [PMC free article] [PubMed] [Google Scholar]
- Stubbs TM, Bonder MJ, Stark AK, Krueger F, Team BIAC, von Meyenn F, & Reik W (2017). Multitissue DNA methylation age predictor in mouse. Genome Biology 18 (1), 68 10.1186/s13059-017-1203-5. [DOI] [PMC free article] [PubMed] [Google Scholar]
- Sun D, Luo M, Jeong M, Rodriguez B, Xia Z, Hannah R, & Goodell MA (2014). Epigenomic profiling of young and aged HSCs reveals concerted changes during aging that reinforce self-renewal. Cell Stem Cell 14(5), 673–688. 10.1016/j.stem.2014.03.002. [DOI] [PMC free article] [PubMed] [Google Scholar]
- Sun L, Sadighi Akha AA, Miller RA, & Harper JM (2009). Life-span extension in mice by preweaning food restriction and by methionine restriction in middle age. The Journals of Gerontology. Series A, Biological Sciences and Medical Sciences 64(7), 711–722. 10.1093/gerona/glp051. [DOI] [PMC free article] [PubMed] [Google Scholar]
- Szulwach KE, Li X, Li Y, Song CX, Wu H, Dai Q, & Jin P (2011). 5-hmC-mediated epigenetic dynamics during postnatal neurodevelopment and aging. Nature Neuroscience 14(12), 1607–1616. 10.1038/nn.2959. [DOI] [PMC free article] [PubMed] [Google Scholar]
- Tan L, & Shi YG (2012). Tet family proteins and 5-hydroxymethylcytosine in development and disease. Development 139(11), 1895–1902. 10.1242/dev.070771. [DOI] [PMC free article] [PubMed] [Google Scholar]
- Teschendorff AE, Menon U, Gentry-Maharaj A, Ramus SJ, Weisenberger DJ, Shen H, & Widschwendter M (2010). Age-dependent DNA methylation of genes that are suppressed in stem cells is a hallmark of cancer. Genome Research 20(4), 440–446. 10.1101/gr.103606.109. [DOI] [PMC free article] [PubMed] [Google Scholar]
- Thompson MJ, Vonholdt B, Horvath S, & Pellegrini M (2017). An epigenetic aging clock for dogs and wolves. Aging (Albany NY) 9(3), 1055–1068. 10.18632/aging.101211. [DOI] [PMC free article] [PubMed] [Google Scholar]
- Tsai TS, Tyagi S, & St John JC (2018). The molecular characterisation of mitochondrial DNA deficient oocytes using a pig model. Human Reproduction 33(5), 942–953. 10.1093/humrep/dey052. [DOI] [PubMed] [Google Scholar]
- Unnikrishnan A, Hadad N, Masser DR, Jackson J, Freeman WM, & Richardson A (2018). Revisiting the genomic hypomethylation hypothesis of aging. Annals of the New York Academy of Sciences 1418(1), 69–79. 10.1111/nyas.13533. [DOI] [PMC free article] [PubMed] [Google Scholar]
- Unnikrishnan A, Jackson J, Matyi SA, Hadad N, Wronowski B, Georgescu C, & Richardson A (2017). Role of DNA methylation in the dietary restriction mediated cellular memory. Geroscience 39(3), 331–345. 10.1007/s11357-017-9976-8. [DOI] [PMC free article] [PubMed] [Google Scholar]
- Vijg J, Gravina S, & Dong X (2018). Chapter 9 - Intratissue DNA Methylation Heterogeneity in Aging. In Moskalev A, & Vaiserman AM (Eds.), Epigenetics of Aging and Longevity. Vol. 4 (pp. 201–209). Boston: Academic Press. [Google Scholar]
- Vojta A, Dobrinic P, Tadic V, Bockor L, Korac P, Julg B, & Zoldos V (2016). Repurposing the CRISPR-Cas9 system for targeted DNA methylation. Nucleic Acids Research 44(12), 5615–5628. 10.1093/nar/gkw159. [DOI] [PMC free article] [PubMed] [Google Scholar]
- Walker RF, Liu JS, Peters BA, Ritz BR, Wu T, Ophoff RA, & Horvath S (2015). Epigenetic age analysis of children who seem to evade aging. Aging (Albany NY) 7 (5), 334–339. 10.18632/aging.100744. [DOI] [PMC free article] [PubMed] [Google Scholar]
- Wang T, Tsui B, Kreisberg JF, Robertson NA, Gross AM, Yu MK, & Ideker T (2017). Epigenetic aging signatures in mice livers are slowed by dwarfism, calorie restriction and rapamycin treatment. Genome Biology 18(1), 57 10.1186/s13059-017-1186-2. [DOI] [PMC free article] [PubMed] [Google Scholar]
- Weber M, Davies JJ, Wittig D, Oakeley EJ, Haase M, Lam WL, & Schubeler D (2005). Chromosome-wide and promoter-specific analyses identify sites of differential DNA methylation in normal and transformed human cells. Nature Genetics 37(8), 853–862. 10.1038/ng1598. [DOI] [PubMed] [Google Scholar]
- Weidner CI, Lin Q, Koch CM, Eisele L, Beier F, Ziegler P, & Wagner W (2014). Aging of blood can be tracked by DNA methylation changes at just three CpG sites. Genome Biology 15(2), R24 10.1186/gb-2014-15-2-r24. [DOI] [PMC free article] [PubMed] [Google Scholar]
- Wilson VL, Smith RA, Ma S, & Cutler RG (1987). Genomic 5-methyldeoxycytidine decreases with age. The Journal of Biological Chemistry 262(21), 9948–9951. [PubMed] [Google Scholar]
- Wion D, & Casadesus J (2006). N6-methyl-adenine: An epigenetic signal for DNA-protein interactions. Nature Reviews. Microbiology 4(3), 183–192. 10.1038/nrmicro1350. [DOI] [PMC free article] [PubMed] [Google Scholar]
- Wossidlo M, Nakamura T, Lepikhov K, Marques CJ, Zakhartchenko V, Boiani M, & Walter J (2011). 5-Hydroxymethylcytosine in the mammalian zygote is linked with epigenetic reprogramming. Nature Communications 2, 241 10.1038/ncomms1240. [DOI] [PubMed] [Google Scholar]
- Xiao CL, Zhu S, He M, Chen, Zhang Q, Chen Y, & Yan GR (2018). N(6)-Methyladenine DNA Modification in the Human Genome. Molecular Cell 71(2), 306 10.1016/j.molcel.2018.06.015. [DOI] [PubMed] [Google Scholar]
- Yu BP, Masoro EJ, & McMahan CA (1985). Nutritional influences on aging of Fischer 344 rats: I. Physical, metabolic, and longevity characteristics. Journal of Gerontology 40 (6), 657–670. [DOI] [PubMed] [Google Scholar]
- Zampieri M, Ciccarone F, Calabrese R, Franceschi C, Burkle A, & Caiafa P (2015). Reconfiguration of DNA methylation in aging. Mechanisms of Ageing and Development 151, 60–70. 10.1016/j.mad.2015.02.002. [DOI] [PubMed] [Google Scholar]
- Zhang Q, Liu X, Gao W, Li P, Hou J, Li J, & Wong J (2014). Differential regulation of the ten-eleven translocation (TET) family of dioxygenases by O-linked beta-N-acetylglucosamine transferase (OGT). The Journal of Biological Chemistry 289(9), 5986–5996. 10.1074/jbc.M113.524140. [DOI] [PMC free article] [PubMed] [Google Scholar]
- Zs-Nagy I, Cutler RG, & Semsei I (1988). Dysdifferentiation hypothesis of aging and cancer: A comparison with the membrane hypothesis of aging. Annals of the New York Academy of Sciences 521, 215–225. [DOI] [PubMed] [Google Scholar]