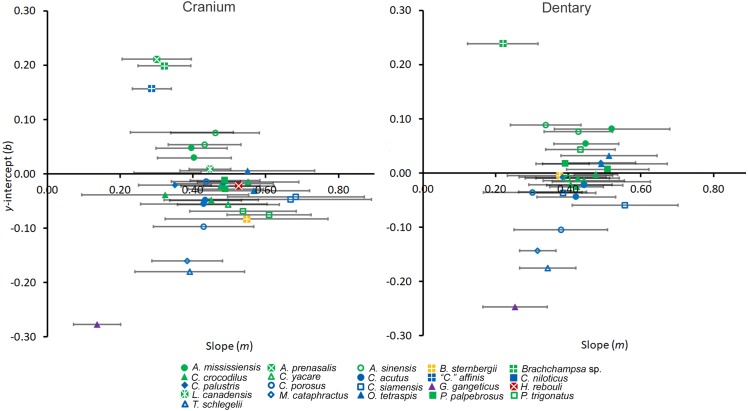
Figure 6. Regression information for shape heterodonty.
Slope (m) and y-intercept (b) data for regressions of the first principal component plotted against tooth position for individuals. Error bars indicate 95% confidence intervals, and colors and shapes represent species. Regression statistics are available in Table S2.

