

SUMMARY
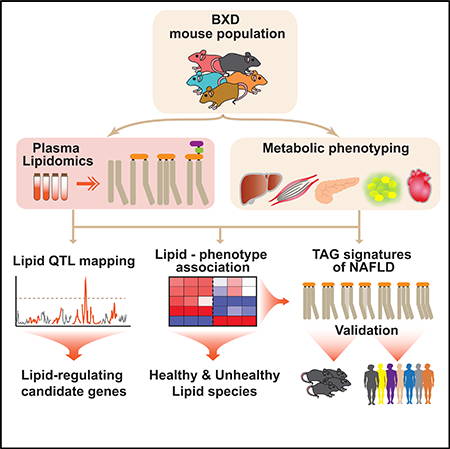
The genetic regulation and physiological impact of most lipid species are unexplored. Here, we profiled 129 plasma lipid species across 49 strains of the BXD mouse genetic reference population fed either chow or a high-fat diet. By integrating these data with genomics and phenomics datasets, we elucidated genes by environment (diet) interactions that regulate systemic metabolism. We found quantitative trait loci (QTLs) for ~94% of the lipids measured. Several QTLs harbored genes associated with blood lipid levels and abnormal lipid metabolism in human genome-wide association studies. Lipid species from different classes provided signatures of metabolic health, including seven plasma triglyceride species that associated with either healthy or fatty liver. This observation was further validated in an independent mouse model of non-alcoholic fatty liver disease (NAFLD) and in plasma from NAFLD patients. This work provides a resource to identify plausible genes regulating the measured lipid species and their association with metabolic traits.
In Brief
Jha et al. provide a resource of genetic loci regulating individual plasma lipid species identified by studying a large mouse population and demonstrate the potential of lipid species to reflect metabolic health status of individuals. Several lipid-regulating loci in the mouse population harbor genes associated with abnormal lipid metabolism in human GWAS. The potential of lipid species to reflect health status was validated in dietary and therapeutic models of NAFLD in mice and human NAFLD patients.
Graphical Abstract
INTRODUCTION
Lipids are central to all biological processes, from storing energy to forming cell membranes to signaling (Han, 2016). Although lipids are composed of few structural “building blocks,” their vast combinatorial side chain possibilities yield ~100,000 distinct endogenous molecular species (http://www.lipidmaps.org ) (Fahy et al., 2005). Understanding the physiological contributions of these diverse lipids is important because species within the same class have differential association with disease states (Puri et al., 2009; Quehenberger and Dennis, 2011; Rhee et al., 2011). Moreover, routine measurements of whole-lipid class abundance using enzymatic assays often do not correlate with the abundance of individual lipid species in disease states (Quehenberger and Dennis, 2011).
The endogenous lipid profile in mammals is determined by the combined influences of genes, environmental factors, and their interactions (GxE). The profile varies based on changes in dietary lipids, de novo lipogenesis, and alterations in the activities of the hundreds of enzymes that modulate length, desaturation, and incorporation of fatty acids (FAs) into more complex lipid molecules. Aberrant levels of storage lipids (triacylglycerol [TAG]), circulating lipid-protein complexes (lipoprotein particles), and membrane lipids (phospholipids [PL] and diacylglycerols [DAG]) have been linked to metabolic dysfunction, such as seen in the metabolic syndrome, whose features include obesity, insulin resistance, cardiovascular diseases, and non-alcoholic liver disease (NAFLD) (Farese et al., 2012; Han, 2016; Puri et al., 2009; Quehenberger and Dennis, 2011). However, the contribution of majority of the individual lipid species per se to metabolic dysfunction or to a healthy metabolic state is poorly understood. In the past decade, genome-wide association studies (GWAS) have identified numerous genetic variants and loci associated with different lipid classes and complex metabolic traits (Dewey et al., 2016; Diabetes Genetics Initiative of Broad Institute of Harvard and MIT, Lund University, and Novartis Institutes of BioMedical Research et al., 2007; Willer et al., 2013); however, these loci explain only 5%–20% of the variance observed (Johansen et al., 2011; Manolio et al., 2009). This problem is furthermore compounded as many traits, such as lipids, are strongly modulated by GxE interactions, which are difficult to control in human studies. In contrast, studies of mouse genetic reference populations (GRPs) in which environmental factors can be controlled have been able to provide a stable platform for identifying major genetic, environmental, and GxE factors influencing complex traits (Hui et al., 2015; Sittig et al., 2016; Williams and Auwerx, 2015). While earlier mouse population studies have identified specific loci associated with different lipid classes (Hui et al., 2015; Zhang et al., 2012), no study in a GRP has specifically profiled individual lipid species or identified loci associated with them—nor has GxE been examined for these traits.
In this study, we performed lipidomic profiling across 49 distinct inbred strains of the BXD GRP (descending from crosses between C57BL/6J mothers and DBA/2J fathers) fed either chow diet (CD) or high-fat diet (HFD) and subjected, in parallel, to an extensive battery of metabolic tests (Williams et al., 2016). Both genetic and multilayered omics approaches were used to gain a comprehensive understanding of the genetic and dietary impact on lipid species and to uncover the potential of lipid species as signatures of metabolic health.
RESULTS
Plasma Lipid Species Profile across the BXD GRP
To characterize the physiological significance of the plasma lipids measured, we used 78 BXD cohorts from 49 different strains—44 cohorts fed CD and 34 fed HFD (280 mice) for 21 weeks. While on their respective diet, mice underwent extensive metabolic phenotyping (Williams et al., 2016; Wu et al., 2014). Subsequently, mice were sacrificed in an overnight fasted state and plasma samples were analyzed using a discovery liquid chromatography-tandem mass spectrometry (LCMS/MS) lipidomics platform. Lipid species were separated via reversed-phase chromatography and identified using high-resolution precursor and fragmentation scans. Collectively, we identified eight distinct lipid classes, including free fatty acids (FFAs) (16 species), TAG (53 species), diacylglycerol (DAG) (6 species), phosphatidylcholine (PC) (28 species), phosphatidylethanolamine (15 species), phosphatidylinositol (7 species), phosphatidylglycerol (2 species), and coenzyme Q (2 species) (Table S1). The high quality and reproducibility of the MS measurements are demonstrated by the pairwise correlation of technical and extraction replicates, showing consistent robust correlation (Figure S1). Furthermore, we performed all possible pairwise correlations between the lipid species from different groups to assess the sensitivity of our measurements in detecting global diet- and strain-driven differences (Figure 1A). The correlation of all lipids within each strain (biological replicates) in either diet (CD or HFD) was higher than within strain-across diet (CD versus HFD) correlation, implying that the global effect of diet is larger than that of the biological replicates of the strains. As expected, the correlation across strains on a given diet (either CD or HFD) was higher than across strain-across diet correlation (Figure 1A). Hierarchical cluster analysis demonstrated that most BXD cohorts segregated based on diet (Figure 1B), which was also evident in the first dimension (PC1) of the principal-component analysis (PCA) (Figure 1C). However, the variance explained by the sum of the first two principal components is only 53%, which indicates that the lipidomic profile of the BXDs is highly variable in both diets (Figure 1C). Of the 129 lipid species measured, 93 were significantly different between the two dietary cohorts (53 upregulated and 40 downregulated, HFD versus CD) (Table S2), indicating a major effect of diet on lipid profiles.
Figure 1. Dietary Impact on the Plasma Lipids Measured.

(A) Pairwise correlation to assess the sensitivity of MS to detect global diet- and strain-driven differences across 280 samples. Red dot represents mean; the three lines represent median, upper, and lower quartile.
(B) Heatmap of unsupervised hierarchical clustering of 129 lipid species for each BXD cohort.
(C) PCA of all lipids in each BXD strain (indicated by the strain number).
(D) Schematic representation of the systemic profile of saturated fatty acids (SFAs) and monounsaturated fatty acids (MUFAs) (top) and polyunsaturated fatty acids (PUFAs) (bottom) in BXDs, based on the levels of the free fatty acids (FFAs) measured. Significant changes (HFD versus CD; p < 0.05) for FFA levels, activity of the desaturases and elongases (ratio of product and precursor FFA) are shown as red for increase or blue for decrease.
(E) Pie chart showing the dietary enrichment of eight common side chain FAs in the lipid species in either diet. Number in the center indicates the total number of lipids having at least one indicated FA side chain. For each pie chart, the three colors represent the number of lipids (having the indicated FA side chain) increased in HFD versus CD (red), CD versus HFD (blue), or unchanged (gray).
We next evaluated the impact of diet on monounsaturated fatty acid (MUFA) and polyunsaturated fatty acid synthesis—major determinants of the lipid profile—by analyzing the levels of plasma FFAs (Figure 1D). Though the saturated fatty acids and MUFAs were ~13–19 times higher in the diet of HFD versus CD cohorts, only stearic (18:0) and oleic (18:1n9) acids were significantly increased in the plasma of HFD cohorts, indicating their increased accumulation under HFD (Figure 1D, top). Furthermore, the desaturation and elongation products of 18:1n9 (20:1n9, 22:1n9, 24:1n9) were not increased in HFD cohorts. This indicates a specific accumulation/enrichment of oleic acid side chains in lipid species increased on HFD (Figures 1D, top and 1E). Though the essential fatty acids (EFAs), including linoleic (18:2n6) and linolenic (18:3n3) acids were 1.5 and 1.8 times higher in the diet of HFD cohorts, their levels were decreased in the plasma of HFD cohorts (Figure 1D, bottom). This may reflect increased utilization of the EFAs in HFD cohorts to build long chain FFAs (e.g., 20:4n6 and 22:4n6) and their use as an energy source, as demonstrated by increased peroxisomal-b oxidation in HFD cohorts (Figure 1D, bottom).
To evaluate the effect of diet on side chain composition of lipid species, we calculated the FA composition of all side chains from the lipid species. (For co-eluting isobaric species [Table S1], all possible FA combinations for which there was evidence were used in this calculation.) The majority of side chains were comprised of palmitic, stearic, oleic, palmitoleic, linoleic, arachidonic, and docosahexaenoic (DHA) acid (Figure 1E). Lipid species with at least one palmitic, stearic, or oleic acid in their side chain were enriched in HFD cohorts, while species with at least one palmitoleic, linoleic, and linolenic acid in their side chain were enriched in CD cohorts (Figure 1E). Lipid species with an arachidonic acid side chain were either enriched in HFD or remained unchanged, while lipids with DHA side chains were either enriched in CD or remained unchanged (Figure 1E). Notably, the dietary enrichment of all these FAs (except palmitic acid) in the lipid species observed here also reflects the FFA profile seen in Figure 1D. Taken together, these results demonstrate that diet has a strong influence in determining the lipid profile, and that FFAs in general can reflect the side chain enrichment of lipid species. These data suggest that in HFD there may be a switch toward lipid species being enriched in palmitic, stearic, and oleic acids, while being depleted in linoleic acid, because of its increased utilization, to meet the energy demand (metabolic flexibility) since the energy from carbohydrate is only 27% kcal in HFD versus 44% kcal in CD.
Plasma Lipid Species Have High Heritability
Next, we assessed the degree of genetic, dietary, and GxE regulation of lipid species. Heritability (h2; percentage of trait variation attributed to additive genetic factors) was calculated for all lipid species within (CD and HFD) and across (CD + HFD/Mixed) dietary groups (Belknap, 1998) (Figure 2A; Table S3). In addition, the variation attributed by GxE, diet, and non-genetic, nondietary variance (Unexplained) was calculated (Figure 2A and Table S3). Within a dietary cohort, more than half of the observed variance in lipid levels could be explained by genetic differences across strains (i.e., h2 ≥ 50%) for the strong majority of lipid species (80% in CD and 75% in HFD). Conversely, when dietary cohorts were combined, only 22% of lipids had h2 above 50% (Figure 2A, “Genetics (CD + HFD)”). However, even when the dietary cohorts were combined, the diet-independent genetic factor was the strongest contributor to variance explained (Figure 2A, Genetics versus [GxE, Diet and Unexplained effect]).
Figure 2. Plasma Lipid Species Have High Heritability.

(A) Heritability/variance explained of all lipid species. Number of lipids (out of 129) that have ≥50% of their variance explained by the factors along the x axis is indicated. Purple line represents median variance explained.
(B and C) Example of two lipid species having high h2 in both diets but highly affected by diet (TAG(52:2)) (B), or unaffected by diet (PC(20:1_22:6)) (C). Bar plot showing the variation of the two lipids in the BXD population is shown on the left and the percentage of h2/variance explained by the different factors is indicated in the graph as well as graphically represented on the right. Data are represented as means ± SEM.
See also Table S3.
The contribution of GxE (“GxE Effect”) or diet alone (“Diet Effect”) did not explain even 50% of observed variance for a single lipid species. However, these three controlled factors—genetics, environment, and GxE—explained more than half of the variance for 85% of all lipid species, whereas only 15% lipids had more than 50% of their variance attributed to unexplained factors (Figure 2A, “Unexplained”). For many lipids, the variance in their levels both within and across diets reflected their h2 and variance explained by genetics (CD + HFD/Mixed), diet, and GxE (Table S3). For instance, TAG(52:2) levels were significantly increased by HFD, where the diet explained its maximal variance (48%) (Figure 2B). Conversely, PC(20:1_22:6) levels were not different between the two cohorts, showing high h2 in both diets and mixed variance (attributed to genetic factors) explained most of its variance (70%) and dietary effect was only 3% (Figure 2C). Collectively, these results indicate a high degree of genetic regulation of lipid species in both diets.
Plasma Lipids Are Influenced by Many Genomic Loci, Including Several Associated with Lipid Levels in Human GWAS
Next, we mapped quantitative trait loci (QTL) for all lipid species (lQTL), identifying 212 lQTLs in CD and 94 in HFD (Figure 3A [lQTLs above blue dotted line] and Table S4). It is not surprising that most lipids had more than one lQTL, given the fact that many independent processes and pathways regulate lipid species. Only three lipid species (DAG(36:2), TAG(54:1), and eicosenoic acid/20:1) had the same lQTL position (within 5 Mb) in CD and HFD (Figure 3A, black bold font), which signifies that diet can influence the genetic factors regulating most lipid species. Of note, the CD-HFD lQTL pair of DAG(36:2)—mixture of [18:1_18:1 and 18:0_18:2]—mapped to the region containing genes with protein coding variants involved in lipid metabolic processes (Slc2a2, Kcnmb2, Bbs12, Fgf2, and Pld1), insulin secretion and homeostasis (Slc2a2, Kcnmb2, and Bbs12) (Figure 3B, left). This finding is consistent with the role of DAGs in insulin sensitivity (Farese et al., 2012) and the fact that DAG(18:0/18:2) has been proposed as one of the 21 plasma lipid predictors in the diabetes risk classification model (Wong et al., 2013). Importantly, of these five lQTL genes, the glucose transporter Slc2a2 (Dupuis et al., 2010)—associated with glucose levels, type 2 diabetes, and metabolic syndrome—showed a strong positive association with metabolic syndrome phenotypes along with DAG(36:2) (Figure 3B, right). A prominent metabolic IQTL hotspot, common to 14 lipid species, was observed on Chr2 in CD (Figures 3A and 3C). This region (101–113 Mb) contained 10 genes (among others) encoding proteins involved in lipid metabolic processes, including FoxO signaling, lipid transport, and having phospholipase and acyl transferase activity (Figure 3C, bottom). Of note are Cat (catalase; FoxO signaling), Pdhx (pyruvate dehydrogenase complex component X; acyl transferase activity), Chrm5 (Cholinergic receptor, muscarinic 5; phospholipase activity), and CD44 (CD44 antigen), which have non-synonymous SNPs in the BXDs (Figure 3C, bottom). For each lQTL, we have provided the lQTL genes having nsSNP/ncSNP/indel in BXDs in Table S4. Of the 306 lQTLs, 172 lQTLs harbor 97 genes (having non-synonymous SNPs in BXDs) that are known to be directly associated with lipid metabolic terms including “lipid metabolic process,” “lipid particle,” and “lipid binding,” transferase activity, transferring acyl groups” (Table S4).
Figure 3. Plasma Lipids Are Influenced by Many Genomic Loci, Including Several Associated with Lipid Levels in Human GWAS.

(A) Manhattan plot of lipid species. Lipids indicated in black bold font (DAG(36:3), TAG(54:1), and 20:1) have the same QTL position in CD and HFD. lQTLs with p value < 0.01 are indicated on the plot. The black and blue dotted lines represent significant and suggestive QTL threshold, respectively.
(B) lQTLs for one of the three lipids (DAG(36:2)) having a QTL at the same locus in both diets (top-left). Select lQTL genes and their function are indicated below (bottom-left). Pearson correlation of DAG(36:2) alongside the expression of its liver lQTL genes (in CD) with metabolic syndrome phenotypes (right).
(C) Hotspot region comprising 14 lQTLs on chromosome 2. Genes associated with lipid metabolism in this region are indicated below.
(D) Genes with protein coding variants under 306 lQTLs were screened for any known association with blood lipids and associated metabolic traits in human GWAS. The screening identified 40 GWAS genes (with nsSNPs) from 93 lQTLs. 55/25 lipids contributed to 65/28 QTLs harboring GWAS genes in CD/HFD with 12 lipids in common across diet. 45/22 lipids mapped to one GWAS gene each in CD/HFD, whereas 10/3 lipids mapped to two different GWAS genes each.
Human GWAS have identified many genetic variants associated with plasma lipids and associated metabolic traits (http://jjwanglab.org/gwasdb, https://www.ebi.ac.uk/gwas/) (Diabetes Genetics Initiative of Broad Institute of Harvard and MIT, Lund University, and Novartis Institutes of BioMedical Research et al., 2007; Willer et al., 2013; Kathiresan et al., 2009). Because of the close homology between mouse and human genomes, the mouse can be used to add evidence to genes suggested by human studies. Taking advantage of these genes identified in GWAS studies (Table S5), we screened the 306 lQTLs (Table S4) for the presence of any human GWAS genes associated with plasma lipids and associated metabolic traits (Figure 3D). We applied a stringent approach by screening only those lQTL genes that have non-synonymous SNPs in BXDs. This screening identified 40 GWAS candidate genes (out of 494 GWAS genes) under 93 lQTLs: 65 lQTLs in CD from 55 lipids and 28 lQTLs in HFD from 25 lipids (Figure 3D; Tables 1 and S5). While 45 lipids in CD and 22 in HFD had only one lQTL harboring the GWAS genes, 10 lipids in CD and 3 in HFD had 2 lQTLs each harboring two different GWAS genes, indicating a polygenic regulation of these lipid species by different genes (Figure 3D). Only 12 lipids had lQTL in both diets, of which 10 mapped to different GWAS loci in the two diets and only 2 (DAG(36:2)/ DAG(18:1_18:1 and 18:0_18:2), and eicosenoic acid_ 20:1) mapped at the same GWAS loci (within 5 Mb) in both diets (Figure 3A; Tables 1 and S5). Importantly, we found 6 syntenic GWAS regions in humans (0.04–0.9 Mb) that were also syntenic in mice (0.4–0.8 Mb) (Table 1 [genes indicated by prefix “#”] and S5 [genes indicated in red font]).
Table 1.
IQTLs Harboring Genes Associated with Abnormal Lipid Metabolism in Human GWAS
| Lipid | Diet | Gene @ chr, Mb | GWAS Phenotype | GWAS Validated PMID |
|---|---|---|---|---|
| DAG(18:2_16:0) | CD | Insig2 @chr1, 121.30 | TC, LDL-C | 24097068 |
| TAG [48:0, 50:0] | CD | Fmn2 @chr1, 174.50 | TG | 23063622 |
| PC(32:2) | HFD | |||
| PC [(22:6_16:0), (19:0_22:6)] | CD | Ifih1 @chr2, 62.59 | T1D | 17554260 |
| PI(20:4_18:0) | CD | #Grb14 @chr2, 64.91 | HDL-C, BMI | 24097068, 25673412 |
| #Cobll1 @chr2, 65.08 | HDL-C, BMI | 24097068, 25673412 | ||
| TAG [51:4, 52:4, 52:5, 54:7, (54:6)_2] | CD | Cd44 @chr2, 102.81 | TG, TC, HDL-C | 23063622 |
| DAG(18:2_18:2), Oleic acid | CD | |||
| PC [(36:1), (16:0_18:1), (18:0_20:5)] | CD | |||
| Eicosenoic acid | CD | Plcb2 @chr2, 118.70 | TG | 23063622 |
| PE [(18:1_18:2), (16:0_18:2)] | CD | #Capn3 @chr2, 120.46 | TG | 20686565, 24097068 |
| #Ubr1 @chr2, 120.86 | TG | 25961943 | ||
| TAG(58:9) | CD | Plcg1 @chr2, 160.73 | TC | 27790247 |
| TAG(54:6)_2, PC(16:0_18:1) | HFD | Cd40 @chr2, 165.05 | TG | 23063622 |
| DAG(36:2/18:1_18:1) | CD | Slc2a2 @chr3, 28.69 | fasting glucose | 20081858 |
| DAG(18:1_18:1) | HFD | |||
| PC(36:2) | CD | Mttp @chr3, 138.089 | TG | 19060911 |
| Nervonic acid | CD | Macf1 @chr4, 123.34 | HDL-C | 25961943 |
| PC(18:0_16:0) | CD | Pigv @chr4, 133.66 | TG, LDL-C, HDL-C | 24097068, 28334899 |
| TAG [(48:3), (50:3)] | CD | Nos3 @chr5, 24.36 | TG, CAD | 23063622, 26343387 |
| Eicosenoic acid | HFD | |||
| TAG [53:2, 56:2, 51:1, 52:1, 54:1] | CD | Corin @chr5, 72.30 | TG | 23063622 |
| PC [(17:1_18:2), (16:0e_20:4)] | HFD | Klhl8 @chr5, 103.86 | TG, HDL-C | 28334899 |
| TAG [56:5, 53:3], PC(32:2) | CD | Alms1 @chr6, 85.58 | TG, TC, HDL-C, | 23063622 |
| LDL-C | 23063622 | |||
| DAG(18:1_18:2) | CD | Apoe @chr7, 19.69 | TC, HDL-C, LDL-C | 25961943, 28371326 |
| PC(34:2), PE(20:0e_22:6) | CD | |||
| TAG(50:3), PC [(16:0_18:1), (33:1)] | HFD | |||
| PC(20:0_22:6) | CD | Ppp1r3b @chr8, 35.37 | TC, HDL-C, | 25961943, 20686565, |
| TAG(49:2), PI(18:0_18:2), PE(18:0_18:2) | HFD | LDL-C, PL | 21829377 | |
| TAG(58:4), PC(16:0_18:1) | CD | Msr1 @chr8, 39.58 | TG | 23063622 |
| PC [(16:0e_20:4), (20:4_22:6), (38:2)] | CD | Pccb @chr9, 100.98 | TG, HDL-C | 24097068, 25961943 |
| PE(20:4_18:0) | HFD | Acad11 @chr9, 104.06 | HDL-C, LDL-C | 28334899, 24097068 |
| PC(32:2), PE [(16:0_18:1), (18:1_18:2)] | CD | #Aloxe3 @chr11, 69.12 | TG | 23063622 |
| Nisinic acid | CD | #Dlg4 @chr11, 70.017 | TC, LDL-C | 24097068 |
| Pld2 @chr11, 70.54 | PL, TG | 22359512, 25961943 | ||
| TAG(54:2) | HFD | #Mpp3 @chr11, 101.99 | TG | 24097068 |
| #Cd300lg @chr11, 102.04 | HDL-C | 28270201 | ||
| FA [16:0, 20:4, 22:6, 18:0, 20:3] | CD | Srp68 @chr11, 116.24 | TG | 23063622 |
| TAG [(54:6)_1, 51:4, 50:4, 52:5, 48:3] | CD | |||
| PC [(18:0_16:0), 20:4_18:0] | CD | |||
| PC(19:0_22:6) | CD | Sycp2l @chr13, 41.11 | PL | 21829377 |
| Eicosenoic acid, DHA, PC(20:2_22:6) | CD | #Poc5 @chr13, 96.38 | obesity | 23563607 |
| Eicosenoic acid, DGLA, nisinic acid | HFD | #Ankdd1b @chr13, 96.41 | TG | 19060911 |
| TAG [48:1, 56:8], PC [(38:2), (20:4_22:6)] | HFD | #Polk @chr13, 96.48 | TC, LDL-C | 28270201, 28334899 |
| PE [(20:2_22:6), (18:0e_18:1)] | HFD | Map3k1 @chr13, 111.74 | TG | 28334899 |
| PE [(18:0e_18:2), (20:0e_18:2)] | HFD | |||
| TAG(52:3) | CD | Rmi2 @chr16, 10.83 | HDL-C | 25961943 |
| Pdxdc1 @chr16, 13.83 | TG | 28334899 | ||
| TAG [(56:8), (54:7)] | HFD | #Angptl4 @chr17, 33.77 | TG, HDL-C | 25961943 |
| #Btnl2 @chr17, 34.35 | lipid levels | 19936222 | ||
| PE(18:0e_22:6) | CD | Pnliprp2 @chr19, 58.75 | PL | 22359512 |
Each box (27 loci) of the table represents the IQTL(s) in either diet, harboring the indicated 40 human GWAS genes (having protein coding variants in BXDs) and the GWAS phenotype associated with the gene(s). Genes indicated by the prefix # are syntenic in mice and humans (six loci). GWAS phenotype abbreviation: TG, triglyceride; TC, total cholesterol; HDL-C, HDL cholesterol; LDL-C, LDL cholesterol; PL, phospholipid; BMI, body mass index; T1D, type 1 diabetes; CAD, coronary artery disease. An extended version of this table is provided in Table S5. See also Figure S2 and Table S5.
Apart from the genes in Table 1, some lQTLs harbored prominent human GWAS genes (associated with blood lipids and metabolic traits) that do not have non-synonymous SNPs in BXDs but may be linked to the causal variant. For instance, TAG(50:3) had a QTL at the locus of glucokinase regulatory protein (Gckr) and Lrpap1 (LDL receptor-related protein-associated protein 1). Gckr is one of the most robust loci implicated in TAG metabolism (Figure S2A) (Diabetes Genetics Initiative of Broad Institute of Harvard and MIT, Lund University, and Novartis Institutes of BioMedical Research et al., 2007). It has been replicated in GWAS of plasma TAG concentration, NAFLD and hypertriglyceridemia by an excess of rare variants in patients (Johansen et al., 2011; Kathiresan et al., 2009; Speliotes et al., 2011). Lrpap1 shares the same locus as Gckr (within 5 Mb) and has been associated with TAG, HDL-C, and LDL-C (Figure S2A). FA desaturase (Fads 1, 2, and 3) is another prominent gene, which has been associated with TAG, PLs, and type 2 diabetes in numerous GWAS studies (Diabetes Genetics Initiative of Broad Institute of Harvard and MIT, Lund University, and Novartis Institutes of BioMedical Research et al., 2007; Johansen et al., 2011; Kathiresan et al., 2009; Speliotes et al., 2011) (Figure S2B). In line, two TAGs and four PCs had lQTLs at the Fads locus (Figure S2B). Interestingly the FADs locus is syntenic in both mice and humans (Figure S2B). These data suggest that a large number of GWAS genes associated to total lipid levels in humans can also regulate many individual lipid species.
Lipid Species Provide a Signature of Metabolic Health Status
Since many lipid species shared common QTLs, we hypothesized that they are correlated/co-regulated. To assess this, we performed an unweighted correlation network analysis of all the lipid species, giving an overview of interactions between different lipid species and classes (Figures 4A and 4B). In both CD and HFD cohorts, lipid species were highly correlated both within and across different lipid classes. The network in both cohorts showed a strong dense grouping of TAGs, PCs, FFAs, and DAGs (Figures 4A and 4B, red ellipse). This cluster is indicative of the PC and TAG synthesis from DAG intermediates (Han, 2016). Diet-specific interactions were also observed; e.g., TAGs with high carbon number (56–64) were not connected in the CD network but were integrated with other TAGs in the HFD network (Figures 4A and4B, green ellipse). These results suggest that lipids across different classes are correlated, and that a change in one or more species may impact the levels of many other lipid species independent of the lipid class.
Figure 4. Association of Lipid Species with Metabolic Traits.

(A and B) Spearman correlation network of all lipid species in CD (A) and HFD (B). Lipid species are color coded as 10 major lipid classes.
(C and D) Heatmap with an unsupervised hierarchical clustering of Spearman’s correlation rho value of 36 lipids with metabolic phenotypes. These 36 lipids show the same correlation trend with metabolic phenotypes in both CD (C) and HFD (D). The horizontal green phenotype cluster represents healthy metabolic traits, whereas the red cluster represents unhealthy metabolic traits. The vertical green lipid cluster represents the healthy markers of metabolic health/fitness, whereas the red cluster represents the unhealthy markers of metabolic health/fitness. Table S6 provides the rho and p values for each lipid-phenotype correlation.
Based on this conception, we hypothesized that it may be possible to predict metabolic health based on the variation in lipid levels and vice versa. From the extensive phenotypic profiling performed in these mice (Williams et al., 2016), we acquired 30 unique traits reflective of metabolic health/fitness. These traits included fat and lean mass, physical fitness (treadmill exercise, activity wheel, VO2 max), oral glucose tolerance test, heart rate, and plasma biochemical markers (e.g., alanine transaminase [ALT], aspartate transaminase [AST], cholesterol, FFAs, etc.), among others. Spearman correlation was calculated between all lipid species and metabolic traits (Table S6). The correlation rho value was used to perform a heatmap analysis with unsupervised hierarchical clustering of all lipid species and metabolic traits (Figure S3A). In both CD and HFD, two lateral clusters (extreme right and left) of lipid species could easily be identified, which correlated with most of the metabolic traits (Figure S3A). From these two lateral clusters in each diet (Figure S3B), we identified 36 lipid species that showed the strongest correlations with metabolic traits in both diets (Figures 4C and 4D). Among them, 19 lipids were identified as “healthy markers” in both diets (Figures 4C and 4D, vertical green cluster), since they positively correlated with healthy metabolic traits (Figures 4C and 4D, horizontal green cluster) and negatively with unhealthy traits (Figures 4C and 4D, horizontal red cluster). While 17 lipids were identified as “unhealthy markers” showing the inverse correlation pattern (Figures 4C and 4D, vertical red cluster). Note that FFA, kidney weight, heart weight, and heart rate cluster with healthy metabolic phenotypes. The fact that FFAs provide 60%–70% of the heart’s energy requirement (van der Vusse et al., 2000), and are also the predominant energy source for the kidney (tubular epithelial cells) (Kang et al., 2015), explains the clustering of these traits together. Interestingly, only 7 of the 36 lipids identified as metabolic health predictors are among the most abundant lipids in their class (PC(20:4_18:0), PC(20:4_16:0), PC(22:6_16:0), PC(36:1), TAG(52:2), TAG(52:4), and TAG(54:3)); the remaining 29 lipids have relatively low abundance in plasma (Table S2). Taken together, these data suggest that lipid species reflect metabolic health and that the most abundant species may not necessarily be the best predictors of health.
Identification of Signature Lipid Species for NAFLD
Since plasma lipids associated with metabolic traits, we next tested this finding in the context of a disease. Taking advantage of the liver lipid species measured from the same cohort of mice from our companion article in this issue (Jha et al., 2018), we tested whether plasma lipid species can be indicative of NAFLD, characterized by excess TAG accumulation in liver (Kleiner et al., 2005). Both in humans and different mouse strains, plasma and liver TAG levels are highly variable and are not always increased in NAFLD or by HFD, indicating a complex polygenic regulation (Browning et al., 2004; Johansen et al., 2011; Kirk et al., 1995; Lin et al., 2005; Romeo et al., 2008). In line, plasma and liver TAG levels were highly variable in the BXDs, although no significant difference was observed between CD and HFD cohorts (Figure 5A). Moreover, the liver and plasma total TAG levels did not correlate (Figure 5B). Therefore, we sought to identify individual lipid species in plasma that are representative of their levels in liver. Of the 55 common lipids measured in plasma and liver, 30 in CD and 21 in HFD correlated with a Spearman’s rho (absolute value) > 0.32 (Figure 5C, orange and green bar; Table S7). In addition, there was a strong positive correlation between the common plasma and liver lipids across diets (Figure 5D). In particular, plasma and liver values of nine of these lipids significantly and tightly correlated across both diets (Figure 5D, dark green and orange dots), implying that the plasma levels of these lipids reflect their abundances in liver in both diets (Figure 5E). Of these nine lipids, four TAG species (TAG: 52:2, 54:3, 56:3, and 54:1) were increased in the HFD cohorts in both plasma and liver, while three TAG species (52:5, 52:4, and 54:6) were increased in the CD cohorts in both plasma and liver (Figures 5E and S4). TAG(50:2) was significantly increased in HFD in plasma but not in liver (Figure S4). DAG(L_P)/(DAG(18:2_16:0)) showed a negative correlation between liver and plasma (Figure 5E) because, on HFD, it was decreased in plasma but increased in liver (Figure S4). The accumulation of DAG(L_P) in liver and reduction in plasma (Figure S4) suggests that its release from liver into the plasma may have been minimized.
Figure 5. Identification of Lipid Species as Markers of NAFLD.

(A and B) Plasma and liver TAG concentration (A) and correlation (B) in BXD cohorts. Data are represented as means ± SEM.
(C and D) 55 common lipid species between plasma and liver were correlated using Spearman’s method. (C) Histogram of the rho correlation value of these 55 lipid pairs in CD (left) and HFD (right). (D) Correlation of rho values between CD and HFD from (C) to identify lipids, which behave similarly despite the dietary switch. Green dots indicate lipid species with positive correlation (wherein dark green dots are significant; p < 0.05), red and orange dots indicate lipids with negative correlation (wherein red dot is significant; p < 0.05). Purple dots indicate lipid species with opposite correlation in CD and HFD, reflective of GxE effect.
(E) Pearson correlation of nine significant lipid species identified in (D) (dark green and red dots) in liver and plasma.
(F) Correlation matrix showing the Pearson correlation of the nine lipids, alongside plasma and liver TAG with NAFLD readouts.
Correlation analysis of these nine lipids, alongside total TAG concentration in liver and plasma, was performed with phenotypes linked with NAFLD, including fasting insulin, glucose, cholesterol, ALT, AST, fat mass, liver mass, and body weight (Figure 5F). For either diet, the total TAG concentration in plasma or liver either did not correlate or had a weak correlation with NAFLD-associated phenotypes, which was in contrast to the individual TAG species (Figure 5F). The TAGs: 52:2, 54:3, 56:3, and 50:2, showed positive correlation, while the TAGs: 52:5, 52:4, and 54:6 showed negative correlation with the NAFLD readouts in both diets in liver and plasma (Figure 5F, red and blue font, respectively). Importantly, these seven lipids had high h2 (55%–84%) in plasma in both CD and HFD cohorts (Table S3). Of note, DAG(L_P), which shows a negative correlation between plasma and liver (increased in CD in plasma and in HFD in liver) (Figures 5E and S4), is the only lipid among the nine lipids showing an opposite correlation with NAFLD phenotypes between liver and plasma (Figure 5F). TAG(54:1) can be considered a diet-specific NAFLD marker since it correlated positively with NAFLD markers in CD and negatively in HFD, indicative of a GxE effect, where the HFD effect reverses the genetic effect; its h2 in CD being 57% and in HFD, 48% (Table S3). The unexplained variance for both TAG(54:1) and DAG(L_P) was 35% and 48%, respectively (Table S3), suggesting that these two lipids may be less reliable plasma signatures for NAFLD. These findings suggest that elevation of TAGs with fewer double bonds: 52:2, 54:3, 56:3, and 50:2 comprises a pro-NAFLD signature, whereas an increase in TAGs with more double bonds: 52:5, 52:4, and 54:6 comprises an anti-NAFLD signature, irrespective of the diet. Notably, the pro-NAFLD TAGs: 52:2 and 54:3, and the anti-NAFLD TAGs: 52:5, 52:4, and 54:6 are also among the systemic unhealthy and healthy metabolic markers (Figures 4C and 4D). Our data also signify the importance of having a strong correlation between a plasma and liver lipid in order for it to be established as a disease signature.
Assessment of Identified NAFLD Signatures in Mice and Humans
We then tested the relevance of these lipids as signatures of fatty liver in a different mouse model of NAFLD (induced by high-fat high-sucrose [HFHS] diet) and tested whether an NAFLD lowering therapeutic intervention, i.e., nicotinamide adenine dinucleotide (NAD+) precursor, nicotinamide riboside (NR), impacts these lipid markers. As such, we compared the liver lipids of mice fed CD or HFHS diet for 18 weeks, or mice that were fed HFHS diet supplemented with NR 9 weeks after the start of HFHS diet when they had already developed NAFLD (a therapeutic intervention, HFHS + NR) (Figure S5A) (Gariani et al., 2016). Though liver total TAG concentration was significantly elevated in the HFHS group and decreased by NR (Figure S5B) (Gariani et al., 2016), all individual TAG species did not show this profile despite their uniform genetic background (C57BL/6J) (Figure S5C). Of all the TAG species measured, only 53% were increased in the HFHS cohort while 33% were decreased and 14% remained unchanged (data not shown). Importantly, all four pro-NAFLD lipids (TAGs: 52:2, 54:3, 56:3, and 50:2) from the BXD HFD study (Figure 5F) were also increased in C57BL6/J mice fed HFHS diet, whereas the three anti-NAFLD lipids (TAGs: 52:5, 52:4, and 54:6) were decreased in HFHS diet cohorts (Figure 6A). NR significantly lowered three of the four pro-NAFLD lipids (TAGs: 54:3, 56:3, and 50:2), but increased the anti-NAFLD lipids only to a slight extent (Figure 6A). Importantly, the pro-NAFLD lipids correlated positively, whereas the anti-NAFLD lipids correlated negatively with clinical NAFLD readouts (Figure 6B). Notably, the liver NAD+ levels correlated negatively with the pro-NAFLD lipids, and positively with anti-NAFLD lipids (Figure 6B), fully in line with our previous work, which showed that NAD+ levels are depleted in steatotic livers and are replenished after NR treatment (Gariani et al., 2016).
Figure 6. Validation of NAFLD TAG Signatures in Mice and Humans.

(A) Levels of pro- and anti-NAFLD signatures in livers of C57BL/6J mice fed on CD, high-fat high-sucrose-diet (HFHS) and HFHS diet supplemented with NR,9 weeks after the initiation of HFHS diet (HFHS + NR). Data are represented as means ± SEM.
(B) Pearson correlation matrix of the pro- and anti-NAFLD signatures with NAFLD readouts including the NAS score (NAFLD activity score) and liver NAD+ levels.
(C) Levels of plasma NAFLD signatures in human subjects with various degrees of NAFLD. Data are represented as means ± SEM.
(D) Pearson correlation matrix of the NAFLD signatures with NAFLD readouts in human subjects.
(E) Pearson correlation of Atgl expression in subcutaneous WAT with pro- and anti-NAFLD plasma TAG signatures in BXD strains. For mice: n = 6–9 per group. For human subjects: n = 12, healthy; n = 7, steatosis; n = 14, early-stage NASH; n = 11, advanced-stage NASH. Differences in mean TAG species were compared using two-sample t tests.
*p < 0.05, **p < 0.01, ***p < 0.001. See also Figure S5.
To further explore the clinical relevance of these findings, we analyzed the plasma lipid species of healthy patients, patients with steatosis, early-stage NASH (mild to moderate fibrosis [F1 + F2]) and advanced-stage NASH (severe bridging fibrosis or cirrhosis [F3 + F4]). The first dimension (PC1) of the PCA of 55 TAG species segregated nearly all of the healthy individuals from the steatosis and NASH group (Figure S5D). However, the variance explained by the PC1 was only 46%, implying that the TAG profile in humans is highly variable possibly due to the high genetic variation (Figure S5D). Despite the significant differences in total TAG plasma levels between the healthy and NAFLD groups (Figure S5E), only a few individual TAG species were significantly changed, which is in line with the findings from mice. Only 20% of TAG species were increased in steatosis versus healthy, while 64% increased in early-stage NASH versus healthy and 49% increased in advanced-stage NASH versus healthy group (data not shown). However, the pro-NAFLD lipids were increased in steatosis and/or the two NASH groups. Compared with the healthy group, TAG(50:2) was increased in both steatosis and the two NASH groups (F1 + F2 and F3 + F4), while TAG(52:2) was increased only in the two NASH groups, whereas TAG(54:3) and TAG(56:3) were increased in the two NASH versus the steatosis groups (Figure 6C). Conversely, the three anti-NAFLD lipids, TAG(52:5), TAG(52:4), and TAG(54:6), were decreased in advanced-stage compared with early-stage NASH (Figure 6C). In line, the pro-NAFLD lipids correlated positively with NAFLD readouts, whereas the anti-NAFLD markers correlated negatively (Figure 6D). Taken together, these data confirm the findings from the BXDs in a different model of diet-induced NAFLD in mice as well as in humans, indicating that these lipid species may be a more universal signature of NAFLD across different diets and also relevant in humans.
To obtain insight on the affinity of TAG-metabolizing enzymes for the NAFLD signatures, we tested the association of adipose triglyceride lipase—the rate limiting TAG-metabolizing enzyme—with these NAFLD TAG signatures. Atgl expression in white adipose tissue (WAT) negatively correlated with the pro-NAFLD signatures and positively correlated with the anti-NAFLD signatures in both CD and HFD cohorts (Figure 6E). This correlation was also observed with the expression of Atgl in other metabolic tissues (liver, heart, and muscle) (Figure S5F); however, the strongest association was observed with WAT Atgl expression, since Atgl lipase activity is ~10 times higher in WAT compared with other tissues (Haemmerle et al., 2006). These findings are consistent with our previous experimental findings showing that Atgl is important to provide protection from steatohepatitis and that Atgl-KO mice are susceptible to develop NAFLD/NASH(Jha et al., 2014). In addition, the pro-NAFLD signatures in both plasma and liver correlated positively with lipid biosynthetic pathways and negatively with oxidative pathways (Figure S5G). Conversely the anti-NAFLD signatures correlated positively with oxidative pathways and negatively with lipid biosynthetic pathways (Figure S5G). Taken together, these biological corroborations of the TAG signatures provide proof of concept validation of the lipid species measured and validate the usefulness of the resource.
DISCUSSION
Here we used a systems approach—combining genetics, lipidomics, and phenomics—to examine the dietary and genetic regulation of plasma lipids and their potential to reflect metabolic health status. Our study reveals that most plasma lipids have high heritability and map to a QTL, several of which harbor genes associated with abnormal lipid metabolism in human GWAS. As such we show that changes in specific plasma lipids can be used as signatures of metabolic health status. We further validate the potential of seven TAG species as plasma signatures of NAFLD in mice and humans.
As expected, the change in diet from CD (6% calories from fat) to HFD (60% calories from fat) had a significant impact on a large proportion (70%) of the plasma lipid species measured. Due to the unique genetic background of each of the strains, even within the same dietary cohort, most lipids were highly variable across strains, an observation similar to that in humans (Shin et al., 2014). Across all conditions, roughly 50% of variation could be attributed to diet-independent genetic factors, with an additional ~10% of variation being attributable to uniform diet-induced changes, or a strain-dependent response to dietary differences. Together, our study can explain more than half of the observed variation in plasma lipid levels for 85% of the 129 measured lipid species. For the variation attributable to genetic or GxE factors, we identified about 300 novel lQTLs containing known and novel putative regulators of lipid metabolism. Taking advantage of the known human GWAS loci/genes associated with blood lipid levels and associated traits, we uncovered, via a cross-species examination, the association between 40 human GWAS genes and 93 lQTLs including 6 syntenic regions common in mice and humans. This link underscores the power of mouse GRPs beyond finding novel loci/genes controlling levels of lipid species to their potential to complement human genetic studies. The fact that our data are derived from a genetically diverse mouse population, which mimics the genetic variation observed in humans, increases its translational value and suggests that such populations provide a proper setting for additional mechanistic studies related to lipid metabolism.
Network analysis showed that lipid species are correlated and co-regulated, both within and across lipid classes. This resonates with the underlying fact that any change in a lipid metabolic pathway induced by an experimental or physiological intervention will almost assuredly result in compensatory changes in other pathways affecting discrete lipid pools (Farese et al., 2012). Our findings furthermore demonstrate that within the same lipid class, some lipid species are associated with healthy metabolic traits and others with unhealthy metabolic traits, providing testimony to the fact that all lipid species in a class do not have the same physiological impact (Farese et al., 2012; Quehenberger and Dennis, 2011; Rhee et al., 2011). We tested this computational finding by comparing the lipid species of plasma (this study) and liver (Jha et al., 2018) and identified plasma lipids that are reflective of liver lipid accumulation in NAFLD across diets and genetic background. Our results demonstrate that pro-NAFLD TAG signatures have fewer double bonds compared with the anti-NAFLD TAG signatures. These findings are in line with a previous study in humans showing that TAGs with lower carbon and double bond content were associated with increased risk of diabetes (Rhee et al., 2011) and therefore underscores the potential of mouse population genetics for translational research. Indeed, we validated the TAG signatures in another dietary model of NAFLD and in human NAFLD subjects with consistent results.
Some technical limitations in this study need to be considered. First, our lipidomic platform did not provide a complete coverage of the whole-plasma lipidome. Many lipid classes, including ceramides, lysophospholipids, cholesterol esters, etc., were not part of our validated lipidomics method at the time these measurements were made. However, our goal was to measure a substantial subset of the plasma lipids across hundreds of samples in the most accurate way, and by the simplest method, from only 20 μL of plasma, in order to power QTL and other systems analyses. Second, our measurements do not provide absolute quantification of lipid species. Since the major thrust of this work is the identification of genetic loci regulating lipid levels and the association of lipid species with metabolic phenotypes, the lack of absolute lipid concentrations does not undermine our findings. We acknowledge that more work is required to extend our other genetic and phenotypic findings, which is beyond the scope of this current article. This resource, however, lays the foundation for future mechanistic insight into the complex biology of lipids.
In conclusion, this study uncovers the potential of plasma lipidomics combined with systems genetics approaches in a mouse population to identify signatures of health and disease. Identifying genes and genetic variants associated with plasma lipid species will enrich our understanding of biochemical pathways, while at the same time facilitating the design of new therapies for metabolic diseases. The wealth of information on novel lQTLs and the phenotypic footprint of these lipid species provide a robust resource to the scientific community for further in silico data analysis. Our findings illustrate the need, importance, and scope of studying individual lipid species and provide a platform for further mechanistic studies of lipid species, as also demonstrated in our companion article (Jha et al., 2018).
STAR★METHODS
CONTACT FOR REAGENT AND RESOURCE SHARING
Further information and requests for resources and reagents should be directed to and will be fulfilled by the Lead Contact, Johan Auwerx (admin.auwerx@epfl.ch).
EXPERIMENTAL MODEL AND SUBJECT DETAILS
Mice
BXD strains were obtained from University of Tennessee Health Science Center (Memphis, TN, USA) and JAX (The Jackson Laboratory) and bred at the École Polytechnique Fédérale de Lausanne (EPFL) animal facility for more than two generations before incorporation into the study. Cohorts of 49 BXD strains with ~5 males each on CD and HFD were used in this study. Mice were fed a chow diet [CD; 2018 Teklad Global 18% Protein Rodent Diet (6.2% kcal from fat; 44.2% kcal from carbohydrate; 18.6% kcal from protein)] or a high fat diet [HFD; Harlan Teklad, TD.06414 (60.3% kcal from fat; 27.3% kcal from carbohydrate; 18.4% kcal from protein)] for 21 weeks, starting at 8 weeks of age. All mice were phenotyped as described (Williams et al., 2016) (see Method Details section). At week 29, animals were fasted overnight before sacrifice at 9:00 am. Blood was collected from isoflurane anesthetized mice via the vena cavae, and immediately afterwards the animals were perfused with ice cold PBS, through the left ventricle. Blood was collected in lithium-heparin (LiHep)–coated tubes (Microvette CB 300 Hep-Lithium, Sarstedt) shaken and kept in ice. The blood samples were centrifuged at 4500 revolutions per minute (rpm) for 10 min at 4°C before being flash-frozen in liquid nitrogen. Due to insufficient plasma from all cohorts, lipidomics analysis could be performed only on 44 CD and 34 HFD strains with 2–5 mice/strain.
For in vivo validation of the lipid markers in mice, lipidomics was performed on liver samples from our previous study (Gariani et al., 2016). In brief, male C57BL/6J mice were separated into three groups at the age of 7 weeks. Animal cohorts were fed a CD, a Western high-fat and high-sucrose (HFHS) diet [HFHS; Harlan Teklad, TD.08811, (44.6% kcal from fat; 40.7% kcal from carbohydrate; 14.7% kcal from protein)] or a HFHS diet that was supplemented with NR (400 mg/kg/day) at week 16 till week 25 (9 weeks) (HFHS+NR). Mice were sacrificed after a 4hr fast at 9:00 am. All mice experiments were approved by the Swiss cantonal veterinary authorities of Vaud under licenses 2257, 2257.1 and 2465.
Fatty Acid Composition (%) in the Diet of BXD Cohorts
| Fatty Acids | Symbol | CD | HFD |
|---|---|---|---|
| Palmitic | C16:0 | 0.7 | 8.02 |
| Stearic | C18:0 | 0.2 | 3.93 |
| Oleic | C18:1n9 | 1.2 | 14.68 |
| Linoleic | C18:2n6 | 3.1 | 4.7 |
| Linolenic | C18:3n3 | 0.3 | 0.55 |
| Saturated fat | 0.9 | 12.48 | |
| Monounsaturated fat | 1.3 | 16.05 | |
| Polyunsaturated fat | 3.4 | 5.4 | |
| Total fat | 6.2 | 34.3 |
Human Subjects
Human Study Design and Participants
The prospective cohort consisted of patients aged ≥ 18 years with biopsy-proven NASH and healthy controls who agreed to participate in the study. Prospective sample collection was approved by local Ethic committee of Medical University of Vienna number: 474/2011 (patient), 1022/2013 (controls) and all subjects were included after obtaining written inform consent. Subjects were excluded if they had history of current and past alcohol consumption of more than 20–30 g per day, presence of other liver diseases, secondary causes of NAFLD, medications known to cause fatty liver during the previous 6 months and inability to provide informed consent. Demographic data of all participants (29 males, 15 females) were obtained by structured interview. Their clinical data is provided below. Liver biopsies were evaluated by a board certified pathologist to score for histologic features, according to the histologic scoring system (NAFLD Activity Score) developed by Kleiner et al., (Kleiner et al., 2005). Patients were classified into 3 groups based on fibrosis score: simple steatosis (no fibrosis), early stage NASH (fibrosis stage 1–2), advanced stage NASH (fibrosis stage 3–4).
Human Plasma Biochemistry
Fasting whole blood samples were obtained by venipuncture after an overnight fast of 8 hours or more and processed for plasma within 2 hours on the day of liver biopsy. Routine blood tests were performed at the university hospital of Medical University of Vienna and included measures of ALT, AST, fasting TAG, cholesterol, glucose and insulin. The clinical information of the participants is provided in the table below.
| Healthy | Steatosis | NASH, Early Stage | NASH, Adv. Stage | p-value | |
|---|---|---|---|---|---|
| Age (years) | 27.83 ± 1.64 | 42.14 ± 3.29 | 46.43 ± 3.77 | 58.18 ± 2.78 | a,b,c,e,f |
| Body weight | 65.4 ± 1.92 | 105.14 ± 10.63 | 94.92 ± 4.79 | 111.64 ± 8.90 | a,b,c |
| BMI (Kg/m2) | 21.89 ± 0.50 | 33.91 ± 3.21 | 32.37 ± 1.63 | 36.95 ± 2.79 | a,b,c |
| Fibroscan (kPa) | 4.28 ± 0.28 | 9.03 ± 2.41 | 8.81 ± 1.21 | 19.58 ± 2.88 | c,e,f |
| Steatosis (%) | - | 38.57 ± 7.46 | 64.64 ± 5.70 | 45.45 ± 8.08 | d |
| NAS score | - | 3.29 ± 0.47 | 4.93 ± 0.29 | 4.64 ± 0.48 | d |
| ALT (U/L) | 18.92 ± 1.43 | 50.14 ± 6.97 | 84.79 ± 15.34 | 70 ± 10.98 | b,c |
| AST (U/L) | 22.50 ± 1.31 | 30.29 ± 2.73 | 44.79 ± 5.14 | 72.82 ± 27.52 | c |
| Cholesterol (mg/dl) | 173 ± 11.39 | 204.71 ± 25.37 | 179.21 ± 9.82 | 173.09 ± 9.76 | |
| Triglyceride (mg/dl) | 73.25 ± 7.71 | 190.43 ± 36.18 | 167.14 ± 17.21 | 140.82 ± 2 | a,b |
| Fasting glucose (mg/dl) | 84.08 ± 2.30 | 100.14 ± 6.60 | 138.43 ± 15.81 | 120.18 ± 9.53 | b |
| Fasting insulin (μU/mL) | 6.70 ± 1.11 | 24.33 ± 10.06 | 19.34 ± 1.91 | 23.72 ± 3.16 | a,c |
Subjects: n=44; 12 healthy, 7 steatosis, 14 early stage NASH, 11 adv. Stage NASH Values of mean ± SEM are represented.
p<0.05 from one-way ANOVA with Tukey’s multiple comparison test correction.
Significant difference between groups are indicated as:
between Healthy and Steatosis
between Healthy and NASH, early stage
between Healthy and NASH, Adv. Stage
between Steatosis and NASH, early stage
between Steatosis and NASH, Adv. Stage
between NASH, early stage and NASH, Adv. stage
METHOD DETAILS
Metabolic Phenotyping of BXD Cohorts
Metabolic phenotyping including, OGTT, heart rate, exercise performance test (VO2 max. and activity wheels) and EchoMRI) were performed as described (Williams et al., 2016) and elaborated below.
Oral Glucose Tolerance Test (OGTT)
At 17 weeks of age, after 9 weeks of dietary treatment, all cohorts underwent an oral glucose tolerance test. Mice were fasted overnight before the test, and fasted glucose was tested with a glucometer at the tail vein. Mice were then weighed and given an oral gavage of 20% glucose solution at 10 mL per kg of weight. Glucometer strips were used at 15, 30, 45, 60, 90, 120, 150, and 180 min after the gavage to examine glucose response over time. Blood was also collected at 0 (pregavage), 15, and 30 min to examine insulin levels.
Heart Rate
Two weeks later, at 19 weeks of age, a noninvasive heart rate measurement was performed using a tail-cuff system (BP-2000 Blood Pressure Analysis System, Series II, Visitech Systems) over 4 days. The first 2 days were considered as adaptation to the apparatus, and the second 2 days were used for data analysis, and heart rate measurements were averaged across both days. Outliers on a per-measurement basis were removed, but outlier mice were retained.
Exercise Performance Test
At 23 weeks of age, all mice performed a VO2 max treadmill experiment (pre-training) using the Metabolic Modular Treadmill (Columbus Instruments). For the first 15 min in the machine for each mouse, the treadmill was off while basal respiratory parameters were calculated. The last 2 minutes of data before the treadmill turned on were considered basal levels (most mice spend the first few minutes exploring the device). The treadmill then started at a pace of 4.8 m per minute (m/min), followed by a gradual increase over 60 s to 9 m/min, then 4 min at that pace before increasing to 12 m/min over 60 s, then four min at that pace before increasing to 15 m/min over 60 s, then 4 min at that pace, then the speed increased continuously by 0.015 m per second (or +0.9 m/min) thereafter until the end of the experiment at 63.5 min, 1354.5 m, or when the mouse is exhausted. CD cohorts ran against a 10° incline, whereas HFD cohorts were set at 0°. For this test, no mice reached the maximum distance recorded by the machine—all were taken out when exhausted (considered as inability to run). The distance run, maximum VO2, and maximum RER were recorded. Maximum VO2 and RER were taken by averaging the last ten measurements. Immediately after the treadmill experiment, mice were placed in individual open-air cages with ad libitum access to activity running wheels (Bioseb BIO-ACTIVW-M, Vitrolles, France) for 10 days. For most strains (with some exceptions), all 10 days of activity wheel usage was recorded, for others the average of last 24 hrs was taken. This running distance constitutes the “24hr run distance” phenotype. After the 10th day, at ~25 weeks of age, mice underwent an identical VO2 max treadmill experiment (post-training) as described above at 23 weeks of age. After this experiment, mice were returned to their standard housing cages—individually—for 4 weeks. Mice were fasted overnight before they were sacrificed.
Body Composition (EchoMRI)
In addition to the body weight measurements taken each week and before each phenotyping experiment, body composition was recorded at 16, 23, and 25 weeks of age. To do so, each mouse was placed briefly in an EchoMRI (magnetic resonance imaging) machine (the 3-in-1, EchoMedical Systems), where lean and fat mass are recorded, along with total body weight, taking ~1 min per individual.
All tests were normalized to total body weight in our analyses.
TAG Measurement of BXD Livers
For BXDs, 15μl of the liver lipid extract (same extract as used for liver lipid MS measurement, see companion article [Jha et al., 2018]) was used for TAG quantification using the Serum Triglyceride determination kit (Sigma-Aldrich), as per manufacturer’s instructions. The organic solvent mix used for dissolving lipids for the MS (mixture of acetonitrile (ACN)/isopropyl alcohol (IPA)/water (H2O), (65:30:5, v/v/v, 100μL)) was used as blank and for standard curve.
NAD+ Measurement of C57BL/6J Livers
~20 mg of frozen liver samples were used for NAD+ extraction in 10% perchloric acid and neutralized in 3MK2CO3 on ice. After centrifugation, the supernatant was filtered and the internal standard (NAD-C13) was added and loaded onto a column (150 Å~ 2.1 mm; Kinetex EVO C18, 100 Å). HPLC was run for 1 min at a flow rate of 300 ml/min with 100% buffer A (Methanol/H2O, 80/20% v,v). Then, a linear gradient to 100% buffer B [H2O + 5mM ammonium acetate] was performed (at 1 to 6 min). Buffer B (100%) was maintained for 3 min (at 6 to 9 min), and then a linear gradient back to 100% buffer A (at 9 to 13 min) began. Buffer A was then maintained at 100% until the end (at 13 to 18 min). NAD+ eluted as a sharp peak at 3.3 min and was quantified on the basis of the peak area ratio between NAD+ and the internal standard and normalized to tissue weight.
Plasma Clinical Traits of BXD Cohorts
Plasma parameters were measured on 2 times diluted samples (1:1 ratio of plasma to diluent) using Dimension®Xpand Plus (Siemens Healthcare Diagnostics AG, Dudingen, Switzerland). The biochemical tests were performed according to the manufacturer instructions for each parameters: AST (Siemens Healthcare, DF41A), ALT (Siemens Healthcare, DF143), Glucose (Siemens Healthcare, DF40), HDL (Siemens Healthcare, DF48B), LDL (Siemens Healthcare, DF131), Cholesterol (Siemens Healthcare, DF27), LDH (Siemens Healthcare, DF54), TG (Siemens Healthcare, DF69A) and FFA (FUJIFILM Wako Dignostics, NEFA-HR (2)). Insulin concentration was measured with an ELISA assay kit (Mouse Insulin ELISA Kit; Mercodia).
Clinical traits used for correlation of lipid signatures with metabolic phenotypes in C57BL/6J mice (Figure 6B) were obtained from our previous study (Gariani et al., 2016). BXD metabolic and clinical data can be obtained from (Williams et al., 2016) and also available on GeneNetwork (http://www.genenetwork.org).
Lipidomics Sample Preparation and Analysis
Internal Standards (IS) Used
For BXD plasma samples we used Q6, PC(15:0/15:0), PS(17:0/17:0), PE(15:0/15:0), PA(17:0/17:0), PG(15:0/15:0), CL(56:0) and FA(15:0/15:0) as internal standards. For NAFLD lipid signature validation experiments in mice and human samples (Figure 6), we used the standard mix SPLASH® Lipidomix® Mass Spec Standard | 330707, supplemented with Q6 and CL(56:0).
Extractions
Lipid extraction was performed as previously described (Stefely et al., 2016). In brief, 20 μl of IS was added to 20 μl of thawed plasma samples and vortexed (30 s). Chloroform/methanol (1:1, v/v, 1000 μL) was added and samples vortexed (60 s). Subsequently, hydrochloric acid (1M, 200 μL) was added to induce phase separation, followed by 60 s vortex and centrifugation (3,000 g, 3 min, 4°C) to complete phase separation. 550 μL of the organic phase was dried under Ar2(g). The organic residue was reconstituted in a mixture of acetonitrile (ACN)/isopropyl alcohol (IPA)/water (H2O) (65:30:5, v/v/v, 100μL) by vortexing (60 s) and transferred to a glass vial for LC-MS analysis. Samples were stored at −80° C until further use.
Discovery Lipidomics
LC-MS analysis was performed on an Ascentis Express C18 column (150 mm × 2.1 mm × 2.7 μm particle size, Waters) using an Accela LC Pump (400 μL/min flow rate, Thermo Scientific, San Jose, CA). Mobile Phase A consisted of 10 mM ammonium acetate in ACN/H2O (70:30, v/v) containing 250 μL/L acetic acid. Mobile phase B consisted of 10 mM ammonium acetate in IPA/ACN (90:10, v/v) with the same additives. Mobile phase B started at 2% and increased to 85% over 20 min, then increased to 99% over 1 min and held there for 7 min. The column was reequilibrated for 2 min before the next injection. 10 μL of sample was injected for each run. The LC system was coupled to a Q Exactive mass spectrometer by a HESI II heated ESI source kept at 300°C. The inlet capillary was kept at 300°C, sheath gas was set to 25 units, and auxiliary gas to 10 units. Spray voltage was set to 3,000 V and the MS was operated in polarity switching mode. Ions from 200–1,600 m/z were isolated (Top 2) for fragmentation by stepped higher-energy collisional dissociation (HCD) (20, 30, 40).
Lipid Species Measurement and Normalization
The resulting spectra were processed using LipidSearch (Thermo Scientific), an automated lipid identification and quantification software in which acquired MS2s are compared to a lipid database containing more than 1.5 million lipid ions and their predicted fragment ions. Peaks were detected and lipids identified by comparing their fragmentation to predicted fragmentation pattern (m-score > 25). Results from each sample were aligned (RT tolerance of 0.25 min, c-score >25) and quantified by integration of the MS1 peak. After elimination of all lipids with a grade C or lower, the remaining lipids identity and quantification was verified by manual inspection. Basic quality check and QTL analysis was performed on all datasets normalized differently (normalized to IS, to total lipids and to the lipid class), however, the dataset normalized to total lipids was used for all the analysis and figures shown in this paper due to overall low relative standard deviation in this dataset (data not shown). Normalization to total lipids also has two major advantages over the other normalization methods; 1) all lipids measured did not have a true internal standard, 2) for lipid classes that have few lipid species measured, normalizing to class will be largely driven by one or two highly abundant lipids. Quality assessments of the MS measurements was performed by comparing the reproducibility of the technical and extraction replicates (Figure S1). Note: lipid pairs marked with “_1” and “_2” (TAG 54:5, 54:6 and 58:10) indicate two isobaric peaks. The two peaks are chromatographically separated and consist of unique combinations of fatty acid tails, despite the total number of carbon molecules and double bonds being equivalent.
QUANTIFICATION AND STATISTICAL ANALYSIS
Bioinformatic and Genetic Analyses
Data normality was checked by the Shapiro-Wilk test in R, with a W ≥ 0.90 considered normal distribution. Correlations are Pearson’s r or Spearman’s rho as indicated in the figures. Student’s t-test was used for two groups comparisons in normal data of equal variances, and Welch’s t-test otherwise. Heatmaps were generated using the “heatmap.2” function in R. PCA analysis was performed using “prcomp” function in R. Unweighted correlation network graphs were performed using Spearman correlation, keeping all edges with p-values less than 1e-05 in both CD and HFD in R using the custom package imsbInfer, currently on Github (https://github.com/wolski/imsbInfer). GO-BP pathway enrichment analysis (Figure S5G) was performed using the R package “clusterProfiler” (Yu et al., 2012) (https://bioconductor.org/packages/release/bioc/html/clusterProfiler.html). Enriched pathways after Benjamini-Hochberg correction (p < 0.05) are shown in the figures.
Heritability (h2) was calculated by one-way (CD/HFD) or two-way (Mixed) ANOVA. The variance explained by GxE, diet and unexplained variance (non-dietary, non-genetic) was calculated by two-way ANOVA. QTL calculations were performed using the R/qtl (v 1.39–5) package (Broman et al., 2003) on the log2 transformed data. The BXD genotype used for QTL calculations is provided in the Supplemental Information (Table S8). Parametric QTL calculation was performed for normally distributed lipids and non-parametric QTLs were determined for lipids, those were not normally distributed. QTLs with logarithm of the odds ratio (LOD) score >2.5 and p-value <0.40 were used for all the analysis, which includes both significant (p-value < 0.05) and suggestive QTLs (p-value between 0.05 and 0.40) at genome-wide significant threshold, computed by permutation analysis. [Genome-wide p-values of 0.63 correspond approximately to a local p-value of 0.05, i.e. which is significant in case of prior knowledge used to search for a QTL at that specific location].
All graphs and analyses were either made in R or GraphPad. For R, standard R plotting packages included in gplots or ggplot2—e.g., stripchart, plotCI, and barplot2 were used. Final figures were all prepared with Adobe Illustrator.
QTL Candidate Gene Retrieval
For retrieving lQTL genes, biomaRt was used in R to obtain list of genes located within each QTL region (+/− 5 Mb around the mapped SNP). Genes with nsSNP/ncSNP/indel in BXDs (Wang et al., 2016) under each lQTL with LOD score >2.5 and p-value <0.40 were then filtered and represented in Table S4 and use for all figures and tables reporting lQTL genes.
BXD lQTL and Human GWAS Gene Overlap
Human GWAS genes (having p-value <1e-07) were retrieved from the database GWASdb2 (http://jjwanglab.org/gwasdb) (Li et al., 2016) and complemented with the data from the GWAS Catalog (https://www.ebi.ac.uk/gwas/) (MacArthur et al., 2017). The categories of GWAS gene-sets retrieved from these databases included “Abnormality of lipid metabolism” and “fatty liver disease”. Additionally, published papers reporting the relevant GWAS studies, not included in the above-mentioned databases (in particular, the references indicated by their PMID in Table S5) were manually mined to retrieve the candidate genes having p-value <1e-07. Taken together, the compiled list comprised of 494 genes (Table S5). These GWAS genes were used for searching for their presence under the lQTLs. Only those lQTL genes (± 5 Mb on either side of the peak QTL) having non-synonymous SNPs in BXDs were matched for any evidence of them being associated with abnormal lipid metabolism in human GWAS (i.e. matched for their presence in 494 human GWAS genes).
DATA AND SOFTWARE AVAILABILITY
Raw MS data files are available through the CHORUS project data repository (Project ID 1432, Experiment ID 3219). Additionally, normalized MS data is deposited in GeneNetwork (http://www.genenetwork.org) as a resource for public use. To access and analyze the data in GeneNetwork, choose “Mouse (mm10)” for “Species”, “BXD” for “Group”, “Phenotypes” for “Type”, “BXD Published Phenotype” for “Data Set” and enter “PlasmaLipidomics” for “Get Any”. Normalized MS data (normalized to total lipids) is provided in Table S1. Lipid QTLs are provided in Table S4. Lipid species and metabolic trait correlations is provided in Table S7. BXD genotype data used for QTL calculation is provided in Table S8.
Supplementary Material
KEY RESOURCES TABLE.
| REAGENT or RESOURCE | SOURCE | IDENTIFIER |
|---|---|---|
| Chemicals, Peptides, and Recombinant Proteins | ||
| Q6 internal standard | Avanti Polar Lipids | Cat# 900150 |
| PC(15:0/15:0) internal standard | Avanti Polar Lipids | Cat# 850350P |
| PS(17:0/17:0) internal standard | Avanti Polar Lipids | Cat# 840028P |
| PE(15:0/15:0) internal standard | Avanti Polar Lipids | Cat# 850704P |
| PA(17:0/17:0) internal standard | Avanti Polar Lipids | Cat# 830856P |
| PG(15:0/15:0) internal standard | Avanti Polar Lipids | Cat# 840446P |
| CL(56:0) internal standard | Avanti Polar Lipids | Cat# 750332P |
| FA(15:0/15:0) internal standard, Pentadecanoic Acid | Sigma-Aldrich | Cat# 91446 |
| SPLASH® Lipidomix® Mass Spec Standard | 330707 | Avanti Polar Lipids | Cat# 330707 |
| Critical Commercial Assays | ||
| AST: AST Flex® reagent cartridge | Siemens Healthcare | Cat# DF41A |
| ALT: ALTI Flex® reagent cartridge | Siemens Healthcare | Cat# DF143 |
| LDL: ALDL Flex® reagent cartridge | Siemens Healthcare | Cat# DF131 |
| HDL: AHDL Flex® reagent cartridge | Siemens Healthcare | Cat# DF48B |
| Cholesterol: CHOL Flex® reagent cartridge | Siemens Healthcare | Cat# DF27 |
| Plasma TG: TGL Flex® reagent cartridge | Siemens Healthcare | Cat# DF69A |
| LDH: LDI Flex® reagent cartridge | Siemens Healthcare | Cat# DF54 |
| HR Series NEFA-HR(2) | FUJIFILM Wako Dignostics | http://www.wakodiagnostics.com/r_nefa.html |
| Glucose: GLUC Flex® reagent cartridge | Siemens Healthcare | Cat# DF40 |
| Mercodia Mouse Insulin ELISA kit | Mercodia | Cat# 10-1247-01 |
| Liver TG: Serum Triglyceride Determination Kit | Sigma-Aldrich | Cat#TR0100 |
| Deposited Data | ||
| BXD plasma lipidomics data [raw] | This paper | https://chorusproject.org/anonymous/download/experiment/1b742397d9114a27bcd63b40db2057f2 |
| BXD plasma lipidomics data [normalized] | This paper |
http://www.genenetwork.org/ GN Accession: GN602. RecordIDs 19545–19802 |
| BXD mouse genotype data | http://www.genenetwork.org/ | GN Accession: GN600 |
| BXD mouse metabolic phenotype data | http://www.genenetwork.org/ | GN Accession: GN602 |
| BXD mouse liver transcriptome data | http://www.genenetwork.org/ | GN Accession: GN432 (CD), GN431 (HFD) |
| BXD mouse Subcutaneous WAT transcriptome data | http://www.genenetwork.org/ | GN Accession: GN779 (CD), GN778 (HFD) |
| BXD mouse heart transcriptome data | http://www.genenetwork.org/ | GN Accession: GN485 (CD), GN486 (HFD) |
| BXD mouse quadriceps transcriptome data | http://www.genenetwork.org/ | GN Accession: GN379 (CD), GN380 (HFD) |
| GWASdb2 | (Li et al., 2016) | http://jjwanglab.org/gwasdb |
| GWAS Catalog | (MacArthur et al., 2017) | https://www.ebi.ac.uk/gwas/ |
| Software and Algorithms | ||
| R | The R Foundation | https://www.r-project.org/ |
| MATLAB | Mathworks | https://www.mathworks.com |
| MATLAB Bioinformatics Toolbox | Mathworks | https://www.mathworks.com/products/bioinfo.html |
| corrgram | The R Foundation | https://cran.r-project.org/web/packages/corrgram/index.html |
| R/qtl (v 1.39–5) package | (Broman et al., 2003) | http://www.rqtl.org/ |
| Unweighted correlation network | custom package imsbInfer | Github (https://github.com/wolski/imsbInfer) |
| biomaRt | Bioconductor | http://bioconductor.org/packages/biomaRt/ |
| clusterProfiler | (Yu et al., 2012) | https://bioconductor.org/packages/release/\bioc/html/clusterProfiler.html |
| LipidSearch | Thermo Scientific | https://www.thermofisher.com/order/catalog/product/IQLAAEGABSFAPCMBFK |
| GraphPad Prism 7 | GraphPad | https://www.graphpad.com/ |
| Other | ||
| Q Exactive mass spectrometer, Build 2.3 SP2 | Thermo Scientific | https://www.thermofisher.com/order/catalog/product/IQLAAEGAAPFALGMAZR |
Highlights.
Plasma lipid species have high heritability despite dietary influence
Most lipid species are complex traits regulated by loci spread across the genome
Plasma lipid species across different lipid classes reflect metabolic health status
Specific TAG species can be plasma signatures of NAFLD
ACKNOWLEDGMENTS
We thank Center of Phenogenomics (EPFL) for performing BXD phenotyping and R.W. Williams for BXDs and GeneNetwork maintenance. J.A. is supported by grants from the École Polytechnique Fédérale de Lausanne, the Swiss National Science Foundation (31003A-140780), the AgingX program of the Swiss Initiative for Systems Biology (51RTP0-151019), and the NIH (R01AG043930). D.J.P. is supported by a grant from NIH (R01GM115591). M.T.M. and E.G.W. were supported by NIH fellowships (T32GM007215 and F32GM119190, respectively). J.C. is supported by NIH grants R35GM118110 and P41GM108538. M.T. is supported by grant F3008 from the Austrian Science Foundation.
Footnotes
DECLARATION OF INTERESTS
The authors declare no competing interests.
SUPPLEMENTAL INFORMATION
Supplemental Information includes five figures and eight tables and can be found with this article online at https://doi.org/10.1016/j.cels.2018.05.009.
REFERENCES
- Belknap JK (1998). Effect of within-strain sample size on QTL detection and mapping using recombinant inbred mouse strains. Behav. Genet 28, 29–38. [DOI] [PubMed] [Google Scholar]
- Broman KW, Wu H, Sen S, and Churchill GA (2003). R/qtl: QTL mapping in experimental crosses. Bioinformatics 19, 889–890. [DOI] [PubMed] [Google Scholar]
- Browning JD, Szczepaniak LS, Dobbins R, Nuremberg P, Horton JD, Cohen JC, Grundy SM, and Hobbs HH (2004). Prevalence of hepatic steatosis in an urban population in the United States: impact of ethnicity. Hepatology 40, 1387–1395. [DOI] [PubMed] [Google Scholar]
- Dewey FE, Murray MF, Overton JD, Habegger L, Leader JB, Fetterolf SN, O’Dushlaine C, Van Hout CV, Staples J, Gonzaga-Jauregui C, et al. (2016). Distribution and clinical impact of functional variants in 50,726 whole-exome sequences from the DiscovEHR study. Science 354, 10.1126/science.aaf6814. [DOI] [PubMed] [Google Scholar]
- Diabetes Genetics Initiative of Broad Institute of Harvard and MIT Lund University and Novartis Institutes of BioMedical Research, Saxena R, Voight BF, Lyssenko V, Burtt NP, de Bakker PI, Chen H, Roix JJ, Kathiresan S, Hirschhorn JN, et al. (2007). Genome-wide association analysis identifies loci for type 2 diabetes and triglyceride levels. Science 316, 1331–1336. [DOI] [PubMed] [Google Scholar]
- Dupuis J, Langenberg C, Prokopenko I, Saxena R, Soranzo N, Jackson AU, Wheeler E, Glazer NL, Bouatia-Naji N, Gloyn AL, et al. (2010). New genetic loci implicated in fasting glucose homeostasis and their impact on type 2 diabetes risk. Nat. Genet 42, 105–116. [DOI] [PMC free article] [PubMed] [Google Scholar]
- Fahy E, Subramaniam S, Brown HA, Glass CK, Merrill AH Jr., Murphy RC, Raetz CR, Russell DW, Seyama Y, Shaw W, et al. (2005). A comprehensive classification system for lipids. J. Lipid Res 46, 839–861. [DOI] [PubMed] [Google Scholar]
- Farese RV Jr., Zechner R, Newgard CB, and Walther TC (2012). The problem of establishing relationships between hepatic steatosis and hepatic insulin resistance. Cell Metab. 15, 570–573. [DOI] [PMC free article] [PubMed] [Google Scholar]
- Gariani K, Menzies KJ, Ryu D, Wegner CJ, Wang X, Ropelle ER, Moullan N, Zhang H, Perino A, Lemos V, et al. (2016). Eliciting the mitochondrial unfolded protein response by nicotinamide adenine dinucleotide repletion reverses fatty liver disease in mice. Hepatology 63, 1190–1204. [DOI] [PMC free article] [PubMed] [Google Scholar]
- Haemmerle G, Lass A, Zimmermann R, Gorkiewicz G, Meyer C, Rozman J, Heldmaier G, Maier R, Theussl C, Eder S, et al. (2006). Defective lipolysis and altered energy metabolism in mice lacking adipose triglyceride lipase. Science 312, 734–737. [DOI] [PubMed] [Google Scholar]
- Han X (2016). Lipidomics for studying metabolism. Nat. Rev. Endocrinol 12, 668–679. [DOI] [PubMed] [Google Scholar]
- Hui ST, Parks BW, Org E, Norheim F, Che N, Pan C, Castellani LW, Charugundla S, Dirks DL, Psychogios N, et al. (2015). The genetic architecture of NAFLD among inbred strains of mice. Elife 4, e05607. [DOI] [PMC free article] [PubMed] [Google Scholar]
- Jha P, Claudel T, Baghdasaryan A, Mueller M, Halilbasic E, Das SK, Lass A, Zimmermann R, Zechner R, Hoefler G, et al. (2014). Role of adipose triglyceride lipase (PNPLA2) in protection from hepatic inflammation in mouse models of steatohepatitis and endotoxemia. Hepatology 59, 858–869. [DOI] [PubMed] [Google Scholar]
- Jha P, McDevitt MT, Gupta R, Quiros PM, Williams EG, Gariani K, Sleiman MB, Diserens L, Jochem A, Ulbrich A, et al. (2018). Systems Analyses Reveal Psychological Roles and Genetic Regulators of Liver Lipid Species. Cell Syst. 6 Published online June 27, 2018. 10.1016/j.cels.2018.05.016. [DOI] [PMC free article] [PubMed] [Google Scholar]
- Johansen CT, Kathiresan S, and Hegele RA (2011). Genetic determinants of plasma triglycerides. J. Lipid Res 52, 189–206. [DOI] [PMC free article] [PubMed] [Google Scholar]
- Kang HM, Ahn SH, Choi P, Ko YA, Han SH, Chinga F, Park AS, Tao J, Sharma K, Pullman J, et al. (2015). Defective fatty acid oxidation in renal tubular epithelial cells has a key role in kidney fibrosis development. Nat. Med 21, 37–46. [DOI] [PMC free article] [PubMed] [Google Scholar]
- Kathiresan S, Willer CJ, Peloso GM, Demissie S, Musunuru K, Schadt EE, Kaplan L, Bennett D, Li Y, Tanaka T, et al. (2009). Common variants at 30 loci contribute to polygenic dyslipidemia. Nat. Genet 41, 56–65. [DOI] [PMC free article] [PubMed] [Google Scholar]
- Kirk EA, Moe GL, Caldwell MT, Lernmark JA, Wilson DL, and LeBoeuf RC (1995). Hyper- and hypo-responsiveness to dietary fat and cholesterol among inbred mice: searching for level and variability genes. J. Lipid Res 36, 1522–1532. [PubMed] [Google Scholar]
- Kleiner DE, Brunt EM, Van Natta M, Behling C, Contos MJ, Cummings OW, Ferrell LD, Liu YC, Torbenson MS, Unalp-Arida A, et al. (2005). Design and validation of a histological scoring system for nonalcoholic fatty liver disease. Hepatology 41, 1313–1321. [DOI] [PubMed] [Google Scholar]
- Li MJ, Liu Z, Wang P, Wong MP, Nelson MR, Kocher JP, Yeager M, Sham PC, Chanock SJ, Xia Z, et al. (2016). GWASdb v2: an update database for human genetic variants identified by genome-wide association studies. Nucleic Acids Res. 44, D869–D876. [DOI] [PMC free article] [PubMed] [Google Scholar]
- Lin X, Yue P, Chen Z, and Schonfeld G (2005). Hepatic triglyceride contents are genetically determined in mice: results of a strain survey. Am. J. Physiol. Gastrointest. Liver Physiol 288, G1179–G1189. [DOI] [PubMed] [Google Scholar]
- MacArthur J, Bowler E, Cerezo M, Gil L, Hall P, Hastings E, Junkins H, McMahon A, Milano A, Morales J, et al. (2017). The new NHGRI-EBI Catalog of published genome-wide association studies (GWAS Catalog). Nucleic Acids Res 45, D896–D901. [DOI] [PMC free article] [PubMed] [Google Scholar]
- Manolio TA, Collins FS, Cox NJ, Goldstein DB, Hindorff LA, Hunter DJ, McCarthy MI, Ramos EM, Cardon LR, Chakravarti A, et al. (2009). Finding the missing heritability of complex diseases. Nature 461, 747–753. [DOI] [PMC free article] [PubMed] [Google Scholar]
- Puri P, Wiest MM, Cheung O, Mirshahi F, Sargeant C, Min HK, Contos MJ, Sterling RK, Fuchs M, Zhou H, et al. (2009). The plasma lipidomic signature of nonalcoholic steatohepatitis. Hepatology 50, 1827–1838. [DOI] [PMC free article] [PubMed] [Google Scholar]
- Quehenberger O, and Dennis EA (2011). The human plasma lipidome. N. Engl. J. Med 365, 1812–1823. [DOI] [PMC free article] [PubMed] [Google Scholar]
- Rhee EP, Cheng S, Larson MG, Walford GA, Lewis GD, McCabe E, Yang E, Farrell L, Fox CS, O’Donnell CJ, et al. (2011). Lipid profiling identifies a triacylglycerol signature of insulin resistance and improves diabetes prediction in humans. J. Clin. Invest 121, 1402–1411. [DOI] [PMC free article] [PubMed] [Google Scholar]
- Romeo S, Kozlitina J, Xing C, Pertsemlidis A, Cox D, Pennacchio LA, Boerwinkle E, Cohen JC, and Hobbs HH (2008). Genetic variation in PNPLA3 confers susceptibility to nonalcoholic fatty liver disease. Nat. Genet 40, 1461–1465. [DOI] [PMC free article] [PubMed] [Google Scholar]
- Shin SY, Fauman EB, Petersen AK, Krumsiek J, Santos R, Huang J, Arnold M, Erte I, Forgetta V, Yang TP, et al. (2014). An atlas of genetic influences on human blood metabolites. Nat. Genet 46, 543–550. [DOI] [PMC free article] [PubMed] [Google Scholar]
- Sittig LJ, Carbonetto P, Engel KA, Krauss KS, Barrios-Camacho CM, and Palmer AA (2016). Genetic background limits generalizability of genotype-phenotype relationships. Neuron 91, 1253–1259. [DOI] [PMC free article] [PubMed] [Google Scholar]
- Speliotes EK, Yerges-Armstrong LM, Wu J, Hernaez R, Kim LJ, Palmer CD, Gudnason V, Eiriksdottir G, Garcia ME, Launer LJ, et al. (2011). Genome-wide association analysis identifies variants associated with nonalcoholic fatty liver disease that have distinct effects on metabolic traits. PLoS Genet 7, e1001324. [DOI] [PMC free article] [PubMed] [Google Scholar]
- Stefely JA, Kwiecien NW, Freiberger EC, Richards AL, Jochem A, Rush MJP, Ulbrich A, Robinson KP, Hutchins PD, Veling MT, et al. (2016). Mitochondrial protein functions elucidated by multi-omic mass spectrometry profiling. Nat. Biotechnol 34, 1191–1197. [DOI] [PMC free article] [PubMed] [Google Scholar]
- van der Vusse GJ, van Bilsen M, and Glatz JF (2000). Cardiac fatty acid uptake and transport in health and disease. Cardiovasc. Res 45, 279–293. [DOI] [PubMed] [Google Scholar]
- Wang X, Pandey AK, Mulligan MK, Williams EG, Mozhui K, Li Z, Jovaisaite V, Quarles LD, Xiao Z, Huang J, et al. (2016). Joint mouse-human phenome-wide association to test gene function and disease risk. Nat. Commun 7, 10464. [DOI] [PMC free article] [PubMed] [Google Scholar]
- Willer CJ, Schmidt EM, Sengupta S, Peloso GM, Gustafsson S, Kanoni S, Ganna A, Chen J, Buchkovich ML, Mora S, et al. (2013). Discovery and refinement of loci associated with lipid levels. Nat. Genet 45, 1274–1283. [DOI] [PMC free article] [PubMed] [Google Scholar]
- Williams EG, and Auwerx J (2015). The convergence of systems and reductionist approaches in complex trait analysis. Cell 162, 23–32. [DOI] [PMC free article] [PubMed] [Google Scholar]
- Williams EG, Wu YB, Jha P, Dubuis S, Blattmann P, Argmann CA, Houten SM, Amariuta T, Wolski W, Zamboni N, et al. (2016). Systems proteomics of liver mitochondria function. Science 352, aad0189. [DOI] [PMC free article] [PubMed] [Google Scholar]
- Wong G, Barlow CK, Weir JM, Jowett JB, Magliano DJ, Zimmet P, Shaw J, and Meikle PJ (2013). Inclusion of plasma lipid species improves classification of individuals at risk of type 2 diabetes. PLoS One 8, e76577. [DOI] [PMC free article] [PubMed] [Google Scholar]
- Wu Y, Williams EG, Dubuis S, Mottis A, Jovaisaite V, Houten SM, Argmann CA, Faridi P, Wolski W, Kutalik Z, et al. (2014). Multilayered genetic and omics dissection of mitochondrial activity in a mouse reference population. Cell 158, 1415–1430. [DOI] [PMC free article] [PubMed] [Google Scholar]
- Yu G, Wang LG, Han Y, and He QY (2012). clusterProfiler: an R package for comparing biological themes among gene clusters. OMICS 16, 284–287. [DOI] [PMC free article] [PubMed] [Google Scholar]
- Zhang W, Korstanje R, Thaisz J, Staedtler F, Harttman N, Xu L, Feng M, Yanas L, Yang H, Valdar W, et al. (2012). Genome-wide association mapping of quantitative traits in outbred mice. G3 (Bethesda) 2, 167–174. [DOI] [PMC free article] [PubMed] [Google Scholar]
Associated Data
This section collects any data citations, data availability statements, or supplementary materials included in this article.
Supplementary Materials
Data Availability Statement
Raw MS data files are available through the CHORUS project data repository (Project ID 1432, Experiment ID 3219). Additionally, normalized MS data is deposited in GeneNetwork (http://www.genenetwork.org) as a resource for public use. To access and analyze the data in GeneNetwork, choose “Mouse (mm10)” for “Species”, “BXD” for “Group”, “Phenotypes” for “Type”, “BXD Published Phenotype” for “Data Set” and enter “PlasmaLipidomics” for “Get Any”. Normalized MS data (normalized to total lipids) is provided in Table S1. Lipid QTLs are provided in Table S4. Lipid species and metabolic trait correlations is provided in Table S7. BXD genotype data used for QTL calculation is provided in Table S8.