

Abstract
Hepatocyte lipotoxicity is characterized by aberrant mitochondrial metabolism, which predisposes cells to oxidative stress and apoptosis. Previously, we reported that translocation of calcium from the endoplasmic reticulum to mitochondria of palmitate-treated hepatocytes activates anaplerotic flux from glutamine to α-ketoglutarate (αKG), which subsequently enters the citric acid cycle (CAC) for oxidation. We hypothesized that increased glutamine anaplerosis fuels elevations in CAC flux and oxidative stress following palmitate treatment. To test this hypothesis, primary rat hepatocytes or immortalized H4IIEC3 rat hepatoma cells were treated with lipotoxic levels of palmitate while modulating anaplerotic pathways leading to αKG. We found that culture media supplemented with glutamine, glutamate, or dimethyl-αKG increased palmitate lipotoxicity compared with media that lacked these anaplerotic substrates. Knockdown of glutamate–oxaloacetate transaminase activity significantly reduced the lipotoxic effects of palmitate, whereas knockdown of glutamate dehydrogenase (Glud1) had no effect on palmitate lipotoxicity. 13C flux analysis of H4IIEC3 cells co-treated with palmitate and the pan-transaminase inhibitor aminooxyacetic acid confirmed that reductions in lipotoxic markers were associated with decreases in anaplerosis, CAC flux, and oxygen consumption. Taken together, these results demonstrate that lipotoxic palmitate treatments enhance anaplerosis in cultured rat hepatocytes, causing a shift to aberrant transaminase metabolism that fuels CAC dysregulation and oxidative stress.
Keywords: lipotoxicity, hepatocyte, anaplerosis, glutamine, fatty acid, tricarboxylic acid cycle, TCA cycle, Krebs cycle, fatty liver disease, metabolic flux analysis
Introduction
The liver is a central metabolic hub of the body, regulating glucose, lipid, and amino acid metabolism. Many hepatic pathologies are associated with altered metabolic activities. In particular, nonalcoholic fatty liver disease (NAFLD)5 and nonalcoholic steatohepatitis (NASH), both hepatic manifestations of the metabolic syndrome, are associated with hepatic insulin resistance and altered mitochondrial capacity, including impaired fatty acid oxidation and increased anaplerosis (1–5). Although plasma free fatty acid (FFA) concentrations are often elevated in these pathologies (6, 7), the biochemical mediators and metabolic pathways linking elevated plasma FFAs to mitochondrial metabolic dysfunction are currently unclear. Interestingly, clinical and animal models of NASH and fatty liver have demonstrated significant alterations in plasma amino acid levels in addition to alterations of plasma FFA profiles, suggesting systemic dysregulation of amino acid metabolism (8–10).
Altered plasma glutamine and glutamate levels have been identified previously as markers in patients with metabolic syndrome and NASH (8, 11). In particular, decreases in the ratio between glutamine and glutamate are associated with enhanced systemic glucose intolerance, as glutamate can potentiate the formation of plasma alanine and therefore stimulate gluconeogenesis. Additionally, abnormal glutamatyl dipeptide synthesis has been associated with many liver diseases, including NASH and hepatocellular carcinoma (12). This has been attributed to inefficient synthesis of GSH to combat oxidative stress associated with liver disease. Conversely, it has been hypothesized previously that the NAFLD biomarkers glutamate–pyruvate transaminase (or alanine aminotransferase) and glutamate–oxaloacetate transaminase (GOT or aspartate aminotransferase) may participate in a causative mechanism of fatty liver disease progression (13).
Consistent with the hypothesis that alterations in amino acid metabolism could potentiate disease, in vitro models of lipotoxicity have shown that cultured hepatocytes treated with a lipotoxic load of the saturated fatty acid palmitate are characterized by altered mitochondrial metabolism involving enhanced oxidative flux and increased anaplerosis from glutamine to α-ketoglutarate (αKG) (14–16). Furthermore, supplementing culture media with a mixture of nonessential amino acids (NEAAs) enhanced anaplerotic flux, oxidative stress, and apoptosis markers in the presence of palmitate (14). Glutamate was identified as the single most important NEAA contributing to the observed effects (14). This finding agrees with in vivo studies in mice and humans showing that elevations in intrahepatic lipids are associated with increased mitochondrial anaplerosis and oxidative citric acid cycle (CAC) flux (4, 5). Addition of exogenous antioxidants to cultured hepatocytes did not reverse these metabolic abnormalities, indicating that increased anaplerosis was not simply a response to oxidative stress but could play a causal role in stimulating oxidative metabolism (16). Indeed, reducing anaplerotic flux through inhibition of PEP carboxykinase (PEPCK) or treatment with metformin has been shown to prevent FFA-induced increases in oxidative stress and inflammation both in vitro and in vivo (16, 17).
We have demonstrated previously that addition of the calcium chelator BAPTA to palmitate-treated hepatic cells attenuates mitochondrial oxygen consumption, CAC anaplerosis, and oxidative stress (15). This finding suggests that alterations in intracellular calcium trafficking can predispose mitochondria to an oxidative phenotype that contributes to lipotoxicity. Calcium is a known regulator of αKG dehydrogenase (ADH) as well as the glutamate–aspartate uniporter citrin (SLC25A13), whose action can lead to increased import and oxidation of glutamate by mitochondria. A recent study by Miller et al. (18) showed that glucagon-stimulated calcium release from the endoplasmic reticulum enhances gluconeogenesis from glutamine, which is prevented by knockdown of mitochondrial glutaminase (GLS2). Therefore, we hypothesized that glutamine anaplerosis is up-regulated in response to palmitate treatment and fuels elevations in CAC flux by supplying excess αKG. Therefore, the deregulation of carbon entry to the CAC at the αKG node represents one potential mechanism by which calcium translocation to mitochondria can accelerate lipotoxicity.
To test the hypothesis that anaplerotic flux from glutamine to αKG modulates the severity of palmitate lipotoxicity, we altered extracellular medium concentrations of glutamine, glutamate, and dimethyl-αKG to determine whether the presence of these anaplerotic substrates predisposed hepatocytes to enhanced apoptosis in the presence of lipotoxic concentrations of palmitate. Additionally, we employed pharmacologic inhibition and siRNA-mediated knockdown of the GOT and glutamate dehydrogenase (Glud1) pathways of αKG anaplerosis (Fig. 1). We found that knockdown of GOT activity, but not Glud1, significantly decreased hepatic lipoapoptosis in primary rat hepatocytes and immortalized H4IIEC3 rat hepatoma cells. Pharmacologic inhibition of transaminase metabolism using the pan-transaminase inhibitor aminooxyacetic acid (AOA) attenuated the enhancement of oxygen uptake we have previously reported as a characteristic of palmitate lipotoxicity in hepatocyte cultures (15, 16). Similarly, 13C flux analysis revealed that AOA reduced absolute rates of glutamine anaplerosis and CAC flux compared with cells treated with palmitate alone. Taken together, these results indicate that palmitate treatment stimulates GOT-dependent anaplerosis to supply αKG and downstream CAC intermediates. When uninhibited, this mechanism leads to metabolic dysfunction and oxidative stress associated with hepatocyte lipotoxicity (15, 16).
Figure 1.
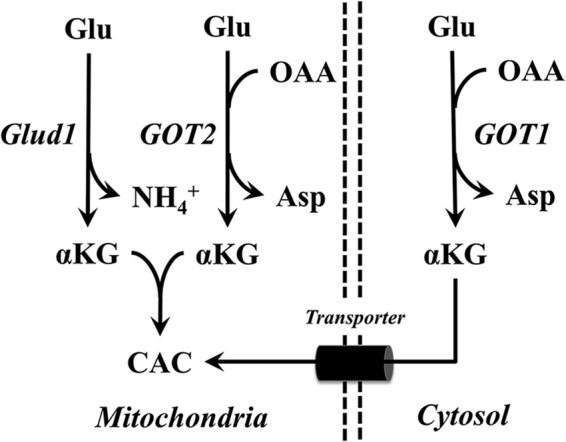
Routes of α-ketoglutarate production leading to CAC anaplerosis. Extracellular glutamine is metabolized in the mitochondria to Glu by the enzyme glutaminase. Glutamate can be metabolized through Glud1 or GOT2 to mitochondrial αKG. Similarly, GOT1 produces cytosolic αKG from Glu, which must then be transported (through a malate/αKG antiporter) across the mitochondrial inner membrane to enter CAC metabolism. The GOT pathways additionally consume OAA and produce Asp.
Results
Extracellular glutamine enhances palmitate lipotoxicity of rat hepatocytes
We have shown previously that glutamine anaplerosis is increased independently of caspase 3/7 activity in palmitate-treated H4IIEC3 cells (19). However, the effects of glutamine removal or replacement on palmitate-induced lipotoxicity have not been systematically assessed. To test whether exogenous glutamine enhances apoptosis, primary rat hepatocytes or H4IIEC3 rat hepatoma cells were treated with 400 μm palmitate in the presence or absence of 2 mm glutamine. Removal of extracellular glutamine attenuated cell death associated with palmitate treatment (Fig. 2A). Additionally, the reduction in palmitate-induced lipotoxicity of H4IIEC3 cells was associated with a reduction in markers of apoptosis (Fig. 2B).
Figure 2.

Removal of extracellular glutamine attenuates lipotoxicity. Primary rat hepatocytes and H4IIEC3 cells were treated with 400 μm PA, either in the presence (2 mm) or absence of Gln. A, cell toxicity assessed by PI fluorescence after 24 h of treatment. B, caspase activity in H4IIEC3 cells after 12 h of treatment. In both panels, measurements are normalized to BSA (vehicle)-treated cells cultured with 2 mm glutamine. Data represent mean ± S.E., n = 4; *, p < 0.05, different from vehicle; †, p < 0.05, different from each other (comparison with cells of the same type).
The metabolic products of glutamine anaplerosis promote lipotoxic cell death of rat hepatocytes
Glutamine can be metabolized via conversion to glutamate and then to the CAC intermediate αKG (Fig. 1). If glutamine fuels lipotoxicity by providing substrates for mitochondrial anaplerosis, then its direct downstream metabolites should also stimulate hepatocyte cell death in response to elevated doses of palmitate. To test this hypothesis, primary rat hepatocytes or H4IIEC3 cells were treated with 400 μm palmitate and incubated with 2 mm glutamine, 2 mm glutamate, or 2 mm α-ketoglutarate (using the cell-permeable analog dimethyl-αKG) for 24 h. H4IIEC3 cells exhibited identical toxicity responses to palmitate under all medium conditions, indicating that these metabolites act as interchangeable substrates for promoting mitochondrial phenotypes associated with lipotoxicity (Fig. 3A). Interestingly, primary hepatocytes exhibited increased lipotoxic cell death when extracellular glutamine was replaced with glutamate or α-ketoglutarate. This trend suggests that primary hepatocytes have enhanced sensitivity to downstream glutamine-derived anaplerotic substrates compared with glutamine itself. This could be due to reduced glutaminase activity in primary hepatocytes, which is needed to convert glutamine to glutamate. Our primary hepatocyte isolation homogenizes the entire liver, producing a mixed population of hepatocytes. However, glutaminase is only expressed in a narrow layer of hepatocytes surrounding the periportal vein (20). This could explain why glutamate and αKG are more synergistic than glutamine in primary hepatocytes (21, 22).
Figure 3.

Effects of replacing medium glutamine with downstream products of glutamine metabolism. A, primary rat hepatocytes or H4IIEC3 cells were treated with 400 μm PA and cultured with 2 mm Gln, Glu, or αKG. Cell death was assessed by PI fluorescence at 24 h. B, relative cell death after 24 h of treatment with palmitate in the presence of 2 mm glutamine or a mixture of 1 mm α-ketoglutarate and 1 mm aspartate (αKG/Asp). In both panels, PI fluorescence of palmitate-treated cells is normalized to BSA (vehicle)-treated cells cultured with 2 mm glutamine. Data represent mean ± S.E., n = 4; *, p < 0.05, different from vehicle; †, p < 0.05, different from each other (comparison with cells of the same type).
Glutamate can produce αKG through direct deamination by Glud1 or through transamination to produce NEAAs such as alanine or aspartate. Of particular interest is the GOT family of enzymes because they play a key role in the malate/aspartate shuttle, a critical redox shuttle whose activity can be influenced by alterations in intracellular calcium (23, 24). GOT catalyzes the conversion of glutamate to αKG via transamination of oxaloacetate to aspartate. Because we previously observed calcium-dependent anaplerosis in palmitate-treated hepatic cells (15), we hypothesized that GOT metabolism could be the primary route of anaplerosis that is up-regulated in response to palmitate treatment. To test this hypothesis, hepatocytes were treated with 400 μm palmitate and provided either extracellular glutamine or a combination of αKG and aspartate. Both primary hepatocytes and H4IIEC3 cells exhibited enhanced lipotoxic cell death when given the mixture of GOT products rather than glutamine alone (Fig. 3B). These results are in agreement with the previous finding that supplementation of exogenous glutamate or mixtures of NEAAs accelerated lipotoxic ROS generation and apoptosis of palmitate-treated H4IIEC3 cells (14).
The GOT family of enzymes promotes lipotoxicity in rat hepatocytes
The observation that products of GOT metabolism enhanced lipotoxicity in both H4IIEC3 cells and primary rat hepatocytes suggests that GOT enzymes play an important role in providing anaplerotic substrates to fuel CAC activation in response to palmitate treatments. Thus, we utilized siRNA to selectively modulate glutamate dehydrogenase or GOT metabolic activities to assess these alternative pathways of glutamate anaplerosis. First, we knocked down mRNA expression of glutamate dehydrogenase using siRNA specific for Glud1 in H4IIEC3 cells. Knockdown of Glud1 had no effect on palmitate-induced apoptosis, indicating that Glud1 is not a primary metabolic pathway that potentiates lipotoxicity in H4IIEC3 cells (Fig. 4A). Next we used siRNA for both the cytosolic and mitochondrial isoforms of GOT, GOT1 and GOT2, respectively. Compared with H4IIEC3 cells treated with a control siRNA (NC1), GOT1 siRNA significantly attenuated caspase activity by ∼25% after 12 h of palmitate treatment (Fig. 4B). Interestingly, GOT2 knockdown attenuated palmitate-induced apoptosis even more effectively than GOT1 knockdown (Fig. 4C). When we repeated these experiments using primary rat hepatocytes, we found that Glud1 and GOT1 knockdown produced no significant improvements in lipotoxicity markers (data not shown), but GOT2 knockdown produced a reduction in palmitate-induced apoptosis that was similar to that observed in H4IIEC3 cells (Fig. 4D).
Figure 4.

GOT activity promotes glutamine-dependent palmitate lipotoxicity. A–C, H4IIEC3 cells were transfected with control siRNA (NC1) or siRNA specific for Glud1 (A), GOT1 (B), or GOT2 (C) and assayed for markers of apoptosis after 12 h of treatment with 400 μm PA. D, primary rat hepatocytes were transfected with control siRNA (NC1) or GOT2 siRNA and assayed for markers of apoptosis after 12 h of treatment with 400 μm PA. All palmitate treatment conditions are normalized to BSA-treated (vehicle) cells transfected with control siRNA. Data represent the mean ± S.E., n = 4; *, p < 0.05, different from vehicle; †, p < 0.05, different from each other.
AOA co-treatment attenuates palmitate-induced cell death and oxygen consumption in H4IIEC3 cells
We have shown previously that lipotoxic concentrations of palmitate induce metabolic dysfunction, characterized by elevated anaplerosis and oxygen consumption flux, in H4IIEC3 cells (19). To further explore the metabolic effects of GOT inhibition, we used the pan-transaminase inhibitor AOA to suppress glutamate-dependent anaplerosis. Co-treatment of H4IIEC3 cells with 400 μm palmitate and 500 μm AOA resulted in a 50% reduction in palmitate-induced cell death (Fig. 5A), which was associated with a proportional reduction in palmitate-induced oxygen consumption (Fig. 5B). These results indicate that the mechanism of AOA-mediated suppression of lipotoxicity may be linked to the ability of AOA to partially reverse mitochondrial metabolic alterations associated with palmitate treatment.
Figure 5.

AOA reduces palmitate-induced cell death and activation of oxidative metabolism. H4IIEC3 cells were treated with 400 μm palmitate in combination with 500 μm of the transaminase inhibitor AOA (PA+AOA) and compared with palmitate-treated (PA) cells. A, cell toxicity was assessed after 24 h of treatment and normalized to BSA (vehicle)-treated conditions. B, oxygen consumption rates of H4IIEC3 cells treated with vehicle, PA, or PA+AOA were measured after 6 h of treatment. Data represent mean ± S.E., n = 4 for toxicity, n = 3 for oxygen uptake; *, p < 0.05, different from vehicle; †, p < 0.05, different from each other.
Transaminase inhibition by AOA reverses palmitate-induced alterations in CAC-associated metabolic flux
To examine how AOA confers resistance to palmitate treatment in H4IIEC3 cells, we performed 13C metabolic flux analysis (MFA) by complete replacement of medium glutamine with the stable isotope tracer [U-13C5]glutamine. Labeled intracellular metabolites were extracted and analyzed for isotopic enrichment using GC-MS. Previously, we observed that palmitate-treated cells incorporated more [U-13C5]glutamine-derived carbon into CAC intermediates (e.g. malate) relative to vehicle-treated cells, as quantified by their atom percent enrichment (APE) (16). AOA co-treated cells exhibited less 13C enrichment in the aspartate pool, indicating that transaminase activity was effectively inhibited (Fig. 6A). Additionally, compared with palmitate-treated cells, the malate enrichment was significantly lower in cells co-treated with AOA. Despite these differences, the isotopic enrichment of the glutamate pool was only modestly decreased, suggesting that glutamate synthesis from extracellular glutamine was largely unaffected by AOA co-treatment. Interestingly, co-treating cells with AOA and palmitate increased the APE of both lactate and PEP compared with cells treated with palmitate alone (Fig. 6B). This indicates a rerouting of cataplerotic flux leaving the CAC via PEPCK.
Figure 6.

Isotopic enrichments of intracellular metabolites indicate flux rerouting in response to AOA treatment. Unlabeled medium glutamine was replaced with [U-13C5]glutamine and used to isotopically enrich H4IIEC3 cells treated with vehicle (BSA), 400 μm PA, or a combination of 400 μm palmitate and 500 μm AOA (PA+AOA). After extraction and GC-MS analysis of intracellular metabolites, mass isotopomer distributions were corrected for natural isotope abundance using the method of Fernandez et al. (34). APE of selected metabolites was calculated using the formula APE = 100% × Σi = 0N (Mi × i)/N, where N is the number of carbon atoms in the metabolite and Mi is the fractional abundance of the ith mass isotopomer of the metabolite. APE provides a measure of the fractional synthesis of a metabolite from the isotope tracer (i.e. glutamine) relative to unlabeled carbon sources (e.g. glucose). The fragment ions analyzed for APE were Glu 432, Mal 419, and Asp 418 (A) and PEP 453 and Lac 261 (B). These ions contain the full carbon backbone of their associated parent metabolites (i.e. N = 5 for glutamate, N = 4 for malate and aspartate, and N = 3 for PEP and lactate). Data represent mean ± S.E., N = 3; *, p < 0.05, different from vehicle; †, p < 0.05, different from each other. N refers to the number of carbons. n refers to the number of replicates.
Next we performed 13C MFA by applying a metabolic model consisting of key glycolytic and CAC reactions (Fig. 7A and Table S1) to regress fluxes from measured isotope labeling patterns of several GC-MS fragment ions (Table S2). The model was constrained by mass balances on all network metabolites, isotopomer balances on all relevant elementary metabolite units, and redox balances on NADH and FADH2. Fluxes were estimated by least squares regression of nine measured mass isotopomer distributions (Figs. S1–S3) in combination with the measured oxygen uptake rates shown in Fig. 5B. We calculated 14 net fluxes for H4IIEC3 cells treated with vehicle, palmitate (PA), or a combination of palmitate and AOA (Tables S3–S5). Consistent with our prior studies (14–16), we observed significant elevations in glutaminase (GLS), citrate synthase (CS), ADH, and malic enzyme (ME) fluxes in response to palmitate treatment (Fig. 7B). AOA co-treatment led to significant reductions in GLS, ADH, and ME fluxes compared with cells treated with palmitate alone, although GLS and ADH fluxes remained elevated compared with vehicle-treated cells. However, no significant difference was observed in the CS flux of cells treated with PA versus PA+AOA, indicating that AOA was not able to reverse all aspects of palmitate-induced CAC dysregulation.
Figure 7.

13C MFA reveals that AOA treatment reduces mitochondrial fluxes and reroutes malic enzyme flux in the presence of palmitate. A, reaction network used for 13C flux analysis. B, absolute intracellular CAC fluxes were determined for H4IIEC3 cells treated with BSA (vehicle), 400 μm palmitate (PA), or a combination of 400 μm palmitate and 500 μm AOA (PA+AOA). C, estimated PK flux under each treatment condition. D, relative fluxes (normalized to PK = 100) demonstrate that AOA co-treatment is associated with enhanced glutamate anaplerosis despite a reduction in absolute mitochondrial fluxes. GDH, glutamate dehydrogenase (includes both GOT and Glud1 activity), IDH, isocitrate dehydrogenase; SDH, succinate dehydrogenase; FUS, fumarase, MDH, malate dehydrogenase, PC, pyruvate carboxylase; PDH, pyruvate dehydrogenase; LDH, lactate dehydrogenase. Error bars indicate 95% confidence intervals. *, p < 0.05, different from vehicle; †, p < 0.05, different from each other (comparison with the same flux across different treatments).
In addition to increasing the utilization of glutamine-derived carbon by enhancing GLS flux, palmitate treatment also increased utilization of glucose-derived carbon, as indicated by elevations in pyruvate kinase (PK) flux (Fig. 7C). Unlike GLS flux, however, PK flux was completely restored to basal levels by AOA co-treatment. Normalizing the intracellular fluxes to PK demonstrated that the palmitate-induced mitochondrial alterations were associated with enhanced glutamine anaplerosis and a decrease in pyruvate carboxylase–dependent CAC anaplerosis (Fig. 7D). Interestingly, although AOA co-treatment reduced absolute CAC fluxes, the relative ratios of GLS/PK, CS/PK, and ADH/PK fluxes were elevated compared with vehicle-treated cells. This observation suggests that the use of glutamine as a carbon source for the CAC remains elevated compared with glucose despite inhibition of transaminase activity by AOA.
Net anaplerotic flux into the CAC must balance net cataplerotic flux leaving the cycle during metabolic steady state (21). In our previous studies (14–16), glutamine carbon entering the CAC as α-ketoglutarate was postulated to leave through either malic enzyme or CO2 production. Here, our updated model includes the PEPCK reaction, which exhibited low flux in both vehicle-treated and palmitate-treated cells, indicating that PEPCK was not the preferred route of cataplerosis in H4IIEC3 cells cultured with abundant glucose and no added hormones (Fig. 7B). Instead, flux through malic enzyme was the main mode of cataplerosis. On the other hand, AOA co-treatment was marked by a significant increase in PEPCK flux compared with cells treated with palmitate alone (Fig. 7, B and D). This partial shift from ME- to PEPCK-dependent cataplerosis could indicate intracellular accumulation of oxaloacetate because of disruption of transaminase metabolism (Fig. 8).
Figure 8.
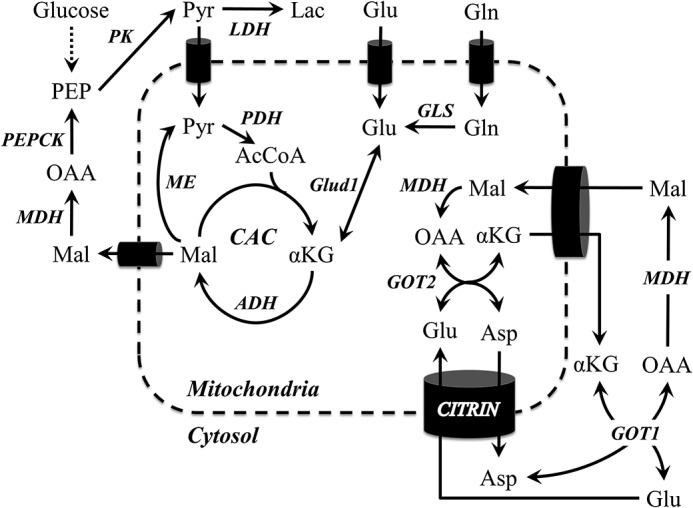
Metabolic pathways and putative mechanisms investigated in this study. Pathways of αKG anaplerosis were inhibited using siRNA and the pharmacological inhibitor AOA. GOT2 metabolism potentiated lipoapoptosis more than other anaplerotic mechanisms. Additionally, simultaneous inhibition of GOT1/GOT2 with AOA suppressed lipotoxic dysregulations of mitochondrial metabolism. Combined with prior work, these results also suggest a possible role for the glutamate/aspartate antiporter citrin and the CAC enzyme ADH, both of which are known to potentiate calcium-stimulated mitochondrial metabolism of glutamate.
Discussion
Hepatic lipotoxicity in H4IIEC3 cells is characterized by enhanced CAC anaplerosis, which can be derived from extracellular glutamine that is abundant in cell culture media and blood plasma (typically higher than any other amino acid) (14, 19). However, it is unclear whether this anaplerotic flux is mediated solely by glutamate dehydrogenase or glutamate transaminase enzymes and whether inhibition of these glutamate-dependent anaplerotic pathways would fully suppress metabolic phenotypes associated with FFA lipotoxicity. In this study, we altered medium glutamine concentrations to define a mechanism by which extracellular glutamine controls the rate of palmitate-induced apoptosis in H4IIEC3 rat hepatoma cells and primary rat hepatocytes. Replacing extracellular glutamine with its downstream metabolic products (e.g. glutamate, α-ketoglutarate, etc.) revealed that glutamine exerts its pro-apoptotic effects by enhancing mitochondrial anaplerosis and not simply through the accumulation of other metabolic byproducts. A similar effect has also been observed in activated macrophages; glutamine deficiency partially rescued cells from palmitate lipotoxicity, whereas addition of α-ketoglutarate to the culture medium restored the lipotoxic effects of palmitate (25). Although a glutamine concentration (2 mm) higher than physiological plasma levels (0.4–0.7 mm) was used in this study, this concentration is consistent with previous lipotoxicity studies of cultured hepatocytes and other cell types (26–28). Additionally, similar results were obtained in a prior study that used physiological concentrations of glutamine (14). A superphysiological glutamine concentration was chosen to avoid glutamine depletion during our experiments, which has been shown to cause a switch in metabolism from glutamine consumption to glutamine secretion at concentrations below 0.4 mm (29).
In this study, inhibition of glutamate conversion to α-ketoglutarate using siRNA specific for Glud1, GOT1, or GOT2 indicated that glutamine enhances palmitate lipotoxicity through GOT activity, primarily through GOT2. Pharmacological transaminase inhibition with AOA confirmed these results and enabled the intracellular fate of glutamine carbon to be traced using [U-13C5]glutamine labeling. Commensurate with a partial rescue in lipotoxic cell death, AOA co-treatment attenuated the metabolic dysregulation caused by palmitate treatment but did not fully restore CAC-associated fluxes to basal levels. Overall, these results demonstrate a novel role for GOT enzymes in promoting palmitate lipotoxicity, which depends on their ability to provide substrates for CAC anaplerosis. Our study also confirms and extends the previous work of Noguchi et al. (14), which found that NEAA supplementation exacerbated the effects of PA treatment to inhibit glycolytic flux, increase CAC flux, and stimulate ROS accumulation in H4IIEC3 cells. In particular, glutamate addition induced ROS generation and apoptosis more effectively than any other single amino acid, suggesting that the stimulatory effects of NEAA supplementation could be due to enhanced glutamate anaplerosis. This study offers further evidence supporting that hypothesis and provides a mechanistic description of the enzymes and pathways involved.
Alterations in amino acid metabolism have been linked to obesity, NAFLD, and NASH (8, 10). In particular, elevated plasma glutamate/glutamine levels have been reported as a potential risk factor for NAFLD. Additionally, in the mouse model of NASH induced by a methionine-choline–deficient diet, increases in plasma glutamate and glutamine were paralleled by increases in liver concentrations of these amino acids (8). The authors attributed these elevations to inhibition of liver gluconeogenesis and CAC metabolism in mice fed a methionine-choline–deficient diet. In contrast, a different study demonstrated that mice fed a high-fat diet developed fatty liver and insulin resistance associated with increases in CAC and gluconeogenic fluxes (4). Our models of lipotoxicity in isolated rat hepatocytes and the H4IIEC3 cell line exhibit similarities with these two in vivo studies. First, palmitate overload induces mitochondrial dysfunction characterized by elevated CAC flux. Second, the presence of elevated glutamine or downstream glutamine-derived metabolites (e.g. glutamate or α-ketoglutarate) synergizes with palmitate to enhance lipotoxicity.
Anaplerosis of α-ketoglutarate into the CAC can occur through Glud1, cytosolic GOT1, and mitochondrial GOT2. To further examine the differences between Glud1 and GOT isoforms, hepatic cells were treated with a combination of α-ketoglutarate and aspartate (metabolic products of the GOT enzymatic reaction). The combined dose of extracellular α-ketoglutarate and aspartate supplied to palmitate-treated cells was more toxic than glutamine alone. We then applied siRNA for Glud1, GOT1, or GOT2 to specifically inhibit these enzymes. Knockdown of GOT1 or GOT2 attenuated palmitate-dependent apoptosis in H4IIEC3 cells, whereas only GOT2 knockdown partially rescued apoptosis in primary rat hepatocytes. The inability of Glud1 to reduce the toxic effects of palmitate indicates that glutamate dehydrogenase likely does not play an important role in glutamate anaplerosis under these conditions. Interestingly, Glud1 activation has been shown to improve hepatic steatosis in mice fed a high-fat, high-fructose diet. It has been proposed that this effect is due to reductive amination, which shunts intermediates away from the CAC and into amino acid synthesis. This opposing role of Glud1 is further evidence that decreased CAC anaplerosis can decrease the effects of lipotoxicity (30).
Both cytosolic GOT1 and mitochondrial GOT2 are reversible reactions that convert an amino acid (glutamate or aspartate) to an α-ketoacid (α-ketoglutarate or oxaloacetate). Additionally, both are involved in the malate–aspartate shuttle, which functions to transport cytosolic reducing equivalents (NADH) to the mitochondria to be used for oxidative phosphorylation (Fig. 8). Therefore, in principle, up-regulated GOT activity can account for the increased oxygen consumption exhibited by palmitate-treated hepatic cells by providing more α-ketoglutarate for CAC oxidative metabolism or by shuttling more reducing equivalents into the mitochondria via the malate–aspartate shuttle. However, the latter mechanism implies a synergy between both GOT1 and GOT2 that we do not observe in our experiments. Although knockdown of either GOT1 or GOT2 attenuated lipotoxicity, GOT1 knockdown had a smaller effect on H4IIEC3 cells and no significant effect in primary rat hepatocytes. This suggests that disruption of GOT2 metabolism during palmitate overload leads to increased net anaplerosis rather than simply an acceleration of substrate cycling between GOT1 and GOT2.
In addition to siRNA-mediated knockdowns, we co-treated hepatic cells with the transaminase inhibitor AOA in the presence of a lipotoxic palmitate load. AOA co-treatment attenuated lipotoxicity to a similar extent as GOT2 knockdown in H4IIEC3 cells. It is important to note that AOA inhibits multiple transaminases, so its impact is not limited to GOT. 13C MFA studies demonstrated that AOA significantly decreased glutamine anaplerosis, oxygen consumption, and ADH flux, all of which are characteristic of palmitate overload in hepatic cells. However, cells co-treated with AOA and palmitate still exhibited elevated mitochondrial fluxes compared with vehicle-treated cells. This failure to completely normalize mitochondrial fluxes with AOA suggests an upstream mechanism that predisposes hepatic cells to a glutamine/glutamate avid state in response to palmitate treatment.
Previously, we demonstrated a novel role for intracellular calcium to promote lipotoxicity by inducing metabolic dysfunction and oxidative stress (15). In that study, co-treating hepatic cells with palmitate and the intracellular calcium chelator BAPTA decreased mitochondrial metabolism, as indicated by reduced oxygen consumption flux and decreased glutamine uptake compared with cells treated with palmitate alone. Additionally, cells co-treated with BAPTA had a reduced equilibration of isotope labeling in the malate and aspartate pools. These results point to a novel putative role for the glutamate–aspartate antiporter citrin to enhance lipotoxicity. The activity of this antiporter is enhanced by elevations in cytosolic calcium, which may increase glutamate entry into the mitochondria in exchange for aspartate (24). Hypothetically, the net result of citrin activation in the context of palmitate lipotoxicity could be an enhancement in oxygen consumption and glutamate anaplerosis as a result of increased substrate supply to GOT2 (Fig. 8). Combined with the observation that the pan-transaminase inhibitor AOA reduced oxygen consumption, aspartate labeling, and overall CAC flux in palmitate-treated cells, we hypothesize that palmitate overload exerts its lipotoxic effects through calcium-dependent activation of mitochondrial glutamate transport and GOT2-dependent anaplerosis, which together fuel elevated CAC metabolism.
One potential limitation of this study is the use of ethanol in the preparation of palmitate–BSA stock solutions. To achieve consistent palmitate concentrations, we found that preparation with ethanol was the best method to ensure complete dissolution of palmitate and avoid its spontaneous precipitation. Although the final ethanol concentration of the palmitate incubations was less than 0.2% by volume, ethanol was still present at a level that could induce metabolic perturbations in hepatocytes because of alcohol dehydrogenase activity (e.g. accumulation of acetate in the culture medium and hyper-reduction of the NADH/NAD+ redox ratio). Despite this potential limitation, our findings are consistent with prior studies that did not use ethanol in their fatty acid solutions (14, 26). In particular, Noguchi et al. (14) performed 13C-glutamine labeling studies in H4IIEC3 cells and also observed elevated CAC flux and increased glutaminolysis in response to palmitate treatments. Furthermore, our vehicle control (BSA) treatments contained the same amount of ethanol as the palmitate treatments. Finally, an experiment to measure the consumption of ethanol by H4IIEC3 cells showed no differences in ethanol time courses between cell-free versus cell-containing incubations and no differences in ethanol or acetate concentrations between cell cultures incubated with vehicle versus palmitate (Fig. S5). These data indicate that the rate of ethanol conversion by H4IIEC3 cells was negligible compared with cell-free controls and that changes in medium acetate concentration cannot explain the metabolic or isotopic alterations observed in response to palmitate treatment. Therefore, we have no evidence that ethanol in our fatty acid stocks was an important determinant of lipotoxicity in our studies. In addition, the use of ethanol to prepare fatty acid solutions is common throughout the lipotoxicity literature (27, 28, 31–34).
The results of our study suggest potential therapeutic strategies to combat the progression of NASH through inhibition of mitochondrial transaminase or glutaminase activities or blocking transport of glutamate and glutamine into liver mitochondria. Interestingly, Miller et al. (18) have recently proposed that inhibition of GLS2 in the liver could provide a new therapeutic avenue to treat hyperglycemia in type 2 diabetes through reduction of calcium-dependent glutamine anaplerosis. Another recent study found that including plasma glutamate concentrations in a noninvasive diagnostic assay of NASH provided a more accurate diagnosis than clinical biomarkers alone (35). Therefore, an improved understanding of how glutamine anaplerosis promotes hepatic lipotoxicity and metabolic dysfunction in the context of obesity could lead to novel therapeutic or diagnostic strategies to treat NAFLD and NASH in the clinic as well as possible dietary interventions to prevent NASH progression.
Experimental procedures
Reagents and chemicals
Dulbecco's modified Eagle's medium (DMEM), AOA, dimethyl-αKG, aspartic acid, glutamic acid, BSA, and palmitate were purchased from Sigma. Propidium iodide was obtained from Invitrogen. Primary hepatocytes were cultured on plates coated with collagen I (rat tail) from BD Biosciences.
Primary rat hepatocyte isolation
Primary hepatocytes were isolated from male Sprague-Dawley rats as described previously (36). The portal vein and inferior vena cava of anesthetized animals were cannulated and perfused with 37 °C oxygenated perfusion medium (pH 7.4) containing 118 mm NaCl, 5.9 mm KCl, 1.2 mm MgSO4, 1.2 mm NaH2PO4, 25 mm NaHCO3, 0.2 mm EGTA, and 5 mm glucose. After 15 min, the liver was excised from the animal and perfused with liver digest medium (Invitrogen). Then the cells were dispersed, washed four times, and suspended in attachment medium, which consisted of high-glucose DMEM supplemented with 30 mg/liter proline, 100 mg/liter ornithine, 0.544 mg/liter ZnCl2, 0.75 mg/liter ZnSO4 7H2O, 0.2 mg/liter CuSO4 5H2O, 0.25 mg/liter MnSO4, 2 g/liter BSA, 5 nm insulin, 100 nm dexamethasone, 100,000 units of penicillin, 100,000 units of streptomycin, and 2 mm glutamine. After 4 h of incubation in the attachment medium, hepatocytes were switched to a maintenance medium identical to the attachment medium except that it had a concentration of 1 nm (instead of 5 nm) insulin.
H4IIEC3 cell culture
The H4IIEC3 rat hepatoma cell line was purchased from the ATCC. Cells were cultured in low-glucose (1 g/liter) DMEM with 10% fetal bovine serum, 1% penicillin/streptomycin antibiotic solution, and a basal glutamine concentration of 2 mm. For measurements of toxicity and apoptosis, cells were plated at a density of 2 × 10⁴ cells/well in a 96-well plate and allowed to grow for 2 days (until confluent) prior to the experiment. Twelve hours prior to other measurements, cells were switched to serum-free, low-glucose DMEM supplemented with Serum Replacement 3 (Sigma).
Preparation of palmitate solutions
Stock solutions were prepared by complexing palmitate to fatty acid free BSA (≥96% pure). Six grams of BSA were allowed to dissolve in 1× PBS and adjusted to a final volume of 30 ml. This 20% BSA solution was dialyzed using a 3.5 K molecular weight cut-off Slide-A-Lyzer G2 Dialysis cassette (Thermo Scientific, Waltham, MA) in a 1× PBS solution. The 1× PBS solution was changed three times a day for 3 days. At the end of dialysis, the BSA concentration was measured, and the solution was adjusted to a final concentration of 10% BSA, sterile-filtered, and aliquoted.
Palmitate was dissolved in pure ethanol at a concentration of 195 mm. This solution was then added to a prewarmed 10% w/w BSA solution (37 °C) to achieve a final palmitate concentration of 3 mm, and this solution was allowed to incubate in a water bath for an additional 10 min. The final ratio of palmitate to BSA was 2:1. All vehicle treatments were prepared using stocks of 10% w/w BSA with an equivalent volume of ethanol added to match the concentration in palmitate stocks. The final concentration of ethanol in all experimental treatments was less than 0.2% by volume. Palmitate concentrations used to induce lipotoxicity were consistent with previous studies (26, 31–33, 37, 38).
Toxicity assays
Losses in cell viability in response to palmitate treatments were assessed using the dead cell stain propidium iodide (PI). The intercalating dye becomes highly fluorescent when bound to exposed dsDNA of dead cells. Fluorescence was assessed using an excitation wavelength of 530 nm and emission wavelength of 645 nm with a BioTek Cytation 3 plate reader.
Caspase activity
Caspase activity was measured as a marker of apoptosis using the Apo-ONE Homogenous Caspase 3/7 Assay Kit. This kit lyses cells in the presence of the caspase 3/7-specific substrate Z-DEVD-R110, which becomes fluorescent when caspases remove the DEVD peptide. We measured fluorescence at an excitation wavelength of 485 nm and emission wavelength of 530 nm with a BioTek Cytation 3 plate reader.
Oxygen consumption
The Oroboros Oxygraph-2k was used to measure oxygen consumption flux as a direct measurement of mitochondrial metabolism. The Oxygraph-2k has two chambers with separate oxygen probes to allow analysis of oxygen consumption of cells in suspension. The instrument was set to a temperature of 37 °C, and the stirring speed for each chamber was 500 rpm. To perform these experiments, H4IIEC3 cells were cultured on 6-cm dishes until 80–90% confluent and subsequently incubated with selected treatments for 6 h. Cells were then trypsinized, counted, and resuspended in the same culture medium and injected into the Oxygraph instrument.
Knockdown of Glud1, GOT1, and GOT2
siRNA oligonucleotides for Glud1, GOT1, and GOT2 were purchased from Integrated DNA Technologies. Cells were treated with 25 nm of selected siRNA complexed to RNAiMAX (Invitrogen) in antibiotic-free DMEM. After 24 h, complex-containing medium was replaced with antibiotic-free DMEM. Following another 24 h, experiments were performed. Knockdown efficiencies used for selection of siRNA targeting sequences are shown in Fig. S4.
Polar metabolite extraction and GC-MS analysis of 13C enrichment
Intracellular metabolites from H4IIEC3 rat hepatomas were extracted as described previously (14). Briefly, intracellular metabolism was quenched with 1 ml of −80 °C methanol, and cells were scraped into a mixture of 1:1:1 chloroform, methanol, and water. After drying the aqueous phase, samples were derivatized with N-methyl-N-(tert-butyldimethylsilyl)trifluoroacetamide + 1% tert-butyldimethylchlorosilane (Pierce). 13C isotopic enrichment was then analyzed with an Agilent 7890A/5975C GC-MS equipped with a 30m DB-35ms capillary column.
13C MFA
13C MFA was performed using the INCA software package (39) by adapting a previously developed model of hepatocyte metabolism comprising glycolysis, CAC, and anaplerotic pathways (19). This model was updated to include the PEPCK-mediated conversion of oxaloacetate to PEP because of significant labeling observed in PEP. Fluxes were estimated a minimum of 50 times starting from random initial values to identify a global best fit solution. When this solution was achieved, a χ2 test was used to assess the goodness of fit. Additionally, 95% confidence intervals were calculated for all estimated fluxes by assessing the sensitivity of the sum-of-squared residuals to parameter variations (40). Comprehensive tables of 13C flux results and a detailed description of our network model and assumptions are available in the Supporting information.
Statistical analysis
Tests for statistical significance were performed using analysis of variance (model I) and Tukey-Kramer methods for multiple comparisons or Student's t test for pairwise comparisons. Plots indicate ± 1 S.E. unless otherwise indicated.
Author contributions
R. A. E., A. K. L., and J. D. Y. conceptualization; R. A. E., A. K. L., S. A. S., and M. S. data curation; R. A. E. and J. D. Y. software; R. A. E., A. K. L., S. A. S., and Y. E. C. formal analysis; R. A. E., M. S., and J. D. Y. supervision; R. A. E. and J. D. Y. funding acquisition; R. A. E., A. K. L., S. A. S., Y. E. C., M. S., and J. D. Y. investigation; R. A. E., A. K. L., and Y. E. C. methodology; R. A. E. and A. K. L. writing-original draft; R. A. E. and J. D. Y. project administration; R. A. E., S. A. S., M. S., and J. D. Y. writing-review and editing; M. S. and J. D. Y. resources.
Supplementary Material
This work was supported by National Science Foundation CAREER Award CBET-0955251 and NIDDK, National Institutes of Health Grant R01 DK106348 (to J. D. Y). The authors declare that they have no conflicts of interest with the contents of this article. The content is solely the responsibility of the authors and does not necessarily represent the official views of the National Institutes of Health.
This article contains Figs. S1–S5, Tables S1–S5, and Methods.
- NAFLD
- nonalcoholic fatty liver disease
- NASH
- nonalcoholic steatohepatitis
- FFA
- free fatty acid
- GOT
- glutamate–oxaloacetate transaminase
- αKG
- α-ketoglutarate
- NEAA
- nonessential amino acid
- CAC
- citric acid cycle
- PEP
- phosphoenolpyruvate
- PEPCK
- phosphoenolpyruvate carboxykinase
- BAPTA
- 1,2-bis(o-aminophenoxy)ethane-N,N,N',N'-tetraacetic acid
- ADH
- α-ketoglutarate dehydrogenase
- ROS
- reactive oxygen species
- AOA
- aminooxyacetic acid
- MFA
- metabolic flux analysis
- APE
- atom percent enrichment
- PA
- palmitate
- GLS
- glutaminase
- CS
- citrate synthase
- ME
- malic enzyme
- PK
- pyruvate kinase
- DMEM
- Dulbecco's modified Eagle's medium
- PI
- propidium iodide.
References
- 1. Serviddio G., Bellanti F., Tamborra R., Rollo T., Romano A. D., Giudetti A. M., Capitanio N., Petrella A., Vendemiale G., and Altomare E. (2008) Alterations of hepatic ATP homeostasis and respiratory chain during development of non-alcoholic steatohepatitis in a rodent model. Eur. J. Clin. Invest. 38, 245–252 10.1111/j.1365-2362.2008.01936.x [DOI] [PubMed] [Google Scholar]
- 2. Perez-Carreras M., Del Hoyo P., Martin M. A., Rubio J. C., Martin A., Castellano G., Colina F., Arenas J., and Solis-Herruzo J. A. (2003) Defective hepatic mitochondrial respiratory chain in patients with nonalcoholic steatohepatitis. Hepatology 38, 999–1007 10.1002/hep.1840380426 [DOI] [PubMed] [Google Scholar]
- 3. Sanyal A. J., Campbell-Sargent C., Mirshahi F., Rizzo W. B., Contos M. J., Sterling R. K., Luketic V. A., Shiffman M. L., and Clore J. N. (2001) Nonalcoholic steatohepatitis: association of insulin resistance and mitochondrial abnormalities. Gastroenterology 120, 1183–1192 10.1053/gast.2001.23256 [DOI] [PubMed] [Google Scholar]
- 4. Satapati S., Sunny N. E., Kucejova B., Fu X., He T. T., Méndez-Lucas A., Shelton J. M., Perales J. C., Browning J. D., and Burgess S. C. (2012) Elevated TCA cycle function in the pathology of diet-induced hepatic insulin resistance and fatty liver. J. Lipid Res. 53, 1080–1092 10.1194/jlr.M023382 [DOI] [PMC free article] [PubMed] [Google Scholar]
- 5. Sunny N. E., Parks E. J., Browning J. D., and Burgess S. C. (2011) Excessive hepatic mitochondrial TCA cycle and gluconeogenesis in humans with nonalcoholic fatty liver disease. Cell Metab. 14, 804–810 10.1016/j.cmet.2011.11.004 [DOI] [PMC free article] [PubMed] [Google Scholar]
- 6. Li Z. Z., Berk M., McIntyre T. M., and Feldstein A. E. (2009) Hepatic lipid partitioning and liver damage in nonalcoholic fatty liver disease: role of stearoyl-CoA desaturase. J. Biol. Chem. 284, 5637–5644 10.1074/jbc.M807616200 [DOI] [PMC free article] [PubMed] [Google Scholar]
- 7. Puri P., Baillie R. A., Wiest M. M., Mirshahi F., Choudhury J., Cheung O., Sargeant C., Contos M. J., Sanyal A. J. A. (2007) Lipidomic analysis of nonalcoholic fatty liver disease. Hepatology 46, 1081–1090 10.1002/hep.21763 [DOI] [PubMed] [Google Scholar]
- 8. Li H., Wang L., Yan X., Liu Q., Yu C., Wei H., Li Y., Zhang X., He F., and Jiang Y. (2011) A proton nuclear magnetic resonance metabonomics approach for biomarker discovery in nonalcoholic fatty liver disease. J. Proteome Res. 10, 2797–2806 10.1021/pr200047c [DOI] [PubMed] [Google Scholar]
- 9. Boulangé C. L., Claus S. P., Chou C. J., Collino S., Montoliu I., Kochhar S., Holmes E., Rezzi S., Nicholson J. K., Dumas M. E., and Martin F.-P. (2013) Early metabolic adaptation in C57BL/6 mice resistant to high fat diet induced weight gain involves an activation of mitochondrial oxidative pathways. J. Proteome Res. 12, 1956–1968 10.1021/pr400051s [DOI] [PubMed] [Google Scholar]
- 10. Newgard C. B., An J., Bain J. R., Muehlbauer M. J., Stevens R. D., Lien L. F., Haqq A. M., Shah S. H., Arlotto M., Slentz C. A., Rochon J., Gallup D., Ilkayeva O., Wenner B. R., Yancy W. S. Jr., et al. (2009) A branched-chain amino acid-related metabolic signature that differentiates obese and lean humans and contributes to insulin resistance. Cell Metab. 9, 311–326 10.1016/j.cmet.2009.02.002 [DOI] [PMC free article] [PubMed] [Google Scholar]
- 11. Cheng S., Rhee E. P., Larson M. G., Lewis G. D., McCabe E. L., Shen D., Palma M. J., Roberts L. D., Dejam A., Souza A. L., Deik A. A., Magnusson M., Fox C. S., O'Donnell C. J., Vasan R. S., et al. (2012) Metabolite profiling identifies pathways associated with metabolic risk in humans. Circulation 125, 2222–2231 10.1161/CIRCULATIONAHA.111.067827 [DOI] [PMC free article] [PubMed] [Google Scholar]
- 12. Soga T., Sugimoto M., Honma M., Mori M., Igarashi K., Kashikura K., Ikeda S., Hirayama A., Yamamoto T., Yoshida H., Otsuka M., Tsuji S., Yatomi Y., Sakuragawa T., Watanabe H., et al. (2011) Serum metabolomics reveals γ-glutamyl dipeptides as biomarkers for discrimination among different forms of liver disease. J. Hepatol. 55, 896–905 10.1016/j.jhep.2011.01.031 [DOI] [PubMed] [Google Scholar]
- 13. Sookoian S., and Pirola C. J. (2012) Alanine and aspartate aminotransferase and glutamine-cycling pathway: their roles in pathogenesis of metabolic syndrome. World J. Gastroenterol. 18, 3775–3781 10.3748/wjg.v18.i29.3775 [DOI] [PMC free article] [PubMed] [Google Scholar]
- 14. Noguchi Y., Young J. D., Aleman J. O., Hansen M. E., Kelleher J. K., and Stephanopoulos G. (2009) Effect of anaplerotic fluxes and amino acid availability on hepatic lipoapoptosis. J. Biol. Chem. 284, 33425–33436 10.1074/jbc.M109.049478 [DOI] [PMC free article] [PubMed] [Google Scholar]
- 15. Egnatchik R. A., Leamy A. K., Jacobson D. A., Shiota M., and Young J. D. (2014) ER calcium release promotes mitochondrial dysfunction and hepatic cell lipotoxicity in response to palmitate overload. Mol. Metab. 3, 544–553 10.1016/j.molmet.2014.05.004 [DOI] [PMC free article] [PubMed] [Google Scholar]
- 16. Egnatchik R. A., Leamy A. K., Noguchi Y., Shiota M., and Young J. D. (2014) Palmitate-induced activation of mitochondrial metabolism promotes oxidative stress and apoptosis in H4IIEC3 rat hepatocytes. Metabolism 63, 283–295 10.1016/j.metabol.2013.10.009 [DOI] [PMC free article] [PubMed] [Google Scholar]
- 17. Satapati S., Kucejova B., Duarte J. A., Fletcher J. A., Reynolds L., Sunny N. E., He T., Nair L. A., Livingston K. A., Fu X., Merritt M. E., Sherry A. D., Malloy C. R., Shelton J. M., Lambert J., et al. (2015) Mitochondrial metabolism mediates oxidative stress and inflammation in fatty liver. J. Clin. Invest. 125, 4447–4462 10.1172/JCI82204 [DOI] [PMC free article] [PubMed] [Google Scholar]
- 18. Miller R. A., Shi Y., Lu W., Pirman D. A., Jatkar A., Blatnik M., Wu H., Cárdenas C., Wan M., Foskett J. K., Park J. O., Zhang Y., Holland W. L., Rabinowitz J. D., and Birnbaum M. J. (2018) Targeting hepatic glutaminase activity to ameliorate hyperglycemia. Nat. Med. 24, 518–524 10.1038/nm.4514 [DOI] [PMC free article] [PubMed] [Google Scholar]
- 19. Egnatchik R. A., Leamy A. K., Noguchi Y., Shiota M., and Young J. D. (2014) Palmitate-induced activation of mitochondrial metabolism promotes oxidative stress and apoptosis in H4IIEC3 rat hepatocytes. Metabolism 63, 283–295 10.1016/j.metabol.2013.10.009 [DOI] [PMC free article] [PubMed] [Google Scholar]
- 20. Cheng X., Kim S. Y., Okamoto H., Xin Y., Yancopoulos G. D., Murphy A. J., and Gromada J. (2018) Glucagon contributes to liver zonation. Proc. Natl. Acad. Sci. U.S.A. 115, E4111–E4119 10.1073/pnas.1721403115 [DOI] [PMC free article] [PubMed] [Google Scholar]
- 21. Brosnan M. E., and Brosnan J. T. (2009) Hepatic glutamate metabolism: a tale of 2 hepatocytes. Am. J. Clin. Nutr. 90, 857S–861S 10.3945/ajcn.2009.27462Z [DOI] [PubMed] [Google Scholar]
- 22. Matsuno T., and Goto I. (1992) Glutaminase and glutamine synthetase activities in human cirrhotic liver and hepatocellular carcinoma. Cancer Res. 52, 1192–1194 [PubMed] [Google Scholar]
- 23. Contreras L., and Satrústegui J. (2009) Calcium signaling in brain mitochondria: interplay of malate aspartate NADH shuttle and calcium uniporter/mitochondrial dehydrogenase pathways. J. Biol. Chem. 284, 7091–7099 10.1074/jbc.M808066200 [DOI] [PMC free article] [PubMed] [Google Scholar]
- 24. Gellerich F. N., Gizatullina Z., Trumbeckaite S., Nguyen H. P., Pallas T., Arandarcikaite O., Vielhaber S., Seppet E., and Striggow F. (2010) The regulation of OXPHOS by extramitochondrial calcium. Biochim. Biophys. Acta 1797, 1018–1027 10.1016/j.bbabio.2010.02.005 [DOI] [PubMed] [Google Scholar]
- 25. He L., Weber K. J., and Schilling J. D. (2016) Glutamine modulates macrophage lipotoxicity. Nutrients 8, 215 10.3390/nu8040215 [DOI] [PMC free article] [PubMed] [Google Scholar]
- 26. Listenberger L. L., Ory D. S., and Schaffer J. E. (2001) Palmitate-induced apoptosis can occur through a ceramide-independent pathway. J. Biol. Chem. 276, 14890–14895 10.1074/jbc.M010286200 [DOI] [PubMed] [Google Scholar]
- 27. Akagi S., Kono N., Ariyama H., Shindou H., Shimizu T., and Arai H. (2016) Lysophosphatidylcholine acyltransferase 1 protects against cytotoxicityinduced by polyunsaturated fatty acids. FASEB J. 30, 2027–2039 10.1096/fj.201500149 [DOI] [PubMed] [Google Scholar]
- 28. Zhao N., Li X., Feng Y., Han J., Feng Z., Li X., and Wen Y. (2018) The nuclear orphan receptor Nur77 alleviates palmitate-induced fat accumulation by down-regulating G0S2 in HepG2 cells. Sci. Rep. 8, 4809 10.1038/s41598-018-23141-8 [DOI] [PMC free article] [PubMed] [Google Scholar] [Retracted]
- 29. Bode B. P. (2001) Recent molecular advances in mammalian glutamine transport. J. Nutr. 131, 2475S–2485S; discussion 2486S–2487S 10.1093/jn/131.9.2475S [DOI] [PubMed] [Google Scholar]
- 30. Han S. J., Choi S. E., Yi S. A., Jung J. G., Jung I. R., Shin M., Kang S., Oh H., Kim H. J., Kim D. J., Kwon J. E., Choi C. S., Lee K. W., and Kang Y. (2016) Glutamate dehydrogenase activator BCH stimulating reductive amination prevents high fat/high fructose diet-induced steatohepatitis and hyperglycemia in C57BL/6J mice. Sci. Rep. 5, 37468 [DOI] [PMC free article] [PubMed] [Google Scholar]
- 31. Holzer R. G., Park E.-J., Li N., Tran H., Chen M., Choi C., Solinas G., and Karin M. (2011) Saturated fatty acids induce c-Src clustering within membrane subdomains leading to JNK activation. Cell 147, 173–184 10.1016/j.cell.2011.08.034 [DOI] [PMC free article] [PubMed] [Google Scholar]
- 32. Cho C.-S., Park H.-W., Ho A., Semple I. A., Kim B., Jang I., Park H., Reilly S., Saltiel A. R., and Lee J. H. (2018) Lipotoxicity induces hepatic protein inclusions through TANK binding kinase 1-mediated p62/sequestosome 1 phosphorylation. Hepatology 68, 1331–1346 10.1002/hep.29742 [DOI] [PMC free article] [PubMed] [Google Scholar]
- 33. Park H.-W., Park H., Semple I. A., Jang I., Ro S.-H., Kim M., Cazares V. A., Stuenkel E. L., Kim J.-J., Kim J. S., and Lee J. H. (2014) Pharmacological correction of obesity-induced autophagy arrest using calcium channel blockers. Nat. Commun. 5, 4834 10.1038/ncomms5834 [DOI] [PMC free article] [PubMed] [Google Scholar]
- 34. Fernandez C. A., Des Rosiers C., Previs S. F., David F., and Brunengraber H. (1996) Correction of 13C mass isotopomer distributions for natural stable isotope abundance. J. Mass Spectrom. 31, 255–262 [DOI] [PubMed] [Google Scholar]
- 35. Zhou Y., Oresic M., Leivonen M., Gopalacharyulu P., Hyysalo J., Arola J., Verrijken A., Francque S., Van Gaal L., Hyotylainen T., and Yki-Jarvinen H. (2016) Noninvasive detection of nonalcoholic steatohepatitis using clinical markers and circulating levels of lipids and metabolites. Clin. Gastroenterol. Hepatol. 14, 1463–1472.e6 10.1016/j.cgh.2016.05.046 [DOI] [PubMed] [Google Scholar]
- 36. Shiota M., Inagami M., Fujimoto Y., Moriyama M., Kimura K., and Sugano T. (1995) Cold acclimation induces zonal heterogeneity in gluconeogenic responses to glucagon in rat liver lobule. Am. J. Physiol. 268, E1184–E1191 [DOI] [PubMed] [Google Scholar]
- 37. Qi Y., Wang W., Chen J., Dai L., Kaczorowski D., Gao X., and Xia P. (2015) Sphingosine kinase 1 protects hepatocytes from lipotoxicity via down-regulations of IRE1α protein expression. J. Biol. Chem. 290, 23282–23290 10.1074/jbc.M115.677542 [DOI] [PMC free article] [PubMed] [Google Scholar]
- 38. Park H.-W., Park H., Ro S.-H., Jang I., Semple I. A., Kim D. N., Kim M., Nam M., Zhang D., Yin L., and Lee J. H. (2014) Hepatoprotective role of Sestrin3 against chronic ER stress. Nat. Commun. 5 10.1038/ncomms5233 [DOI] [PMC free article] [PubMed] [Google Scholar]
- 39. Young J. D. (2014) INCA: a computational platform for isotopically non-stationary metabolic flux analysis. Bioinformatics 30, 1333–1335 10.1093/bioinformatics/btu015 [DOI] [PMC free article] [PubMed] [Google Scholar]
- 40. Antoniewicz M. R., Kelleher J. K., and Stephanopoulos G. (2006) Determination of confidence intervals of metabolic fluxes estimated from stable isotope measurements. Metab. Eng. 8, 324–337 10.1016/j.ymben.2006.01.004 [DOI] [PubMed] [Google Scholar]
Associated Data
This section collects any data citations, data availability statements, or supplementary materials included in this article.