

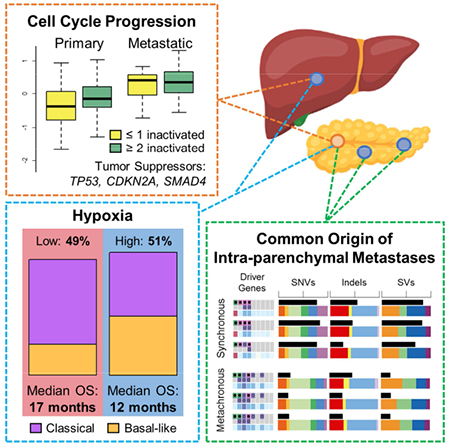
Summary
We integrated clinical, genomic and transcriptomic data from 224 primaries and 95 metastases from 289 patients to characterize progression of pancreatic ductal adenocarcinoma (PDAC). Driver gene alterations, mutational and expression-based signatures were preserved, with truncations, inversions and translocations most conserved. Cell cycle progression (CCP) increased with sequential inactivation of tumor suppressors, yet remained higher in metastases, perhaps driven by cell cycle regulatory gene variants. Half of the cases were hypoxic by expression markers, overlapping with molecular subtypes. Paired tumor heterogeneity showed cancer cell migration by Halstedian progression. Multiple PDAC arising synchronously and metachronously in the same pancreas were actually intra-parenchymal metastases, not independent primary tumors. Established clinical co-variates dominated survival analyses, though CCP and hypoxia may inform clinical practice.
Keywords: pancreatic ductal adenocarcinoma, metastases, mutational signatures, driver genes, cell cycle progression, hypoxia, whole genome sequencing, RNA sequencing
Graphical Abstract
Introduction
Pancreatic ductal adenocarcinoma (PDAC) is projected to be the second leading cause of cancer mortality within a decade (Rahib et al., 2014). Patients with localized, resectable disease have up to 30% survival at five years, whereas those with lymph node metastases and distant disease have only 10% and 3%, respectively (Ryan et al., 2014). Thus, extra-pancreatic metastases is a strong determinant of PDAC outcome. Yet, most genomic studies have characterized resectable disease only, which constitutes less than 20% of cases, as metastases are seldom removed or biopsied, hindering tissue collection.
PDAC studies typically focus on primary tumors, which are often poorly cellular and challenging to sequence. This has been overcome by using samples obtained at rapid autopsy (Iacobuzio-Donahue et al., 2009), by using cell lines (Jones et al., 2008) or xenografts (Yachida et al., 2010, Campbell et al., 2010) to enrich for tumor cells, by bulk sequencing of moderately cellular resected specimens (Biankin et al., 2012, Waddell et al., 2015, Bailey et al., 2016, Witkiewicz et al., 2015), and by deep sequencing of either targeted panels (Cancer Genome Atlas Research, 2017) or the exome (Zehir et al., 2017). The recurrent theme across these studies is that PDAC is dominated by mutations in four driver genes – KRAS, SMAD4, CDKN2A and TP53. Investigation of the roles of these genes in PDAC initiation and progression come largely from genetically engineered mouse models (GEMMs) and early studies of human PDAC. KRAS mutations initiate pancreatic carcinogenesis (Almoguera et al., 1988, Hruban et al., 2000, Hingorani et al., 2003). Concomitant mutations in CDKN2A (Hruban et al., 2000, Moskaluk et al., 1997, Aguirre et al., 2003) or TP53 (Hruban et al., 2000, Hingorani et al., 2005) hasten cancer progression. Inactivation of CDKN2A (Wilentz et al., 1998, Aguirre et al., 2003) or SMAD4 (Izeradjene et al., 2007, Whittle et al., 2015) result in locally destructive disease, TP53 in miliary metastases (Wilentz et al., 2000, Luttges et al., 2001, Hingorani et al., 2005), and concurrent SMAD4 and TP53 in either locally or metastatic dominant disease depending on the number of inactivated SMAD4 alleles (Hruban et al., 2000, Whittle et al., 2015).
Conversely, immunohistochemistry (IHC) of rapid autopsy specimens suggests that SMAD4 loss is associated with primary tumor constraint and metastatic proclivity (Iacobuzio-Donahue et al., 2009). Associations of KRAS activation and SMAD4 loss with clinical outcomes have also been observed (Wang et al., 2017). Thus, there is consensus as to the four principal PDAC drivers, but their patterns of aberration and associations with tumor phenotypes in human primary and metastatic cancers remain ambiguous. Additional studies of gene expression profiles classify PDAC into two (Moffitt et al., 2015), three (Collisson et al., 2011), or four (Bailey et al., 2016) subtypes, and suggest that these may be prognostic for outcome and predictive of therapy response.
There are few studies of PDAC metastases. A rapid autopsy series with serial radiologic evaluations of tumor progression pre-mortem showed growth rates of primaries and metastases are weakly correlated (Haeno et al., 2012). Exome (Yachida et al., 2010), genome (Campbell et al., 2010, Makohon-Moore et al., 2017), and epigenome (McDonald et al., 2017) sequencing of paired primary and metastatic samples from this series demonstrated that most somatic variation in metastases is present in primary subclones, driver gene alterations were concordant (Yachida et al., 2010, Makohon-Moore et al., 2017), and metastasis-specific variation is often in genes of ambiguous functional importance (Makohon-Moore et al., 2017). Yet, all of these studies included paired lesions from only a few patients, and often comprehensively sequenced only one index lesion per patient, followed by targeted sequencing of identified variants in paired tumors, likely underestimating tumor heterogeneity. Comparisons of large numbers of agnostically sequenced paired and unpaired PDAC primaries and metastases have not been performed, though it has proven informative in other malignancies (Yates et al., 2017, Pectasides et al., 2018).
Due to small sample sizes and limited tumor cellularity, previous studies of primary PDAC biology have left unanswered questions how driver gene mutations, gene expression and mutational based subtypes are inter-related, whether these features are inherited by metastases, whether there are somatic alterations enriched in metastases, and whether heterogeneity between primary and metastatic samples is affected by timing and location of metastases. To address these questions, we characterized the whole genome and transcriptome of PDAC samples following tumor cell enrichment from fresh frozen specimens with well-annotated clinicopathologic features.
Results
The study includes 319 PDAC tumors from 289 individuals, including one group of unpaired primary (n=200) and metastatic (70) tumors from 270 patients and a smaller group of paired primaries (24) and metastases (25) from 19 individuals (Figures 1 and 2A, Tables S1 and S2).
Figure 1: Cohort description.
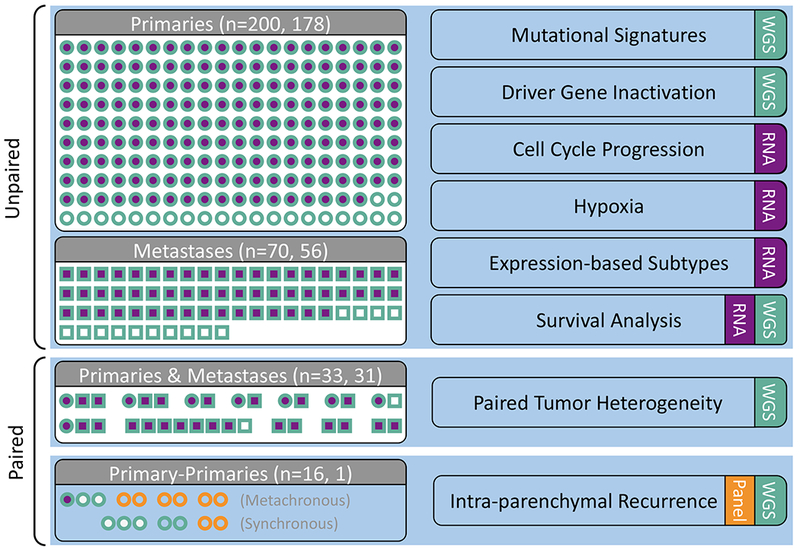
Primary (circles) and metastatic (squares) samples collected from patients with PDAC. WGS (teal) and RNA-seq (purple) were conducted on samples collected from fresh-frozen (FF) tissue. Targeted sequencing (orange) was performed on either FF or FFPE material (n=4 patients). Analyses are indicated on the right hand side. See also Tables S1 and S2.
Figure 2: Mutational signatures and variants in primaries and metastases.
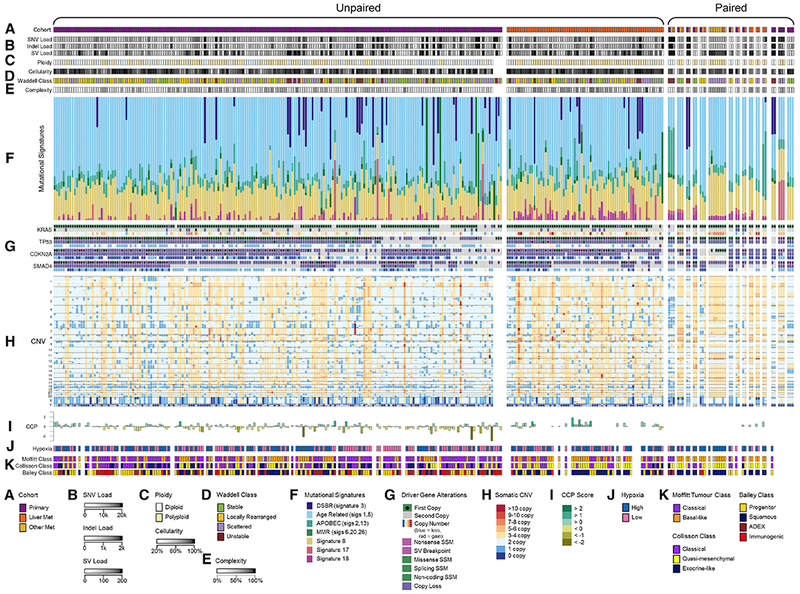
(A) Cohorts, (B) Somatic mutational loads, (C) Ploidy and cellularity, (D) Waddell class, (E) Genomic complexity (the proportion of the tumor’s genome with copy number deviating from its ploidy), (F) Mutational signatures, (G) Driver gene alterations, (H) Copy number variation, (I) Cell cycle progression, (J) Hypoxia expression, (K) RNA subtypes. See also Figure S1.
Mutational Signatures Are Maintained In PDAC Metastases
We detected a median of 6,011 (range: 2,649-452,800) somatic single nucleotide variants (SNVs) and indels in unpaired primaries and a median of 6,284 (3,439-75,930) in unpaired metastases. 65 (1-813) and 93 (7-652) structural variants (SVs) per genome were identified in unpaired primaries and metastases, respectively (Figure 2B). SNV and SV loads were consistent between paired samples (Figures S1A and S1B). We used MutSigCV and dNdScv to identify genes mutated more often than expected by non-silent SNVs or indels. We found KRAS (89%), TP53 (80%), CDKN2A (26%), SMAD4 (25%), ARID1A (9%), KDM6A (5%), RNF43 (5%), TGFBR2 (3%), NRAS (1%) with both tools and GNAS (4%), MAP3K21 (3%), BRAF (3%), SMARCA4 (3%), ACVR2A (2%), ACVR1B (2%), FAM133A (<1%), ZMAT2 (<1%) with either tool, largely concordant with previous work (Jones et al., 2008, Biankin et al., 2012) (Witkiewicz et al., 2015, Waddell et al., 2015, Bailey et al., 2016), and none more frequently in primaries or metastases. Most of the mutations in oncogenes were established gain of function variants, including KRAS (247 of 247), GNAS (11 of 11), BRAF (6 of 8) and NRAS (1 of 3). One additional NRAS variant (p.A146T) may also be activating. Notably, tumors bearing activating BRAF or NRAS variants did not possess KRAS mutations; this was also true in 5 of 11 GNAS positive tumors. The BRAF and GNAS findings are concordant with previous work (Cancer Genome Atlas Research, 2017).
Ploidy was greater in metastases than in primaries (p = 0.00025; Figures 2C and 3), even when accounting for greater metastasis cellularity (p = 0.0003; Figures 2C and 3) in a linear model, but not qualitatively in paired samples (Figure S1C). Proportions of four structural variant classes previously described (Waddell et al., 2015) did not differ in unpaired primaries and metastases (p = 0.6; Figures 2D and 3). Genomic complexity (the proportion of a tumor’s genome with copy number deviating from its ploidy; Figure 2E) was found to be higher in metastatic polyploid tumors when compared to polyploid primaries (p = 0.013, data not shown), which is likely a consequence of increased genomic instability in metastatic tumors, as they also display a non-significant trend towards increased structural variant burden (p = 0.078, data not shown).
Figure 3: Mutational signatures, variants and classes in unpaired primaries and metastases.
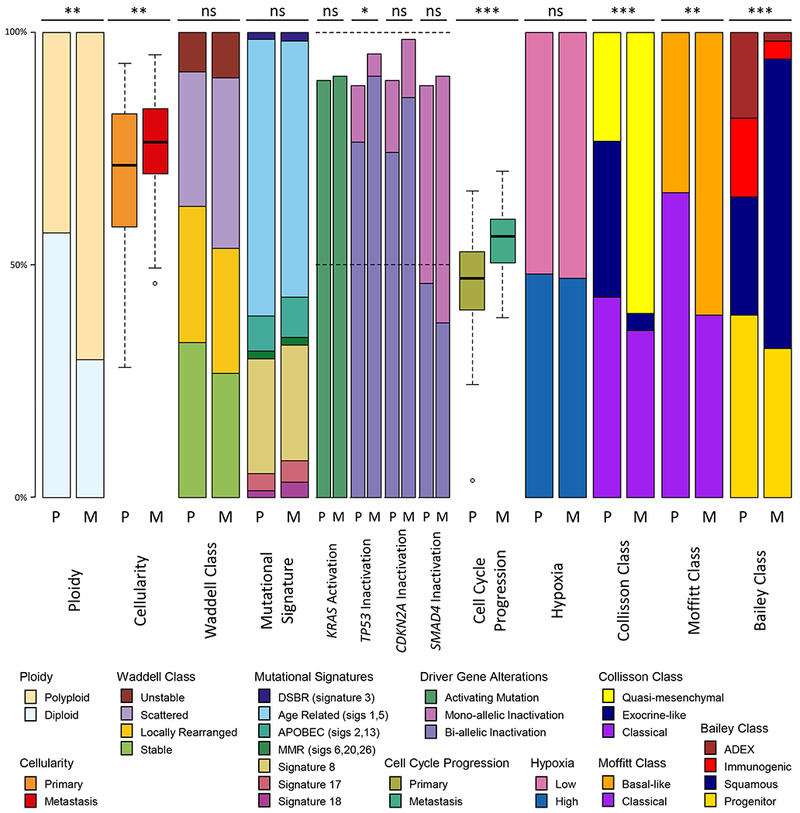
Proportions of ploidy, cellularity, Waddell class, somatic mutational signatures, driver gene mutation rates, cell cycle progression (CCP), hypoxia, expression-based subtypes between unpaired primary tumors (P) and liver metastases (M). CCP ranges from −3 to 3, all other values range from 0 to 100%. Statistical tests: Wilcoxon rank sum test for cellularity, ploidy and CCP, Likelihood ratio test for somatic mutational signatures, Fisher’s exact test for Waddell class, driver gene alterations, hypoxia, and expression based subtypes. Statistical significance is shown (ns, non-significant, * p<0.05, ** p<0.01, *** p<0.001). Box plots depict the upper and lower quartiles, with the mean shown as a solid line; whiskers indicate the 1.5 times interquartile range (IQR). Data points outside the IQR are shown. See also Figure S4.
Consistent with our previous work (Connor et al., 2017, Grant et al., 2018), we found 36 carriers of germline PDAC predisposition variants (Connor and Gallinger, 2015) representing 13% of the unpaired cohorts, including 1 APC, 2 ATM, 7 BRCA1, 18 BRCA2, 3 CDKN2A, 2 MLH1, 2 MSH6, and 1 PALB2, though these cohorts were not chosen with the intent of determining germline population frequencies.
We applied non-negative least squares linear models to deconvolute mutational signatures in primary and metastatic PDAC (Figure 2F) from base substitutions. Signatures 1 (“age-related”) and 3 (double-strand-break-repair “DSBR” deficient) were dominant. Proportions of signatures in unpaired primaries and metastases did not differ significantly (Figure 3) and were highly conserved in paired samples from the same individuals (Figure 2F). Thus, mutational processes in primaries are maintained in metastases, and each PDAC harnesses only few mutational processes that contribute in equal proportions to genomic variation over time, as seen in breast cancer (Yates et al., 2017). Similarly, signatures did not vary in 3 pairs of liver metastases biopsied before and after receipt of systemic chemotherapy, implying treatment does not induce somatic mutations in distinct patterns.
PDAC Driver Genes Are Inactivated More Frequently In Tumors Dominated By The Age Related Mutational Signature
To compare driver gene events in primaries and metastases, we identified mono- and bi-allelic somatic mutations revealed by whole genome sequencing (WGS), including point mutations, SVs and copy number variation. In the unpaired cohort, TP53 bi-allelic loss was most common (~65%), followed by CDKN2A (~60%) then SMAD4 (~40%) (Figures 2G and 4). Frequencies of neither mono- nor bi-allelic somatic events differed significantly in primaries and metastases after excluding mismatch repair deficient hypermutated tumors, though there was a trend towards increased TP53 loss in metastases (Figures 3, 4A, and 4B). GISTIC identified 109 copy number events in the unpaired cohort as recurrent (Figure 2H). Two amplifications (including KRAS) and four deletions were significantly more frequent in metastases (Figure 4C; Table S3). In 15 paired samples, a minority were discordant for bi-allelic inactivation of CDKN2A (n=3 pairs), SMAD4 (n=2 pairs) and TP53 (n=1 pair), similar to what has been reported in multifocal breast (Yates et al., 2015) and renal (Gerlinger et al., 2012) cancers. The paired tumor retaining a copy of the driver gene was not consistently a primary or metastasis. Thus, driver gene events occur in approximately equal frequency in PDAC primaries and metastases, and differ in only a minority of paired cases, implying that they are acquired in primary tumors prior to and are not late drivers of metastases. Bi-allelic inactivation was strongly associated with reduced driver gene expression in the paired and unpaired cohorts (FDR < 0.008), validating our two-hit approach.
Figure 4: Frequency of inactivation and copy number changes in primaries and metastases.
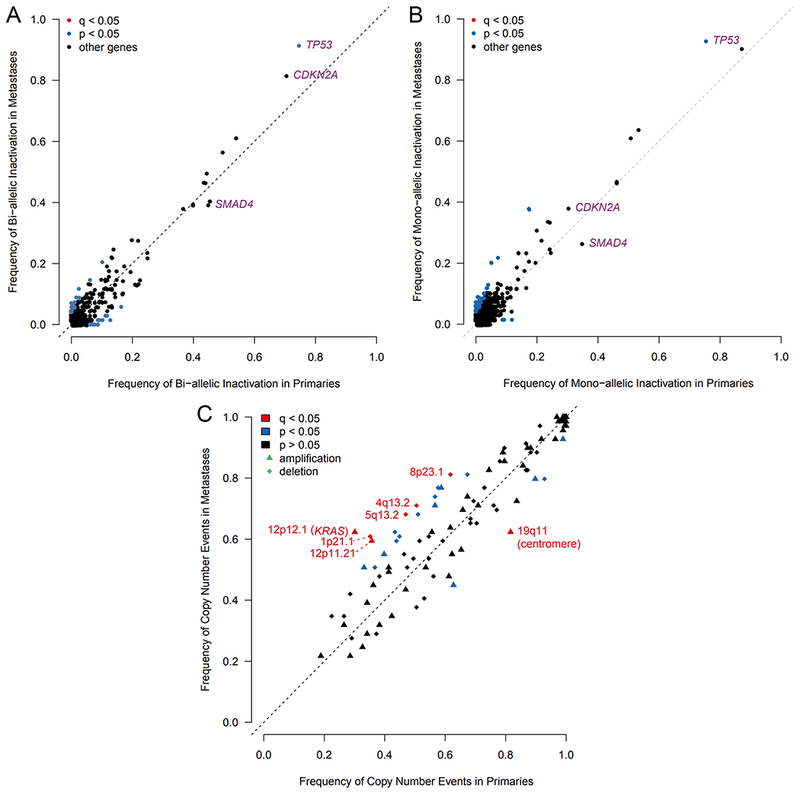
(A-B) Frequency of bi-allelic (A) and mono-allelic (B) inactivation of all genes, excluding hypermutated tumors. (C) Frequency of recurrent copy number events detected by GISTIC. See also Table S3.
Primary and metastatic tumors with age-related signatures had bi-allelic inactivations occurring more frequently in combination than individually, whereas primary tumors with DSBR signatures more often bore single driver gene inactivation, or were wild type (p=0.026, chi-squared test) (Figure 5A). This trend was replicated in a separate cohort of resected primary PDAC data from the ICGC (Waddell et al., 2015) (Figure 5B). DSBR tumors had significantly more frequent bi-allelic inactivations of other genes whose roles in PDAC carcinogenesis are not known (Figure 5C), including most prominently FAM72C. Of 6 tumors with DNA mismatch repair deficiency, 2 had bi-allelic inactivation of CDKN2A only. Loss of TP53, CDKN2A, or SMAD4 were not associated with pathologic co-variates of AJCC stage and histologic grade.
Figure 5: Driver gene inactivation, dominant mutational signature and cell cycle progression.
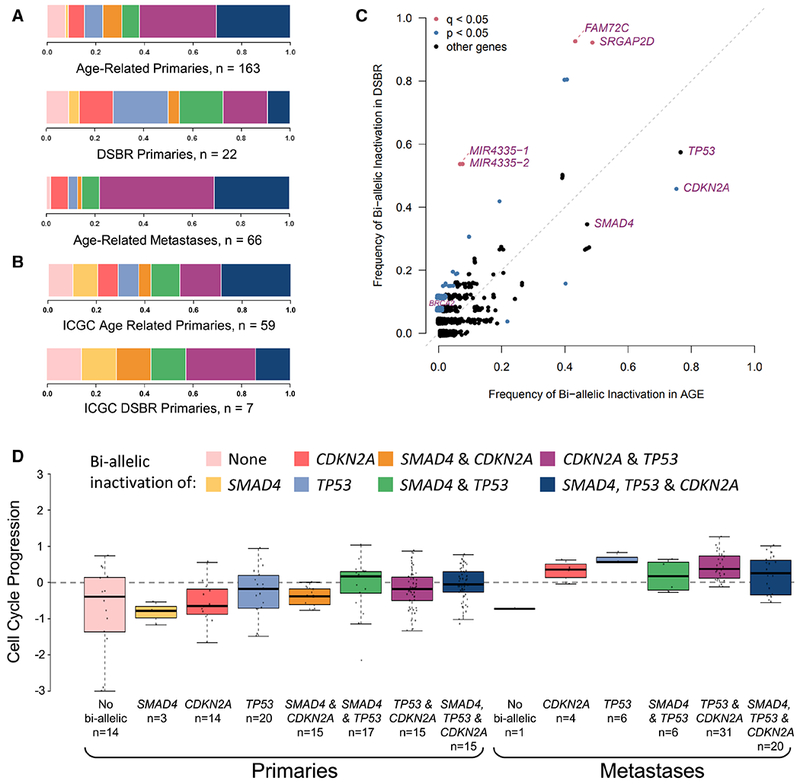
(A-B) Combinations of bi-allelic inactivation of SMAD4, CDKN2A and TP53 in age-related primary tumors, DSBR-related primary tumors, and age-related metastases (A) and in age-related and DSBR-related primaries from the ICGC dataset (B). (C) Frequency of bi-allelic inactivation in age-related vs DSBR primaries. (D) CCP in primary and metastatic tumors with different combinations of bi-allelic inactivation. Box plots depict the upper and lower quartiles, with the mean shown as a solid line; whiskers indicate the 1.5 times interquartile range (IQR). Data points outside the IQR are shown. See also Figures S2 and S3.
These results suggest that there is no discrete gene mutated with high frequency late in tumor evolution. Driver gene inactivation is concordant in primaries and metastases but varies considerably with mutational processes. This prompted us to search for other associations of driver genes with PDAC biology.
Cell Cycle Progression Is Associated With Driver Gene Inactivation, Metastases And Therapeutic Response
As TP53, CDKN2A and SMAD4 are involved in cell cycle regulation, we contrasted their inactivation with rates of CCP. We used a validated 31 gene expression score (Kumar et al., 2016, Cuzick et al., 2011) to estimate the rate of tumor CCP from transcriptomes (Figure S2A. This score was proportional to Ki-67 expression by both RNA-seq and IHC (adjusted R2 = 0.75, 0.19, respectively), independent of cellularity and tumor ploidy (p>0.5), and highly concordant with expression of Reactome and Kegg cell cycle gene sets (Smid et al., 2016) (adjusted R2 > 0.35) in both unpaired primaries and metastases. The correlation of CCP with Ki-67 IHC is relatively low compared with Ki-67 RNA-seq. This may be related to longer ischemic times, and the lack of tumor enrichment by laser capture microdissection, in the formalin fixed paraffin embedded (FFPE) tissue used for IHC, compared with snap-frozen tissue used for RNA-seq. Ki-67 IHC staining was observed almost exclusively in the tumor compartment, with stromal cells contributing only 0-2% of total Ki-67 staining. This implies that the CCP score calculated from RNA-seq from tumor-cell enriched samples almost exclusively reflects the tumor compartment.
Accumulating bi-allelic loss of driver genes resulted in stepwise increases in CCP in primary PDAC (Figure 5D) (p = 0.0083, Kruskal-Wallis test), mirroring findings from murine models (Whittle et al., 2015). CCP was also markedly greater in metastases than primaries (Figures 2I and 3) (p = 7.8 × 10⁻¹⁰, Wilcoxon test) and lowest in normal pancreas (n=5) and liver (n=3) (Figure S2A). We identified pathways with increased SNV burden in metastases compared to primaries, correcting for the total number of SNVs. A cell cycle pathway (Reactome: cell cycle, mitotic) was among the most significant findings at FDR <= 25% (Figure S2B). Specifically, missense variants in cell cycle pathway genes were greater in metastases (logistic regression Wald p value = 0.0027, coefficient beta = 0.57), whereas nonsense variants displayed a non-significant opposite trend (p value = 0.5733, beta = −0.11), suggesting the former may have gain-of-function effects (Figure S3A), but this requires validation and experimental evaluation. Affected pathway genes include those encoding the replication licensing complex (CDT1), centromeric proteins (CENPs), Histone H2B proteins, anaphase promoting complex (ANAP) and minichromosome maintenance complex (MCM) components (Figure S2B).
As 6 of our 11 paired cases with RNA-seq were obtained post-mortem, we could not reliably interpret their CCP measurements (Figure S3B). The remaining 5 cases were sampled and sequenced before and after receipt of chemotherapy. In the 4 cases that progressed on therapy, the CCP increased in the second specimen, whereas it noticeably decreased in the 1 case that responded to treatment (Figure S3B). To validate this observation, we compared CCP scores in 11 primary tumors resected after use of neoadjuvant therapy with available RECIST response rates, standardized criteria for evaluating solid tumor responses (Therasse et al., 2000), again finding that CCP was lower in tumors that responded to therapy (Figure S3C), although this did not reach statistical significance, likely owing to the small sample size.
In breast cancer, CCP has been associated with overall somatic mutation burden and mutational signatures 2, 3 and 13 (Smid et al., 2016). In our data, CCP was associated with somatic single nucleotide variants attributed to Signature 13, the APOBEC family of cytosine deaminases and REV1, and with burdens of deletion and inversion structural variants in age-related primaries.
Thus, CCP is associated with driver gene loss, is greater in metastases, and corresponds with treatment response.
Half Of Pancreatic Cancers Are Hypoxic, Independent Of Driver Gene Inactivation
As rapid cell progression can lead to localized hypoxia, we used a scoring system derived from 76 validated hypoxia genes (Harris et al., 2015, Favaro et al., 2011, Koong et al., 2000, Sorensen et al., 2010, Toustrup et al., 2011, Chi et al., 2006, Buffa et al., 2010) to stratify PDAC transcriptomes. Approximately half of the unpaired primaries and metastases were hypoxic (Figures 2J and 3), and none of 8 normal specimens sequenced for comparison (data not shown). Hypoxia was also concordant in 7 of 11 paired cases (Figure S4A). Two discordant cases were obtained post-mortem, possibly complicating their hypoxia scores. Equal proportions and close concordance in primaries and metastases implies that hypoxia is an inherent feature of PDAC biology rather than a consequence of its microenvironment. Our hypoxia gene expression score was not associated with CCP, pathologic co-variates, mutational signatures, tumor cellularity or ploidy (Figures S4B-D), or with inactivation of any gene by point mutations or SVs, although there was a trend for higher frequency of TP53 bi-allelic loss in the hypoxic group (Figure S4E).
RNA-seq Subtypes With Poor Prognosis Are Associated With Hypoxia
As hypoxia appears intrinsic to half of PDAC, we compared it with three recently described transcriptomic subtypes (Collisson et al., 2011, Moffitt et al., 2015, Bailey et al., 2016; Figure 2K). Hypoxia was enriched in the worst prognosis classes, namely basal by Moffitt and squamous by Bailey (Figure S5A). Given our large, high resolution PDAC RNA-seq dataset, we explored the relationship between these three expression-based classifications, finding significant overlap (Figure S5B), as reported by the TCGA (Cancer Genome Atlas Research, 2017). However, Bailey ADEX and immunogenic subtypes had lower tumor cellularity and CCP (p < 9.7 ×10⁻⁵). The Moffitt types were independent of these and were prognostic in our dataset (see below), implying that the Moffitt classification may better represent tumor biology, as we noted in a prospective study of advanced PDAC (Aung et al., 2018). The Moffitt subtypes were not associated with bi-allelic gene loss (Figure S5C).
Expression-based subtypes are independent of the dominant mutational signatures in PDAC, as we previously reported in a smaller cohort (Connor et al., 2017), and pathologic co-variates. The poor prognostic subtypes of each classification system were significantly over-represented among metastases (Figure 3). However, in the paired cohort, only 2 of 11 cases showed discordant Moffitt subtypes between primary and metastatic tumors (Figure S5D). As most unpaired metastases were obtained by liver biopsy in advanced disease, they may be enriched with patients with poor PDAC biology. It seems less likely that expression-based subtypes change between parent and daughter lesions. We next examined our paired cases in greater detail.
Paired Tumor Heterogeneity Is Independent Of Dominant Mutational Signatures Or Expression-Based Subtypes
Our paired cohort included 8 cases with WGS of a primary tumor and at least one metastasis, 1 case with eight metastases, and 3 cases with multiple primaries (Figure 1). We computationally and manually verified point and structural mutations in paired tumors to minimize false negative calls. To quantify heterogeneity between primary and metastases pairs, we calculated the ratio of clonal to subclonal mutations or structural alterations per sample as previously described [Jaccard Index, (Makohon-Moore et al., 2017) (Yates et al., 2015)].
The degree of heterogeneity varied across tumor pairs and mutation classes. Truncating mutations (stopgains, frameshifts, splicing) were most conserved (Figure 6A). Interestingly, non-silent coding (missense, non-frameshift) and non-coding (promoters, enhancers, long RNAs) mutations were equally conserved, implying the latter play underappreciated roles in PDAC biology (Feigin et al., 2017). In tumor pairs with the same ploidy, 0.3-40% of private somatic calls were associated with copy number loss, rising to 22-81% in pairs with differing ploidies. Among structural variants, inversions and translocations were more conserved between tumor pairs than deletions and duplications (Figure 6B), as has been previously described in PDAC with implications that these variants are relevant to carcinogenesis (Campbell et al., 2010).
Figure 6: Paired tumoral heterogeneity.
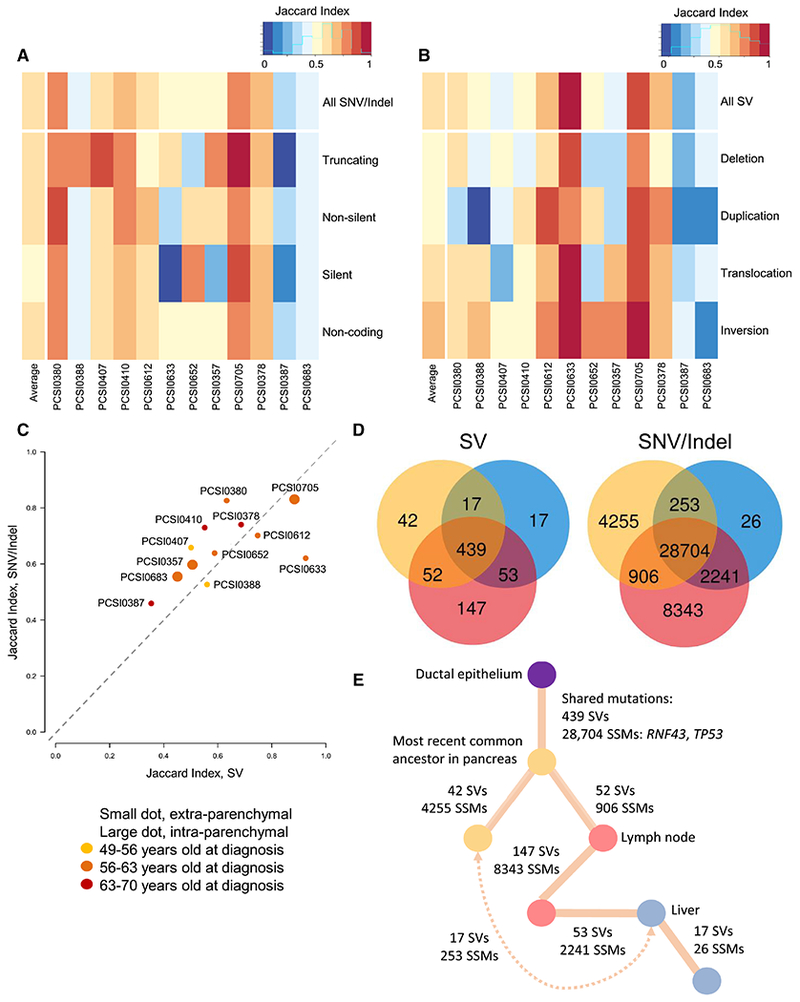
(A-B) Heatmap of Jaccard Indices for SNVs and indels (A) and SVs (B) stratified by mutation type. (C) Scatterplot of Jaccard Indices for average simple (y-axis) and structural (x-axis) variation for each tumor pair, colored by age at diagnosis. (D-E) Tumor heterogeneity in PCSI_0378 with Venn diagrams showing shared burden of structural (left) and SNV/indels (right) (D), with inferred phylogeny (E). Note: this case has a strong DSBR signature. See also Figures S6 and S7.
We stratified the 12 pairs by dominant mutational signature, histologic grade, age at diagnosis, expression-based subtype, hypoxia and CCP score of primary tumors, yet no feature was qualitatively associated with our heterogeneity metric (Figures 6C and S6).
Comparisons of SNVs/indels and SVs across cases with three sequenced tumors, including one primary, one peri-pancreatic lymph node and one liver metastasis, showed numerous shared mutations between the primary and the lymph node, and the lymph node and the liver metastasis, but relatively less sharing between the primary and the liver metastasis (Figures 6D, 6E and S7). This is compatible with the Halstedian concept of sequential progression of tumor cells from primary to lymph node to distant metastases, and accounts for the well-established clinical correlation between lymphatic and distant disease. This differs from what was described in colorectal cancer (Naxerova et al., 2017), where lymph node and distant lesions originated independently in two thirds of cases. The small admixture observed between PDAC primary and liver sites implies subclonal “reseeding” in late stage disease prior to autopsy, as described in prostate (Gundem et al., 2015) and ovarian cancer (McPherson et al., 2016).
To map subclone spread, we ran PyClone on coding mutations, which largely remained clonal from primaries to metastases, in agreement with other studies (Makohon-Moore et al., 2017). Only two cases (PCSI0378 and PCSI0652) showed shifting cancer cell fractions between primary and metastatic sites, but without evidence of minor subclones becoming dominant in later tumors. We also ran PyClone on the 3 pairs of liver metastasis biopsies obtained before and after receipt of chemotherapy, finding neither subclonal sweeps nor changes in coding variant cell fractions.
Multi-Focal PDAC & Intra-Parenchymal Recurrences Are Metastases
Multi-focal PDAC and intra-pancreatic recurrences are relatively unexplained clinical conundrums. They are as frequent as 3% of PDAC cases (Hashimoto et al., 2017) and may be increasing with improved imaging, surgical techniques, and survival. Their management depends on whether they are distinct primaries or intra-parenchymal metastases, but they have been sparsely molecularly characterized. The paired cohort included one patient who had two isolated intra-pancreatic (i.e. intra-parenchymal) tumors arising 15 months following resection of the primary (clinically referred to as ‘metachronous’ PDAC) and two patients who presented with distinct ‘synchronous’ intra-pancreatic tumors at diagnosis. These did not display remarkable degrees of heterogeneity relative to the extra-parenchymal primary-metastatic pairs.
We first considered the patient with ‘metachronous’ disease (Figure 7A). The patient did not tolerate chemotherapy between surgeries and lacked pathogenic variants in germline predisposition genes (Connor and Gallinger, 2015). The three tumors were moderately differentiated adenocarcinomas accompanied by chronic pancreatitis (Figure 7B). No intraductal papillary mucinous neoplasia (IPMN), precursor lesions associated with multifocal PDAC (Tanaka et al., 2012), were present, and none of the tumors communicated directly with a pancreatic duct. The three tumors were diploid and shared nearly all point mutations, SVs and CNVs (Figures 2B and 2H, far right), indicating that the recurrences did not arise independently of the primary tumor. Single copy loss of chromosome 18, which includes loss of SMAD4, loss of heterozygosity in TP53, and complete loss of CDKN2A, validated by FISH, was present in all three lesions (Figure 2G). Most point mutations were shared at comparable cancer cell fractions, including a truncating TP53 variant, though a SMAD4 somatic frameshift was observed at higher cell fractions in the temporally later recurrences than in the primary (Figure 7C). From the subclonal point and structural variation, we constructed a phylogeny for this case (Figures 7D and 7E). We found similar histology and concordance of somatic variation for the paired cases that presented with two and three distinct synchronous lesions (Figure S8A). Notably, the case with two synchronous lesions had a truncating germline variant in PALB2 with a second, somatic truncating variant present at equal cell fractions in both lesions, bore Signature 3, and had intact copies of SMAD4 and TP53 (Figures 2F and 2G).
Figure 7: Multi-Focal PDAC & Intra-Parenchymal Recurrences Are Metastases.
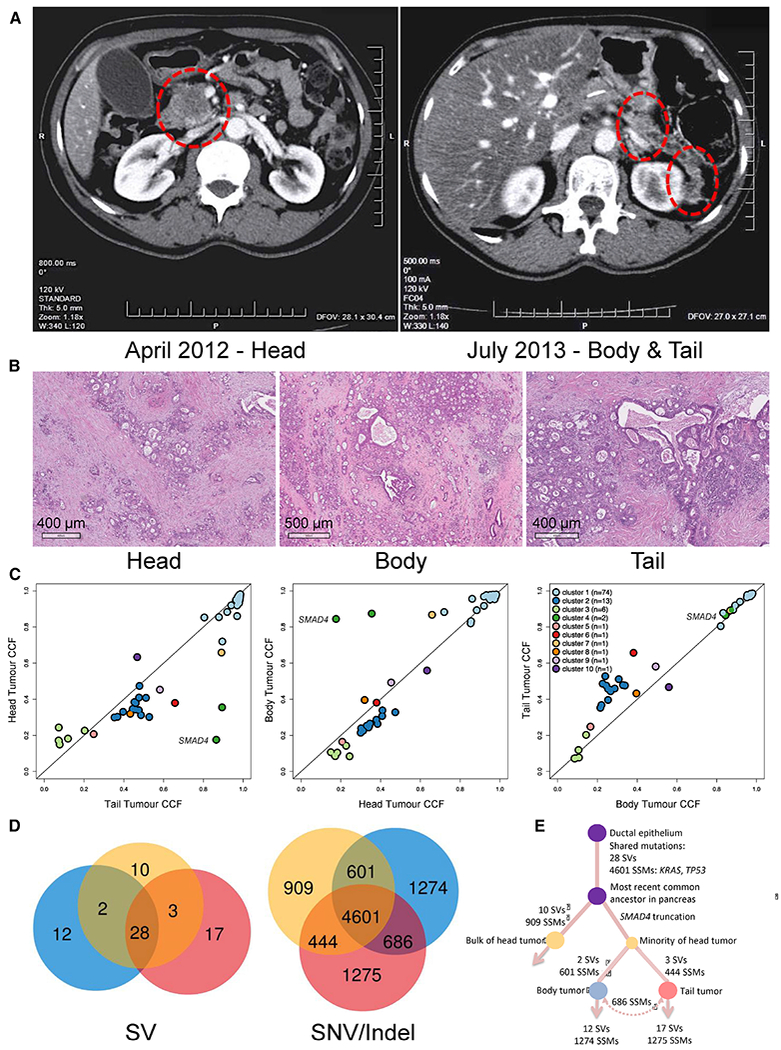
(A and B) Radiologic localization (A) and histologic appearances (B) of primary (head) and intra-parenchymal recurrences (body and tail). (C) Comparison of cancer cell fraction in primary tumor and recurrences. The SMAD4 frameshift mutation is labelled. (D) Venn diagrams showing SVs and SNVs/indels in all three tumors. (E) Inferred phylogeny. See also Figure S8.
As further validation, we also collected fresh frozen and FFPE samples from one additional case with two synchronous PDAC at presentation and three cases with isolated metachronous PDAC. By targeted sequencing, we found high concordance of somatic mutations in each pair (Figure S8B), demonstrating that recurring intra-parenchymal lesions rarely arise as distinct tumor lineages.
To determine whether PDAC with intra-parenchymal metastases have unique biology and clinical outcomes, we collected clinical data on a total of 10 such cases, 3 with synchronous and 7 with metachronous disease, including those sequenced above, comparing overall and progression free survival with unpaired cases (Figure S8C). There was a non-significant trend towards improved overall survival in these cases, with statistical power hindered by sample size.
Overall, we show that multi-focal and locally recurrent PDAC are disseminated disease rather than multiple primaries, scenarios not addressed by current clinical staging systems and possibly requiring different treatment approaches.
Pancreatic Cancer Outcomes Are More Associated With Clinical And Pathologic Than Molecular Features
Our unpaired cohort included 148 primaries resected with curative intent and with well-annotated clinical and pathologic co-variates in which we sought further associations with overall and progression free survival, acknowledging the limitations of retrospectively collected outcome data.
We performed uni- and multi-variate survival analyses with Cox proportional hazards models (Tables S4 and S5). Of the molecular features, Moffitt expression-based classification, hypoxia and TP53 bi-allelic loss were associated with overall and progression-free survival in univariate analyses (Figure 8A-8D), though clinical and pathologic factors, including tumor size (T stage), presence of nodal metastases (N stage), completeness of surgical resection (margins) and receipt of systemic therapy exerted greater influence on those outcomes. In multi-variate analysis, the expression based tumor subtyping described by Moffitt and colleagues (Moffitt et al., 2015) was the only molecular feature significant for overall and progression-free survival (HR 1.59, 95%CI 1.02-2.48; HR 1.63, 95%CI 1.06-2.51; respectively).
Figure 8: PDAC outcomes and molecular features.
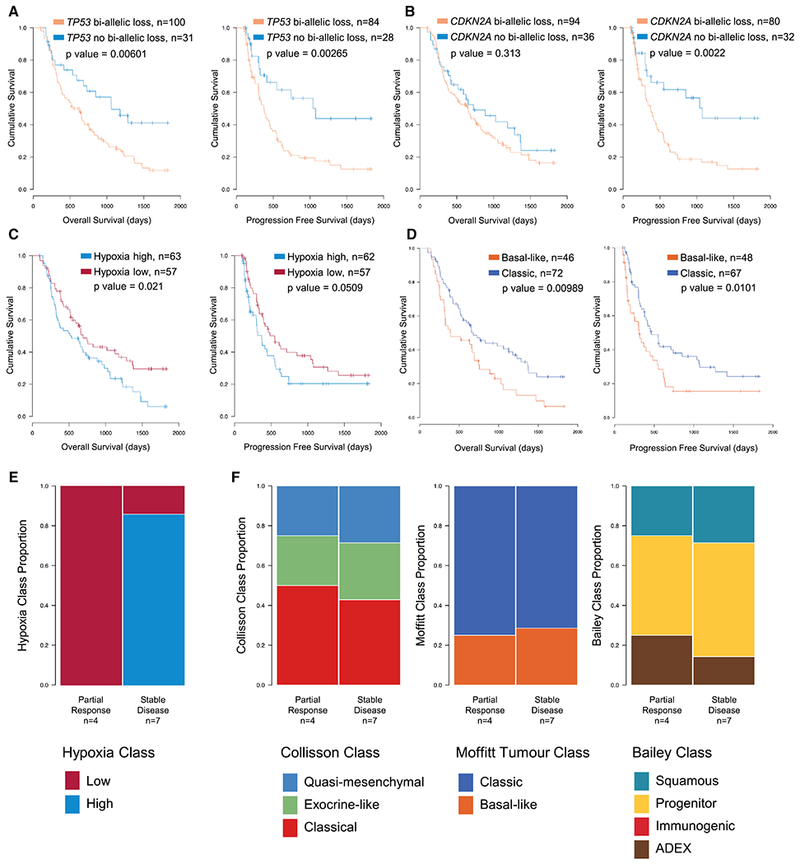
(A-D) Overall (left) and progression free (right) survival in unpaired primaries stratified by TP53 bi-allelic inactivation (A), CDKN2A bi-allelic inactivation (B), hypoxia score (C), or Moffitt expression-based subtyping (D). (E and F) Responses to neoadjuvant chemotherapy, reported as either partial response or stable disease, stratified by hypoxia score (E) or expression-based subtypes (F). See also Tables S4 and S5.
However, no co-variate had a hazard ratio greater than 3.1 for overall or progression-free survival, and no molecular features were associated with the clinical and pathologic factors associated with PDAC outcome. This implies that additional molecular features remain to be identified that will more fully explain PDAC biology.
Eleven cases in our unpaired primary series received neoadjuvant therapy prior to resection. All tumors with partial response to therapy lacked hypoxia, whereas most with stable disease were hypoxic by our expression-based metric (p = 0.03; Figure 8E). Expression-based subtypes were not predictive in this small cohort (Figure 8F). Along with our aforementioned observation that CCP declines with response to therapy, these additional molecular PDAC features may have translational, predictive value, though not independently prognostic.
Discussion
Using a large cohort of primary tumors and metastases, our study deciphers important features of early and advanced PDAC. Frequency and patterns of bi-allelic inactivation of the three main tumor suppressor genes (CDKN2A, TP53 and SMAD4) vary with the mutational processes active in the tumor. Loss of these drivers is largely concordant in paired tumors and results in increased CCP. Yet, CCP was markedly greater in metastases, perhaps explained by missense mutations in associated pathways. CCP was not associated with hypoxia. Hypoxia was present in at least half of PDAC primaries and metastases and was shared by parent and daughter lesions, implying hypoxia to be inherent to tumor biology rather than due to microenvironment. This is further supported by its association with expression-based subtypes. These overlap considerably with one another, implying two major PDAC classes - basal-like and classic. None of these classes, mutational signatures, hypoxia, CCP, or survival explain the degree of paired tumoral heterogeneity between primaries and metastases. Within paired samples, inversions, translocations and truncating variants are most conserved, while missense and non-coding variants are relatively less conserved. The paired samples also suggest that PDAC spreads in accordance with Halstedian sequential progression model. Our data also demonstrate that multiple intra-pancreatic tumors, either synchronous or metachronous, originate from a common neoplasm. These cases of intra-parenchymal metastases may have particular natural histories and outcomes relative to classic PDAC.
Our observation that CCP varies in PDAC primaries and metastases and with driver gene status has important implications on what was previously assumed about progression of PDAC. Using exome sequencing of paired primaries and metastases (Yachida et al., 2010), it was predicted that the time from the establishment of an invasive clone to gain of metastatic potential takes approximately 7 years, then the time from metastasis to death is approximately another 3 years. However, this latter analysis assumed constant proliferation rates in normal and malignant PDAC determined from Ki-67 staining. We have shown that rate of CCP in primaries depends on other aspects of tumor biology, and that metastases progress markedly faster than primaries. Our observation validates a model of PDAC progression based on pre-mortem radiology and autopsy findings that suggested metastases progress faster than primaries (Haeno et al., 2012). Increases in CCP in metastases may partly explain the high mortality associated with systemic disease.
The natural history of PDAC has been described as constrained tumor growth and widespread extra-pancreatic metastases in more than two thirds of patients, and locally advanced growth with limited metastases in another third (Haeno et al., 2012). We report an uncommon third route of PDAC natural history, in which recurrences are initially intra-parenchymal. Clinical management of these patients depends on whether the recurrences are distinct, primary cancers or relapses originating from a common ancestor. Studying this clinical scenario also offers the opportunity to observe tumor evolution within the same stromal microenvironment. Our data show that multifocal cases are genuine relapses. These intra-parenchymal recurrences may actually arise by neoplastic cell spread of precursors or early invasive clones along the pancreatic duct, as recently described (Makohon-Moore et al., 2018). Historically, it was suggested that PDAC is often multifocal and that all operative candidates be considered for total pancreatectomy (Ihse et al., 1977). However, poor outcomes for each incident PDAC and the morbidity of total pancreatectomy put this argument out of favor (van Heerden et al., 1981a, van Heerden et al., 1981b). Since our genomic analysis has shown intra-parenchymal lesions are metastases, surgery will not, in principle, offer the possibility of cure. However, a possible difference in the natural history of this subgroup may make serial surgery reasonable. We could not, in a small sample size, identify molecular alterations particular to these tumors. The degree of paired tumoral heterogeneity was equivalent to paired primaries and distant metastases, implying that PDAC metastases vary little somatically from their primaries, an important observation for clinical sequencing where often only one lesion is sampled.
Our data show that the expression-based subclass described by Moffitt et al. is the genomic feature most associated with PDAC outcomes, contrary to IHC-based studies of driver gene loss that did not consider as many molecular features in multi-variate models (Qian et al., 2018). Mechanisms of metastatic spread in human PDAC, and hence determinants of TNM stage, were not identified by agnostic comparisons of hepatic and lymph node metastases to primary tumors. We did not identify differences in frequencies of tumor suppressor gene inactivation in unpaired cases nor consistent changes across paired primaries and metastases. Ambitions to use tumor profiling to direct PDAC therapy, as in acute myeloid leukemia (Gerstung et al., 2017) and breast cancer (Yates et al., 2017), require further study. Yet, in such a highly lethal disease, identifying associations with prognosis should be of secondary importance to better understanding of disease behavior and biology, from which rational therapeutics may be devised. To make accurate predictions about PDAC outcomes based on cancer genomics requires a large database of prospectively enrolled and systematically managed patients and agnostic tumor sequencing, as we are doing in our COMPASS trial (Aung et al., 2018) and elsewhere (Mandelker et al., 2017, Aguirre et al., 2018).
Precision oncology presumes that the molecular characterization of a cancer will inform prognosis and predict therapeutic response. We have demonstrated that the somatic features of PDAC are inter-dependent, and most thoroughly determined by whole genome and transcriptome sequencing. However, these molecular features currently have less association with outcomes or pathology, implying more aspects of PDAC biology remain to be identified and translated into clinical practice.
STAR Methods
CONTACT FOR REAGENT AND RESOURCE SHARING
Further information and requests for resources and reagents should be directed to the Lead Contact, Dr. Steven Gallinger (steven.gallinger@uhn.ca).
EXPERIMENTAL MODEL AND SUBJECT DETAILS
Tumor samples
Samples were collected from patients with pathologically proven or clinically suspected PDAC from the University Health Network (Toronto), Sunnybrook Health Sciences Centre (Toronto), Kingston General Hospital (Kingston), McGill University (Montreal), Mayo Clinic (Rochester), Massachusetts General Hospital (Boston), Sheba Medical Centre (Tel Aviv). Samples were provided with patient informed consent and approval from Institutional Review or Research Ethics Boards from all above sites. Specimens were processed immediately following collection and representative sections were used to confirm the diagnosis of primary PDAC. Patients were recruited either through the International Cancer Genome Consortium (ICGC) Pancreatic Cancer Ductal Adenocarcinoma Canadian sequencing initiative as described elsewhere (Notta et al., 2016) or through the COMPASS trial as described elsewhere (Aung et al., 2018). PDAC cases from the University of Nebraska Medical Center were from donors within the Rapid Autopsy Pancreatic Program with informed consent and IRB approval.
Cohort Description
The study includes 319 PDAC specimens from 289 individuals. The larger group included 200 primary and 70 metastatic unpaired tumors from 270 patients (Figure 1, Table S1). All tumor samples were from fresh-frozen tissue. When necessary, samples were tumor enriched by laser capture microdissection or flow sorting, giving an average cellularity of 73%. All tumors underwent whole genome sequencing (WGS) to a minimum 45X. RNA sequencing (RNA-seq) was performed on 89% of primaries and 80% of metastases. Principal component analyses did not reveal batch effects based on tissue extraction, ischemia time or sequencing chemistries (Table S1). Our protocols included tumor tissue ischemia times shown experimentally to maintain nucleic acid integrity (Rudloff et al., 2010, Bao et al., 2013, Sun et al., 2016).
A smaller group of paired samples comprised 24 primaries and 25 metastases from 19 individuals (Figure 1, Table S1, S2). This group included 3 patients whose metastases were biopsied before and after chemotherapy treatment. For this paired group, the majority of samples were collected from fresh-frozen tissue and WGS and RNA-seq were performed on tumor enriched samples, as described above. For 4 patients, samples were obtained from fresh-frozen or FFPE biospecimens, and were used for targeted panel sequencing (Figure 1, Table S1, S2).
In total, 120 PDAC from 104 individuals are new to this study, including 80 primaries and 40 metastases. The remainder were included in our previous publications (Notta et al., 2016) (Connor et al., 2017, Aung et al., 2018, Golan et al., 2018). All patient recruitment, tissue extraction, ischemia time, sequencing chemistries, Illumina sequencer, and inclusion in previous publications are provided in Table S1.
Xenografts
Xenograft models were derived from patient tumor samples at the University Health Network (UHN) and Sheba Medical Centre (SMC), as described previously (Golan et al., 2017, Golan et al., 2018, Chang et al., 2011). In brief, core needle biopsies from PDAC liver metastases were collected, and implanted orthotopically (Chang et al., 2011) or subcutaneously (Golan et al., 2017, Golan et al., 2018) into immunodeficient mice. Xenografts were propagated, serially passaged into new recipient mice, and cryopreserved in 90% serum in liquid nitrogen for DNA and RNA extraction. Animal studies were approved by the UHN Animal Care Committee under the guidelines of the Canadian Council on Animal Care, and by the SMC Institutional Animal Care and Use Committee.
METHOD DETAILS
Laser Capture Microdissection
Laser capture microdissection (LCM) of freshly frozen tissue samples was performed as described elsewhere (Notta et al., 2016, Connor et al., 2017). Briefly, frozen tissue was embedded in optimal cutting temperature compound (OCT) cutting medium and serially cryosectioned at 10μm. Sections were mounted on polyethylene naphthalate (PEN) membrane slides (Carl Zeiss MicroImaging) and stained using Cresyl Violet (MilliporeSigma) for visualization. Sections designated for RNA extraction were microdissected immediately and 50uL of PicoPure Extraction Buffer was added to microdissected material before freezing at −80°C. Sections designated for DNA extraction were frozen at −80°C prior to microdissection and microdissected material was also stored at −80°C until further processing. 24 sections were microdissected initially (12 for DNA, 12 for RNA) and additional rounds of LCM were performed as required to increase nucleic acid quantity.
Flow Cytometry
Flow cytometry was performed as described elsewhere (Notta et al., 2016). Briefly, fresh frozen tumor samples were mechanical dissociated sharply then suspended in 9 ml of RPMI supplemented with 1% FBS and 1ml of 10× collagenase/hylauronidase mix (Stemcell technologies), filtered through a 70-150μm nylon mesh, centrifuged, re-suspended in cryopreservation media (20% FBS/10% DMSO final) and stored at −150 °C. Viable cells were then thawed, spun at ~ 1,000 r.p.m. for 20 min at 4 °C, and re-suspended in 100 μl of PBS + 5% FBS for antibody staining and cell sorting on the BD FACSAria III using 4-laser configuration. The following antibodies were used for cell sorting: GlyA FITC (BD bioscience, clone HIR2), CD140b PE (BD bioscience, clone 28D4), CD45 PC5 (Beckman Coulter, clone IM1833), EpCAM PerCP-eFluor710 (eBioscience, clone 1B7), CD31 PC7 (eBioscience, clone WM-59), CD90 (BD Biosciences, clone 5E10), CD34 APC7 (BD bioscience, clone 581, custom conjugation).
DNA extraction from buffy coat
Reference DNA from buffy coat was extracted using the Gentra Puregene Blood Kit using the manufacturer’s protocol. Input used was 300 μL of buffy coat.
DNA from microdissected fresh frozen tissue
Tissue previously microdissected was extracted using the Gentra Puregene Tissue Kit. A modified version of the manufacturer’s protocol was followed. Briefly, the microdissected tissue sample was thawed and topped up with 120 μL of cell lysis mix (1 μL RNase A + 1000 μL Puregene Cell Lysis solution), this was well mixed by flicking and incubated for 30min at room temperature. Following incubation, cell lysis was performed by adding 5 μL of Proteinase K and 1 μL of CaCl2 then incubating overnight at 55°C. The sample was centrifuged the following morning for 3 minutes at maximum speed, at room temperature. DNA was precipitated by transferring supernatant into a new tube and adding 0.8 times total volume of molecular grade isopropanol and 1 μL of GlycoBlue. After centrifuging for 3 minutes at maximum speed, at room temperature, the supernatant was discarded and the DNA pellet was washed with 500 μL of 70% ethanol. The sample was then centrifuged again for 3 minutes at maximum speed, at room temperature. The resulting supernatant was discarded and 12 μL of TE was used to dissolve the pellet by pipetting. The DNA was then frozen at −80°C before further use.
DNA from sectioned fresh frozen tissue
Tissue used as reference in cases where blood was not available was extracted using the Gentra Puregene Tissue Kit. A modified version of the manufacturer’s protocol was followed as described above for microdissected tissue. Three volumes were altered to allow better cell lysis of these samples: samples were topped up to 500 μL with cell lysis mix, 7 μL of Proteinase K was used and 1.5 μL of CaCl2 was used.
RNA from microdissected fresh frozen tissue
RNA was extracted from microdissected tissue using the PicoPure RNA Isolation Kit using the manufacturer’s protocol.
Whole genome sequencing
Whole genome sequencing was performed as described elsewhere (Connor et al., 2017, Notta et al., 2016). Extracted DNA was quantified using Qubit dsDNA High Sensitivity kit as per manufacturer’s protocol. Illumina paired-end libraries were prepared using either the NEBNext DNA Sample Prep Master Mix Set, the Nextera DNA Sample Prep Kit, or the KAPA Library Preparation Kits, following the manufacturers’ protocols. Libraries were quantified on the Illumina Eco Real-Time PCR Instrument using KAPA Illumina Library Quantification Kits according to the manufacturer’s standard protocol. Paired-end cluster generation and sequencing was carried out for all libraries on the Illumina HiSeq 2000/2500 platform using high-throughput (A) 2X101 cycles with TruSeq Cluster kit v3 (Illumina Inc., San Diego, CA, USA Cat #PE-401-3001/FC-401-3001) and (B) 2X126 cycles with HiSeq Cluster kit v4 (Illumina Inc., San Diego, CA, USA Cat #PE-401-4001/FC-401-4001), combined with rapid run (C) 2X101 cycles HiSeq SBS kits (Illumina Inc., San Diego, CA, US Cat #PE-401-4002/FC-402-4023). Samples were sequenced with the number of lanes predicted to yield a collapsed coverage of 50x and 35x for tumor and normal samples, respectively.
Germline and somatic genomic read alignment and variant calling
Raw genome sequencing reads were processed as described elsewhere (Notta et al., 2016). Briefly, BWA (version 0.6.2) was used to align reads to hg19 and PCR duplicates were marked with Picard (version 1.90). Germline variant calling was performed using the Genome Analysis Tool Kit (GATK, version 1.3.16) according to the GATK “best practices” for that version (McKenna et al., 2010). Somatic single nucleotide variations (SNVs) were identified as the intersection of calls by two separate tools; “Tier 1 SNVs” from Strelka (Saunders et al., 2012) and “PASS” filter variants from MuTect (Cibulskis et al., 2013) with both tools run using default settings. Indels were also identified by Strelka. Copy number segments, tumor cellularity and ploidy were obtained by using an in-house algorithm, CELLULOID (Notta et al., 2016). Somatic structural rearrangements were called as the union of filtered calls from two tools, CREST (Wang et al., 2011) and DELLY (Rausch et al., 2012).
RNA sequencing
RNA sequencing was performed as described elsewhere (Connor et al., 2017). Briefly, RNA was isolated using PicoPure RNA Isolation Kit, treated with RNase-free DNase Set, quantified using Qubit dsRNA High Sensitivity kit, and its quality measured using both RNA Screen Tape Assay and the 2200 TapeStation Nucleic Acid System. RNA Libraries were prepared using the TruSeq RNA Access Library Sample prep kit according to the manufacturer’s protocols using the SuperScript II reverse transcriptase in first-strand synthesis. Library pools were quantified on the Eco Real-Time PCR Instrument using KAPA Illumina Library Quantification Kits according to the manufacturer’s protocols. Paired-end cluster generation and sequencing of 2×126 cycles was carried out for all libraries on the Illumina HiSeq 2500 platform.
RNA read alignment and quantification
Reads were aligned to the human reference genome (hg38) and transcriptome (Ensembl v84) using STAR v.2.5.2a (Dobin et al., 2013) with outSAMtrandField intronMotif option. Picard v. 1.121 was used for marking duplicated reads. Gene expression was calculated in fragments per kilobase of exon per million reads mapped (FPKM) using cuffquant and cuffnorm commands in cufflinks package v. 2.2.1 (Trapnell et al., 2010). In gene expression analyses, gene expressions were standardized by subtracting cohort median expression after taking logarithm, that is, the standardization is obtained as follows:
where rj,g is the raw expression of gene g of sample j, and lg is the median among positive log (r1,g), … , log(rJ,g) for j = 1, … , J and g = 1, … , G.
Formalin-fixed paraffin-embedded (FFPE) DNA extraction
For formalin-fixed paraffin-embedded (FFPE) samples, DNA was extracted using the GeneJET FFPE DNA Purification Kit. Extracted DNA was quantified using Qubit dsDNA High Sensitivity kit.
Targeted sequencing, read alignment and variant calling of paired samples
Targeted libraries were prepared using the Ion AmpliSeq Comprehensive Cancer Panel (ThermoFisher Scientific, Cat#4477685) adapted for Illumina sequencing using the KAPA Hyper Prep kit (Roche Cat #KK8504). Library pools were quantified on the Eco Real-Time PCR Instrument using KAPA Illumina Library Quantification Kits according to the manufacturer’s protocols. Paired-end cluster generation and sequencing of 2×126 cycles was carried out for all libraries on the Illumina HiSeq 2500 platform. Read alignment and variant calling was then carried out as described above.
Investigation of Batch Effects in Whole Genome and RNA sequencing
Principal component analysis was applied to check batch effect for both WGS and RNA-seq. For WGS, normalized read counts in each 1000bp bin on autosomes were used. The first three principal components were investigated by cluster analysis for patient sex, tumor tissue (primary, metastasis), and sequencing chemistries, none of which corresponded. For RNA-seq, only well expressed genes (FPKM > 1) were used for PCA. No specific clusters were found among the first three principal components.
Immunohistochemistry for Ki-67
For unpaired 165 primaries and 35 metastases, paraffin sections at 4um thickness were dried at 60°C oven overnight before staining. Immunostaining for Ki-67 protein expression was performed according to standard laboratory procedures. Briefly, 5-μm sections were deparaffinized, antigens were retrieved by microwave boiling in Tris EDTA buffer (pH 9.0), and sections were incubated at room temperature with the Ki-67 primary antibody (clone MiB1, M7240; Dako, U.S.A; 1:300; overnight). The Mach 4 detection system (Biocare Medical) was used for secondary antibodies and chromogenic detection.
Manual staining and image analysis were used for cell counts. The minimum number of tumor cells counted per case was 500, and most cases had greater than 1000 tumor cells analyzed. Hematoxylin and eosin staining was used with image analysis for each case to distinguish tumor from stromal cells and to count total cells.
QUANTIFICATION AND STATISTICAL ANALYSIS
Identification of Mutational Signatures
As was done previously (Connor et al., 2017), we used non-negative matrix factorization of base substitution counts to confirm that mutational signatures 1,2,3,5,6,8,13,17,18,20 and 26 (http://cancer.sanger.ac.uk/cosmic/signatures) were present in our cohort. We evaluated the contribution and the significance of these mutational signatures in each sample by applying a non-negative least squares linear model, using the published signatures (listed above) as independent variables. Significance was assessed using 5000 bootstrap replicates of the mutation counts. Non-significant signatures were removed, and the linear model re-fitted. This significance approach is in contrast to what has been previously done (Connor et al., 2017), where signatures that did not improve the cosine similarity between the observed mutation counts and the fitted counts by more than 0.02 were removed.
Cell Cycle Progression (CCP) Scoring
CCP scores were obtained from the median expression of 31 validated genes (PLK1, RRM2, CDCA8, CDC20, CDCA3, FOXM1, BIRC5, PBK, CDKN3, CENPM, MCM10, TK1, DTL, ASF1B, NUSAP1, PRC1, BUB1B, DLGAP5, TOP2A, ASPM, CENPF, KIF20A, PTTG1, RAD54L, ORC6, CDK1, CEP55, KIF11, RAD51, KIAA0101, SKA1) by subtracting the median expression of 15 validated housekeeping genes (Cuzick et al., 2011, Kumar et al., 2016), that is,
where hj is the median of standardized housekeeping genes ej,h1, … , ej,h15.
Hypoxia Expression Scoring
We applied hierarchical clustering based on 76 validated hypoxia genes (Buffa et al., 2010, Favaro et al., 2011, Harris et al., 2015, Chi et al., 2006, Koong et al., 2000, Sorensen et al., 2010, Toustrup et al., 2011), and differential expression analysis was conducted on two major clusters. The hypoxia score were obtained by the median expression of twenty genes with highest correlation (ADM, ALDOA, ALDOC, ANGPTL4, ANKRD37, BNIP3L, EGLN3, ENO2, ERO1A, FUT11, HILPDA, HK2, NDRG1, P4HA1, PDK1, PGK1, PPFIA4, SEMA4B, SLC2A1, VEGFA) subtracted by the median expression of ten genes with lowest correlation (KDELC1P1, KIAA1549, OXER1, PPP1R10, RFXAP, TNRC6C, ZC3H4, ZNF30, ZNF69, ZNF786).
Pathway Analysis
Functional gene-sets were compiled from Gene Ontology, Reactome, KEGG, NCI, Biocarta in January 2016, resulting in a total of 22,713 gene-sets (genes were mapped to NCBI Entrez Gene identifiers, if not already available); only gene-sets with 25 or more genes but no more than 1,200 genes were retained for testing, resulting in 5,870 gene-sets. Cancer hallmarks were compiled from MSigDB in May 2017, resulting in a total of 50 gene-sets. Tumors that were extreme outliers for the number of somatic SNV, indels or structural variants (count > median + 2 IQR) were eliminated from the data set, resulting in 190 primaries and 41 metastases. Somatic variants from primaries and metastases were categorized as: nonsense SNVs (i.e. stopgains, labelled ns), missense SNVs (labelled ms), core splice site SNVs (i.e. altering the highly conserved intronic dinucleotide, labelled ss), structural variant breakpoints (labelled sv), copy number losses (labelled cL), copy number gains (labelled cG). We then fit four logistic regression models (MM: minimal model, ME: extended model), with metastasis / primary as outcome variable (y), gene-set somatic variant counts as main variables, and total somatic variant counts as correction covariates:
MM0: y ~ ns_tot + ms_tot
MM1: y ~ ns_tot + ms_tot + ns_gs + ms_gs
ME0: y ~ ns_tot + ms_tot + ss_tot + sv_tot + cL_tot + cG_tot
ME1: y ~ ns_tot + ms_tot + ss_tot + sv_tot + cL_tot + cG_tot + ns_gs + ms_gs + ss_gs + sv_gs + cL_gs + cG_gs
The R function glm (…, family = binomial (“logit”)) was used to fit the logistic regression models. Note that all variables were standardized by subtracting the mean and dividing by the standard deviation, to render coefficient values comparable. The overall significance of a model was calculated using a log likelihood ratio test between the full model and the covariate only model (MM0-MM1, ME0-ME1), using the R function anova (M0, M1, test = “Chisq”). Coefficient values were then extracted alongside their Wald test p values using the R function summary (…). Finally, log likelihood ratio p values for MM0-MM1 and ME0-ME1 were corrected using Benjamini-Hochberg FDR, as implemented by the R function p.adjust (…, method = “BH”). Since smaller gene-sets can be detrimental for power, BH-FDRs were calculated for a set of three different parameters: (i) 25 <= gs <= 1200, (ii) 50 <= gs <= 1200, (iii) 100 <= gs <= 1200. In addition, since different gene-set collections can have a different fraction of significant gene-sets, Gene Ontology and pathway sets (GOP), the subset of KEGG and Reactome pathways (PKR), and cancer hallmarks (HM) were corrected separately. To evaluate the number of significant and meaningful gene-sets, for each gene-set collection (GOP, PKR, HM), we required: (a) at least one BH-FDR <= 27.5% (where 6 BH-FDRs are available, i.e. 3 size cutoff settings x minimal, extended model) and (b) at least one coefficient to be positive and nominally significant (Wald p value < 0.05), since we are interested only in gene-sets with higher burden in metastases. This resulted in 7 / 5870 gene-sets for GOP, 24 / 1,005 gene-sets for PKR, and 2 / 50 gene-sets for HM. Since GOP significant gene-sets were largely subsumed by PKR significant gene-sets, and the 2 HM gene-sets were driven only by a handful of genes with poor functional cohesiveness, we decided to focus on PKR significant gene-sets. The majority of these gene-sets were recapitulated by the Reactome gene-set ‘Cell cycle, mitotic’, driven only by missense variants (for MM: coefficient beta = 0.57, Wald nominal p value = 0.00266, MM0-MM1 log likelihood ratio nominal p value = 0.00639, MM0-MM1 BH-FDR 29% for 25-1200, 25% for 50-1200 and 24% for 100-1200).
Correlation between the RNA-seq ccp index and the presence/absence of cell cycle missense variants (ms_cc_bin) was evaluated using linear regression, with or without correction for the total number of missense variants:
M1: ccp ~ ms_cc_bin
M2: ccp ~ ms_cc_bin + ms_tot
The R function lm was used to fit the linear regression models; coefficient values were then extracted alongside their t-test p values, using the R function summary.
Simple and Structural Variant Comparisons Between Paired Lesions
We separated variant calls from paired samples into shared, primary private or metastasis private variant groups based on presence/absence of mutation. We reviewed all private variants and “rescued” the variants that were not confidently called in one of the samples due to low frequency of mutation. The criteria for rescuing an SNV or indel was at least 1 mapped read supporting the mutation in the sample where the variant was not initially called. Similarly, rescue of structural variants required at least 1 pre-filter variant call by CREST (Wang et al., 2011) or DELLY (Rausch et al., 2012). These rescued variants were reclassified as shared variants. To account for inexact structural breakpoint locations, we considered structural breakpoints to be the same if they were within 250 bp of each other. For both simple and structural variants, private events that were not candidates for rescue due to low sequencing depth (<10×) were excluded from our pairwise analyses.
Tumoral Heterogeneity
We quantified tumoral heterogeneity using Jaccard similarity coefficients, as described elsewhere (Makohon-Moore et al., 2017). For cases with two paired samples, this was defined as the ratio of shared variants to all variants (shared plus discordant), irrespective of variant allele frequencies. For cases with three or more paired samples, this was defined as the average of Jaccard similarity coefficients for each possible pairwise combination. This was calculated in the R statistical environment using the dist() function.
Recurrent Copy Number Alteration Analysis
A piled sample-wise copy number segments were used for recurrent copy number alteration (CNA) analysis using GISTIC v2.0.23 (Mermel et al., 2011). Frequencies of events were computed from the all legions output file. Recurrent CNA segments having statistically different frequencies between cohorts were identified using Fisher’s exact test and adjusted based on Benjamini-Hochberg method.
Outcome Analysis
Association of clinical, pathologic and molecular co-variates with overall and progression-free survival were first determined using univariate Cox proportional hazards models and false discovery rates. Then, all co-variates were included in a multi-variate Cox proportional hazards model. Finally, only those co-variates found to be significant by uni- or multi-variate analysis were included in a third Cox proportional hazards model. All analyses were done using the “survival” package for the R statistical environment.
Statistical Analyses
All other statistical analyses were carried out as described in the text using the R statistical environment. For box plots shown in the main and supplemental figures, the box represents the upper and lower quartiles with the median shown as a solid line inside the box. Dashed whiskers stretch to the adjacent value within the 1.5 times interquartile range. Any data points outside the 1.5 times interquartile range are shown.
DATA AND SOFTWARE AVAILABILITY
For the resected primary tumors, clinical information and variant calls are available from the International Cancer Genome Consortium (ICGC) data portal https://dcc.icgc.org/. Raw reads for other cases are available from the European Genome Phenome Archive https://www.ebi.ac.uk/ega/home (Study ID EGAS00001002543).
Supplementary Material
Table S1, related to Figure 1. Patient recruitment and tissue extraction details
Table S3, related to Figure 4. Copy number segments highlighted by GISTIC in unpaired PDAC primaries and metastases
KEY RESOURCES TABLE
| REAGENT or RESOURCE | SOURCE | IDENTIFIER |
|---|---|---|
| Antibodies | ||
| GlyA FITC antibody | BD Bioscience | Clone HIR2 |
| CD140b PE antibody | BD Bioscience | Clone 28D4 |
| CD45 PC5 antibody | Beckman Coulter | Clone IM1833 |
| EpCAM PerCP-eFluor710 antibody | eBioscience | Clone 1B7 |
| CD31 PC7 antibody | eBioscience | Clone WM-59 |
| CD90 antibody | BD Bioscience | Clone 5E10 |
| CD34 APC7 antibody | BD Bioscience | Clone 581 |
| Ki-67 antibody | Dako | Clone MiB1, M7240 |
| Biological Samples | ||
| Human tumor samples and matched reference material | University Health Network (Toronto, ON), Sunnybrook Health Sciences Centre (Toronto, ON), Kingston General Hospital (Kingston, ON), McGill University (Montreal, QC), Mayo Clinic (Rochester, MN), Massachusetts General Hospital (Boston, MA), University of Nebraska Medical Centre (Omaha, NE). All samples processed through Ontario Institute for Cancer Research (Toronto, ON) | |
| Patient derived xenografts | University Health Network (Toronto, ON), Sheba Medical Centre (Tel Aviv, Israel). | |
| Chemicals, Peptides, and Recombinant Proteins | ||
| Cresyl Violet acetate | MiliporeSigma | Cat# C5042 |
| Cell Lysis Buffer | Qiagen | Cat# 158908 |
| RPMI solution | Roche Applied Science | Cat #10104159001 |
| Molecular grade ethyl alcohol | Commercial Alcohols® | #P006EAAN |
| CaCl2 2M | Sigma | #C5670-100G |
| RNase A from bovine pancreas | Sigma | #R4642 |
| Puregene Cell Lysis Solution | Qiagen | #158908 |
| Puregene Protein Precipitation Solution | Qiagen | #158912 |
| Proteinase K | NEB | #P8107S |
| GlycoBlue™ Coprecipitant 15 mg/mL | Ambion | #AM9515 |
| Molecular grade isopropanol | Sigma | #I9516-500ML |
| TE 1X buffer | Fisher Scientific® | #BP2473100 |
| Critical Commercial Assays | ||
| PicoPure RNA Isolation Kit | Applied Biosystems | Cat# LSKIT0204 |
| Gentra Puregene Blood Kit | Qiagen | Cat #158389 |
| Gentra Puregene Tissue Kit | Qiagen | Cat #158667 |
| GeneJET FFPE DNA Purification Kit | ThermoFisher Scientific | Cat #K0881 |
| Qubit dsDNA HS Assay Kit | ThermoFisher Scientific | Cat# Q33230 |
| NEBNext DNA Sample Prep Master Mix Set | New England Biolabs | Cat #E6000 |
| Nextera DNA Sample Prep Kit | Illumina | Cat #FC-121-1031 |
| KAPA Library Preparation Kits | Roche | Cat #KK8504 |
| Kapa Library Quantification Kits | Roche | Cat #KK4960 |
| TruSeq Cluster kit v3 | Illumina | Cat #PE-401-3001/FC-401-3001 |
| HiSeq Cluster kit v4 | Illumina | Cat #PE-401- 4001/FC-401-4001 |
| HiSeq SBS kits | Illumina | Cat #PE-401-4002/FC-402-4023 |
| PicoPure RNA Isolation Kit | Applied Biosystems | Cat# LSKIT0204 |
| RNase-free DNase Set | Qiagen | Cat# 79254 |
| Qubit RNA HS Assay Kit | ThermoFisher Scientific | Cat# Q32852 |
| RNA Screen Tape Assay | Agilent | Cat#5067-5576 |
| 2200 TapeStation | Agilent | Cat#5067-5584 and 5067-5585 |
| TruSeq RNA Access Library Sample prep kit | Illumina | Cat#RS-301-2001 |
| SuperScript II reverse transcriptase | Invitrogen | Cat#18064-014 |
| KAPA Library Quantification Kits | Roche | Cat #KK4960 |
| Ion AmpliSeq Comprehensive Cancer Panel | ThermoFisher Scientific | Cat #4477685 |
| KAPA Hyper prep kit | Roche | Cat #KK8504 |
| Deposited Data | ||
| International Cancer Genome Consortium (ICGC) data portal | https://dcc.icgc.org/ | PACA-CA |
| European Genome Phenome Archive JEPA) | https://www.ebi.ac.uk/ega/home | EGAS00001002543 |
| Software and Algorithms | ||
| MutSigCV | (Lawrence et al., 2013) | http://software.broadinstitute.org/cancer/software/genepattern/modules/docs/MutSigCV |
| dNdScv | (Martincorena et al., 2017) | https://github.com/im3sanger/dndscv |
| BWA version 0.6.2 | (Li and Durbin, 2009) | http://bio-bwa.sourceforge.net/ |
| Picard version 1.9 | NA | https://broadinstitute.github.io/picard/ |
| Genome Analysis Tool Kit (GATK4, version 1.3.16) | (McKenna et al., 2010) | https://software.broadinstitute.org/gatk/ |
| Strelka 5 version 1.0.7 | (Saunders et al., 2012) | https://github.com/Illumina/strelka |
| MuTect6 version 1.1.14 | (Cibulskis et al., 2013) | http://archive.broadinstitute.org/cancer/cga/mutect |
| Celluloid version 0.11.2 | (Notta et al., 2016) | https://github.com/mathieu-lemire/celluloid_0.11) |
| CREST version alpha | (Wang et al., 2011) | http://www.stjuderesearch.org/site/lab/zhang |
| DELLY version 0.5.5 | (Rausch et al., 2012) | https://github.com/dellytools/delly |
| GISTIC version 2.0.23 | (Mermel et al., 2011) | ftp://ftp.broadinstitute.org/pub/GISTIC2.0 |
| STAR version 2.5.2a | (Dobin et al., 2013) | https://github.com/alexdobin/STAR |
| cufflinks version 2.2.1 | (Trapnell et al., 2012) | https://github.com/cole-trapnell-lab/cufflinks |
| Other | ||
| OCT cutting medium | Sakura Finetek | Cat# 4583 |
| PEN membrane slides | Carl Zeiss MicroImaging | Cat# 415190-9081-000 |
| PALM LMPC device | Carl Zeiss MicroImaging | |
| FACSAria III | BD Bioscience | |
| Eco Real-Time PCR Instrument | Illumina | Cat #EC-900-1001 |
| HiSeq 2000/2500 | Illumina | |
| 1.5 mL microcentrifuge tubes | Fisher Scientific® | #5408129 |
| 0.5 mL sterile matrix tubes | Thermo Scientific™ | #3745 |
| Sterile screw caps for 0.5 & 1.0 mL tubes | Thermo Scientific™ | #4470 |
Significance.
Pancreatic ductal adenocarcinoma has dismal prognosis due to rapid metastatic dissemination. This rigorous study of paired and unpaired tumors informs both progression mechanisms and therapy. First, there was no evidence of discrete metastases enabling gene(s). Second, greater CCP in metastases may explain aggressive behaviour and correspond to treatment response. Third, hypoxia signature was associated with chemotherapy resistance. Fourth, comparing mutations in paired samples reveals sequential progression from primary to lymph node to distant metastases, and sequencing synchronous and metachronous lesions distinguished these as recurrences rather than separate primaries, resolving this clinical conundrum. Finally, clinical features outperformed and were independent of molecular alterations in survival analyses, implying greater insight is needed before molecular profiling broadly informs therapy.
Highlights.
Higher cell cycle progression in PDAC metastases; increases with driver gene loss
Half of PDAC are hypoxic, and are associated with subtypes and treatment response
Paired tumors show molecular conservation, and Halstedian progression
Multiple PDAC arising in the same pancreas are intra-parenchymal metastases
Connor et al. molecularly characterize primary and metastatic PDAC and show conserved alterations between paired primary and metastatic lesions. Clinical features outperform molecular alterations in survival analyses, but cell cycle progression and hypoxia signatures may inform clinical practice.
Acknowledgments
This study was conducted with the support of the Ontario Institute for Cancer Research (OICR, PanCuRx Translational Research Initiative) through funding provided by the Government of Ontario (Ministry of Research, Innovation, and Science), the Wallace McCain Centre for Pancreatic Cancer supported by the Princess Margaret Cancer Foundation, and charitable donations from the Canadian Friends of the Hebrew University (Alex U. Soyka), the Pancreatic Cancer Canada Foundation, and the Canadian Cancer Society Research Institute. GZ is a clinical research scholar of the Fonds de recherche du Québec – Santé. GMP is supported by a SPORE grant from the National Institutes of Health (NCI grant P50CA102701).
Footnotes
Publisher's Disclaimer: This is a PDF file of an unedited manuscript that has been accepted for publication. As a service to our customers we are providing this early version of the manuscript. The manuscript will undergo copyediting, typesetting, and review of the resulting proof before it is published in its final citable form. Please note that during the production process errors may be discovered which could affect the content, and all legal disclaimers that apply to the journal pertain.
Declaration of Interests
The authors declare no competing interests.
References
- AGUIRRE AJ, BARDEESY N, SINHA M, LOPEZ L, TUVESON DA, HORNER J, REDSTON MS & DEPINHO RA 2003. Activated Kras and Ink4a/Arf deficiency cooperate to produce metastatic pancreatic ductal adenocarcinoma. Genes Dev, 17, 3112–26. [DOI] [PMC free article] [PubMed] [Google Scholar]
- AGUIRRE AJ, NOWAK JA, CAMARDA ND, MOFFITT RA, GHAZANI AA, HAZAR-RETHINAM M, RAGHAVAN S, KIM J, BRAIS LK, RAGON D et al. , 2018. Real-time Genomic Characterization of Advanced Pancreatic Cancer to Enable Precision Medicine. Cancer Discov, 8, 1096–1111. [DOI] [PMC free article] [PubMed] [Google Scholar]
- ALMOGUERA C, SHIBATA D, FORRESTER K, MARTIN J, ARNHEIM N & PERUCHO M 1988. Most human carcinomas of the exocrine pancreas contain mutant c-K-ras genes. Cell, 53, 549–54. [DOI] [PubMed] [Google Scholar]
- AUNG KL, FISCHER SE, DENROCHE RE, JANG GH, DODD A, CREIGHTON S, SOUTHWOOD B, LIANG SB, CHADWICK D, ZHANG A, et al. , 2018. Genomics-Driven Precision Medicine for Advanced Pancreatic Cancer: Early Results from the COMPASS Trial. Clin Cancer Res, 24, 1344–1354. [DOI] [PMC free article] [PubMed] [Google Scholar]
- BAILEY P, CHANG DK, NONES K, JOHNS AL, PATCH AM, GINGRAS MC, MILLER DK, CHRIST AN, BRUXNER TJ, QUINN MC, et al. , 2016. Genomic analyses identify molecular subtypes of pancreatic cancer. Nature, 531, 47–52. [DOI] [PubMed] [Google Scholar]
- BAO WG, ZHANG X, ZHANG JG, ZHOU WJ, BI TN, WANG JC, YAN WH & LIN A 2013. Biobanking of fresh-frozen human colon tissues: impact of tissue ex-vivo ischemia times and storage periods on RNA quality. Ann Surg Oncol, 20, 1737–44. [DOI] [PubMed] [Google Scholar]
- BIANKIN AV, WADDELL N, KASSAHN KS, GINGRAS MC, MUTHUSWAMY LB, JOHNS AL, MILLER DK, WILSON PJ, PATCH AM, WU J, , et al. , 2012. Pancreatic cancer genomes reveal aberrations in axon guidance pathway genes. Nature, 491, 399–405. [DOI] [PMC free article] [PubMed] [Google Scholar]
- BUFFA FM, HARRIS AL, WEST CM & MILLER CJ 2010. Large meta-analysis of multiple cancers reveals a common, compact and highly prognostic hypoxia metagene. Br J Cancer, 102, 428–35. [DOI] [PMC free article] [PubMed] [Google Scholar]
- CAMPBELL PJ, YACHIDA S, MUDIE LJ, STEPHENS PJ, PLEASANCE ED, STEBBINGS LA, MORSBERGER LA, LATIMER C, MCLAREN S, LIN M et al. , 2010. The patterns and dynamics of genomic instability in metastatic pancreatic cancer. Nature, 467, 1109–13. [DOI] [PMC free article] [PubMed] [Google Scholar]
- CANCER GENOME ATLAS RESEARCH, N. 2017. Integrated Genomic Characterization of Pancreatic Ductal Adenocarcinoma. Cancer Cell, 32, 185–203 e13. [DOI] [PMC free article] [PubMed] [Google Scholar]
- CHANG Q, JURISICA I, DO T & HEDLEY DW 2011. Hypoxia predicts aggressive growth and spontaneous metastasis formation from orthotopically grown primary xenografts of human pancreatic cancer. Cancer Res, 71, 3110–20. [DOI] [PubMed] [Google Scholar]
- CHI JT, WANG Z, NUYTEN DS, RODRIGUEZ EH, SCHANER ME, SALIM A, WANG Y, KRISTENSEN GB, HELLAND A, BORRESEN-DALE, et al. , 2006. Gene expression programs in response to hypoxia: cell type specificity and prognostic significance in human cancers. PLoS Med, 3, e47. [DOI] [PMC free article] [PubMed] [Google Scholar]
- CIBULSKIS K, LAWRENCE MS, CARTER SL, SIVACHENKO A, JAFFE D, SOUGNEZ C, GABRIEL S, MEYERSON M, LANDER ES & GETZ G 2013. Sensitive detection of somatic point mutations in impure and heterogeneous cancer samples. Nat Biotechnol, 31, 213–9. [DOI] [PMC free article] [PubMed] [Google Scholar]
- COLLISSON EA, SADANANDAM A, OLSON P, GIBB WJ, TRUITT M, GU S, COOC J, WEINKLE J, KIM GE, JAKKULA L, et al. , 2011. Subtypes of pancreatic ductal adenocarcinoma and their differing responses to therapy. Nat Med, 17, 500–3. [DOI] [PMC free article] [PubMed] [Google Scholar]
- CONNOR AA, DENROCHE RE, JANG GH, TIMMS L, KALIMUTHU SN, SELANDER I, MCPHERSON T, WILSON GW, CHAN-SENG-YUE MA, BOROZAN I, et al. , 2017. Association of Distinct Mutational Signatures With Correlates of Increased Immune Activity in Pancreatic Ductal Adenocarcinoma. JAMA Oncol, 3, 774–783. [DOI] [PMC free article] [PubMed] [Google Scholar]
- CONNOR AA & GALLINGER S 2015. Hereditary Pancreatic Cancer Syndromes. Surg Oncol Clin N Am, 24, 733–64. [DOI] [PubMed] [Google Scholar]
- CUZICK J, DOWSETT M, PINEDA S, WALE C, SALTER J, QUINN E, ZABAGLO L, MALLON E, GREEN AR, ELLIS IO, et al. , 2011. Prognostic value of a combined estrogen receptor, progesterone receptor, Ki-67, and human epidermal growth factor receptor 2 immunohistochemical score and comparison with the Genomic Health recurrence score in early breast cancer. J Clin Oncol, 29, 4273–8. [DOI] [PubMed] [Google Scholar]
- DOBIN A, DAVIS CA, SCHLESINGER F, DRENKOW J, ZALESKI C, JHA S, BATUT P, CHAISSON M & GINGERAS TR 2013. STAR: ultrafast universal RNA-seq aligner. Bioinformatics, 29, 15–21. [DOI] [PMC free article] [PubMed] [Google Scholar]
- FAVARO E, LORD S, HARRIS AL & BUFFA FM 2011. Gene expression and hypoxia in breast cancer. Genome Med, 3, 55. [DOI] [PMC free article] [PubMed] [Google Scholar]
- FEIGIN ME, GARVIN T, BAILEY P, WADDELL N, CHANG DK, KELLEY DR, SHUAI S, GALLINGER S, MCPHERSON JD, GRIMMOND SM, et al. , 2017. Recurrent noncoding regulatory mutations in pancreatic ductal adenocarcinoma. Nat Genet, 49, 825–833. [DOI] [PMC free article] [PubMed] [Google Scholar]
- GERLINGER M, ROWAN AJ, HORSWELL S, MATH M, LARKIN J, ENDESFELDER D, GRONROOS E, MARTINEZ P, MATTHEWS N, STEWART, et al. , 2012. Intratumor heterogeneity and branched evolution revealed by multiregion sequencing. N Engl J Med, 366, 883–892. [DOI] [PMC free article] [PubMed] [Google Scholar]
- GERSTUNG M, PAPAEMMANUIL E, MARTINCORENA I, BULLINGER L, GAIDZIK VI, PASCHKA P, HEUSER M, THOL F, BOLLI N, GANLY P, et al. , 2017. Precision oncology for acute myeloid leukemia using a knowledge bank approach. Nat Genet, 49, 332–340. [DOI] [PMC free article] [PubMed] [Google Scholar]
- GOLAN T, STOSSEL C, ATIAS D, BUZHOR E, HALPERIN S, COHEN K, RAITSES-GUREVICH M, GLICK Y, RASKIN S, YEHUDA D, et al. , 2018. Recapitulating the clinical scenario of BRCA-associated pancreatic cancer in pre-clinical models. Int J Cancer. [DOI] [PubMed] [Google Scholar]
- GOLAN T, STOSSEL C, SCHVIMER M, ATIAS D, HALPERIN S, BUZHOR E, RAITSES-GUREVICH M, COHEN K, PRI-CHEN S, WILSON J, et al. , 2017. Pancreatic cancer ascites xenograft-an expeditious model mirroring advanced therapeutic resistant disease. Oncotarget, 8, 40778–40790. [DOI] [PMC free article] [PubMed] [Google Scholar]
- GRANT RC, DENROCHE RE, BORGIDA A, VIRTANEN C, COOK N, SMITH AL, CONNOR AA, WILSON JM, PETERSON G, ROBERTS, et al. , 2018. Exome-Wide Association Study of Pancreatic Cancer Risk. Gastroenterology, 154, 719–722 e3. [DOI] [PMC free article] [PubMed] [Google Scholar]
- GUNDEM G, VAN LOO P, KREMEYER B, ALEXANDROV LB, TUBIO JMC, PAPAEMMANUIL E, BREWER DS, KALLIO HML, HOGNAS G, ANNALA M, et al. , 2015. The evolutionary history of lethal metastatic prostate cancer. Nature, 520, 353–357. [DOI] [PMC free article] [PubMed] [Google Scholar]
- HAENO H, GONEN M, DAVIS MB, HERMAN JM, IACOBUZIO-DONAHUE CA & MICHOR F 2012. Computational modeling of pancreatic cancer reveals kinetics of metastasis suggesting optimum treatment strategies. Cell, 148, 362–75. [DOI] [PMC free article] [PubMed] [Google Scholar]
- HARRIS BH, BARBERIS A, WEST CM & BUFFA FM 2015. Gene Expression Signatures as Biomarkers of Tumour Hypoxia. Clin Oncol (R Coll Radiol), 27, 547–60. [DOI] [PubMed] [Google Scholar]
- HASHIMOTO D, CHIKAMOTO A, MASUDA T, NAKAGAWA S, IMAI K, YAMASHITA YI, REBER HA & BABA H 2017. Pancreatic Cancer Arising From the Remnant Pancreas: Is It a Local Recurrence or New Primary Lesion? Pancreas, 46, 1083–1090. [DOI] [PubMed] [Google Scholar]
- HINGORANI SR, PETRICOIN EF, MAITRA A, RAJAPAKSE V, KING C, JACOBETZ MA, ROSS S, CONRADS TP, VEENSTRA TD, HITT BA, et al. , 2003. Preinvasive and invasive ductal pancreatic cancer and its early detection in the mouse. Cancer Cell, 4, 437–50. [DOI] [PubMed] [Google Scholar]
- HINGORANI SR, WANG L, MULTANI AS, COMBS C, DERAMAUDT TB, HRUBAN RH, RUSTGI AK, CHANG S & TUVESON DA 2005. Trp53R172H and KrasG12D cooperate to promote chromosomal instability and widely metastatic pancreatic ductal adenocarcinoma in mice. Cancer Cell, 7, 469–83. [DOI] [PubMed] [Google Scholar]
- HRUBAN RH, GOGGINS M, PARSONS J & KERN SE 2000. Progression model for pancreatic cancer. Clin Cancer Res, 6, 2969–72. [PubMed] [Google Scholar]
- IACOBUZIO-DONAHUE CA, FU B, YACHIDA S, LUO M, ABE H, HENDERSON CM, VILARDELL F, WANG Z, KELLER JW, BANERJEE P, et al. , 2009. DPC4 gene status of the primary carcinoma correlates with patterns of failure in patients with pancreatic cancer. J Clin Oncol, 27, 1806–13. [DOI] [PMC free article] [PubMed] [Google Scholar]
- IHSE I, LILJA P, ARNESJO B & BENGMARK S 1977. Total pancreatectomy for cancer. An appraisal of 65 cases. Ann Surg, 186, 675–80. [DOI] [PMC free article] [PubMed] [Google Scholar]
- IZERADJENE K, COMBS C, BEST M, GOPINATHAN A, WAGNER A, GRADY WM, DENG CX, HRUBAN RH, ADSAY NV, TUVESON DA, et al. , 2007. Kras(G12D) and Smad4/Dpc4 haploinsufficiency cooperate to induce mucinous cystic neoplasms and invasive adenocarcinoma of the pancreas. Cancer Cell, 11, 229–43. [DOI] [PubMed] [Google Scholar]
- JONES S, ZHANG X, PARSONS DW, LIN JC, LEARY RJ, ANGENENDT P, MANKOO P, CARTER H, KAMIYAMA H, JIMENO A, et al. , 2008. Core signaling pathways in human pancreatic cancers revealed by global genomic analyses. Science, 321, 1801–6. [DOI] [PMC free article] [PubMed] [Google Scholar]
- KOONG AC, DENKO NC, HUDSON KM, SCHINDLER C, SWIERSZ L, KOCH C, EVANS S, IBRAHIM H, LE QT, TERRIS DJ, et al. , 2000. Candidate genes for the hypoxic tumor phenotype. Cancer Res, 60, 883–7. [PubMed] [Google Scholar]
- KUMAR A, COLEMAN I, MORRISSEY C, ZHANG X, TRUE LD, GULATI R, ETZIONI R, BOLOURI H, MONTGOMERY B, WHITE T, et al. , 2016. Substantial interindividual and limited intraindividual genomic diversity among tumors from men with metastatic prostate cancer. Nat Med, 22, 369–78. [DOI] [PMC free article] [PubMed] [Google Scholar]
- LAWRENCE MS, STOJANOV P, POLAK P, KRYUKOV GV, CIBULSKIS K, SIVACHENKO A, CARTER SL, STEWART C, MERMEL CH, ROBERTS, et al. , 2013. Mutational heterogeneity in cancer and the search for new cancer-associated genes. Nature, 499, 214–8. [DOI] [PMC free article] [PubMed] [Google Scholar]
- LI H & DURBIN R 2009. Fast and accurate short read alignment with Burrows-Wheeler transform. Bioinformatics, 25, 1754–60. [DOI] [PMC free article] [PubMed] [Google Scholar]
- LUTTGES J, GALEHDARI H, BROCKER V, SCHWARTE-WALDHOFF I, HENNE-BRUNS D, KLOPPEL G, SCHMIEGEL W & HAHN SA 2001. Allelic loss is often the first hit in the biallelic inactivation of the p53 and DPC4 genes during pancreatic carcinogenesis. Am J Pathol, 158, 1677–83. [DOI] [PMC free article] [PubMed] [Google Scholar]
- MAKOHON-MOORE AP, MATSUKUMA K, ZHANG M, REITER JG, GEROLD JM, JIAO Y, SIKKEMA L, ATTIYEH MA, YACHIDA S, SANDONE C, et al. , 2018. Precancerous neoplastic cells can move through the pancreatic ductal system. Nature, 561, 201–205. [DOI] [PMC free article] [PubMed] [Google Scholar]
- MAKOHON-MOORE AP, ZHANG M, REITER JG, BOZIC I, ALLEN B, KUNDU D, CHATTERJEE K, WONG F, JIAO Y, KOHUTEK ZA, et al. , 2017. Limited heterogeneity of known driver gene mutations among the metastases of individual patients with pancreatic cancer. Nat Genet, 49, 358–366. [DOI] [PMC free article] [PubMed] [Google Scholar]
- MANDELKER D, ZHANG L, KEMEL Y, STADLER ZK, JOSEPH V, ZEHIR A, PRADHAN N, ARNOLD A, WALSH MF, LI Y, et al. , 2017. Mutation Detection in Patients With Advanced Cancer by Universal Sequencing of Cancer-Related Genes in Tumor and Normal DNA vs Guideline-Based Germline Testing. JAMA, 318, 825–835. [DOI] [PMC free article] [PubMed] [Google Scholar]
- MARTINCORENA I, RAINE KM, GERSTUNG M, DAWSON KJ, HAASE K, VAN LOO P, DAVIES H, STRATTON MR & CAMPBELL PJ 2017. Universal Patterns of Selection in Cancer and Somatic Tissues. Cell, 171, 1029–1041 e21. [DOI] [PMC free article] [PubMed] [Google Scholar]
- MCDONALD OG, LI X, SAUNDERS T, TRYGGVADOTTIR R, MENTCH SJ, WARMOES MO, WORD AE, CARRER A, SALZ TH, NATSUME S, et al. , 2017. Epigenomic reprogramming during pancreatic cancer progression links anabolic glucose metabolism to distant metastasis. Nat Genet, 49, 367–376. [DOI] [PMC free article] [PubMed] [Google Scholar]
- MCKENNA A, HANNA M, BANKS E, SIVACHENKO A, CIBULSKIS K, KERNYTSKY A, GARIMELLA K, ALTSHULER D, GABRIEL S, DALY M, et al. , 2010. The Genome Analysis Toolkit: a MapReduce framework for analyzing next-generation DNA sequencing data. Genome Res, 20, 1297–303. [DOI] [PMC free article] [PubMed] [Google Scholar]
- MCPHERSON A, ROTH A, LAKS E, MASUD T, BASHASHATI A, ZHANG AW, HA G, BIELE J, YAP D, WAN A, et al. , 2016. Divergent modes of clonal spread and intraperitoneal mixing in high-grade serous ovarian cancer. Nat Genet, 48, 758–67. [DOI] [PubMed] [Google Scholar]
- MERMEL CH, SCHUMACHER SE, HILL B, MEYERSON ML, BEROUKHIM R & GETZ G 2011. GISTIC2.0 facilitates sensitive and confident localization of the targets of focal somatic copy-number alteration in human cancers. Genome Biol, 12, R41. [DOI] [PMC free article] [PubMed] [Google Scholar]
- MOFFITT RA, MARAYATI R, FLATE EL, VOLMAR KE, LOEZA SG, HOADLEY KA, RASHID NU, WILLIAMS LA, EATON SC, CHUNG AH, et al. , 2015. Virtual microdissection identifies distinct tumor- and stroma-specific subtypes of pancreatic ductal adenocarcinoma. Nat Genet, 47, 1168–78. [DOI] [PMC free article] [PubMed] [Google Scholar]
- MOSKALUK CA, HRUBAN RH & KERN SE 1997. p16 and K-ras gene mutations in the intraductal precursors of human pancreatic adenocarcinoma. Cancer Res, 57, 2140–3. [PubMed] [Google Scholar]
- NAXEROVA K, REITER JG, BRACHTEL E, LENNERZ JK, VAN DE WETERING M, ROWAN A, CAI T, CLEVERS H, SWANTON C, NOWAK MA, et al. , 2017. Origins of lymphatic and distant metastases in human colorectal cancer. Science, 357, 55–60. [DOI] [PMC free article] [PubMed] [Google Scholar]
- NOTTA F, CHAN-SENG-YUE M, LEMIRE M, LI Y, WILSON GW, CONNOR AA, DENROCHE RE, LIANG SB, BROWN AM, KIM JC, et al. , 2016. A renewed model of pancreatic cancer evolution based on genomic rearrangement patterns. Nature, 538, 378–382. [DOI] [PMC free article] [PubMed] [Google Scholar]
- PECTASIDES E, STACHLER MD, DERKS S, LIU Y, MARON S, ISLAM M, ALPERT L, KWAK H, KINDLER H, POLITE B, et al. , 2018. Genomic Heterogeneity as a Barrier to Precision Medicine in Gastroesophageal Adenocarcinoma. Cancer Discov, 8, 37–48. [DOI] [PMC free article] [PubMed] [Google Scholar]
- QIAN ZR, RUBINSON DA, NOWAK JA, MORALES-OYARVIDE V, DUNNE RF, KOZAK MM, WELCH MW, BRAIS LK, DA SILVA A, LI T, et al. , 2018. Association of Alterations in Main Driver Genes With Outcomes of Patients With Resected Pancreatic Ductal Adenocarcinoma. JAMA Oncol, 4, e173420. [DOI] [PMC free article] [PubMed] [Google Scholar]
- RAHIB L, SMITH BD, AIZENBERG R, ROSENZWEIG AB, FLESHMAN JM & MATRISIAN LM 2014. Projecting cancer incidence and deaths to 2030: the unexpected burden of thyroid, liver, and pancreas cancers in the United States. Cancer Res, 74, 2913–21. [DOI] [PubMed] [Google Scholar]
- RAUSCH T, ZICHNER T, SCHLATTL A, STUTZ AM, BENES V & KORBEL JO 2012. DELLY: structural variant discovery by integrated paired-end and split-read analysis. Bioinformatics, 28, i333–i339. [DOI] [PMC free article] [PubMed] [Google Scholar]
- RUDLOFF U, BHANOT U, GERALD W, KLIMSTRA DS, JARNAGIN WR, BRENNAN MF & ALLEN PJ 2010. Biobanking of human pancreas cancer tissue: impact of ex-vivo procurement times on RNA quality. Ann Surg Oncol, 17, 2229–36. [DOI] [PMC free article] [PubMed] [Google Scholar]
- RYAN DP, HONG TS & BARDEESY N 2014. Pancreatic adenocarcinoma. N Engl J Med, 371, 1039–49. [DOI] [PubMed] [Google Scholar]
- SAUNDERS CT, WONG WS, SWAMY S, BECQ J, MURRAY LJ & CHEETHAM RK 2012. Strelka: accurate somatic small-variant calling from sequenced tumor-normal sample pairs. Bioinformatics, 28, 1811–7. [DOI] [PubMed] [Google Scholar]
- SMID M, RODRIGUEZ-GONZALEZ FG, SIEUWERTS AM, SALGADO R, PRAGER-VAN DER SMISSEN WJ, VLUGT-DAANE MV, VAN GALEN A, NIK-ZAINAL S, STAAF J, BRINKMAN AB, et al. , 2016. Breast cancer genome and transcriptome integration implicates specific mutational signatures with immune cell infiltration. Nat Commun, 7, 12910. [DOI] [PMC free article] [PubMed] [Google Scholar]
- SORENSEN BS, TOUSTRUP K, HORSMAN MR, OVERGAARD J & ALSNER J 2010. Identifying pH independent hypoxia induced genes in human squamous cell carcinomas in vitro. Acta Oncol, 49, 895–905. [DOI] [PubMed] [Google Scholar]
- SUN Y, ZHANG G, HE Z, WANG Y, CUI J & LI Y 2016. Effects of copper oxide nanoparticles on developing zebrafish embryos and larvae. Int J Nanomedicine, 11, 905–18. [DOI] [PMC free article] [PubMed] [Google Scholar]
- TANAKA M, FERNANDEZ-DEL CASTILLO C, ADSAY V, CHARI S, FALCONI M, JANG JY, KIMURA W, LEVY P, PITMAN MB, SCHMIDT CM, et al. , 2012. International consensus guidelines 2012 for the management of IPMN and MCN of the pancreas. Pancreatology, 12, 183–97. [DOI] [PubMed] [Google Scholar]
- THERASSE P, ARBUCK SG, EISENHAUER EA, WANDERS J, KAPLAN RS, RUBINSTEIN L, VERWEIJ J, VAN GLABBEKE M, VAN OOSTEROM AT, CHRISTIAN MC, et al. , 2000. New guidelines to evaluate the response to treatment in solid tumors. European Organization for Research and Treatment of Cancer, National Cancer Institute of the United States, National Cancer Institute of Canada. J Natl Cancer Inst, 92, 205–16. [DOI] [PubMed] [Google Scholar]
- TOUSTRUP K, SORENSEN BS, NORDSMARK M, BUSK M, WIUF C, ALSNER J & OVERGAARD J 2011. Development of a hypoxia gene expression classifier with predictive impact for hypoxic modification of radiotherapy in head and neck cancer. Cancer Res, 71, 5923–31. [DOI] [PubMed] [Google Scholar]
- TRAPNELL C, ROBERTS A, GOFF L, PERTEA G, KIM D, KELLEY DR, PIMENTEL H, SALZBERG SL, RINN JL & PACHTER L 2012. Differential gene and transcript expression analysis of RNA-seq experiments with TopHat and Cufflinks. Nat Protoc, 7, 562–78. [DOI] [PMC free article] [PubMed] [Google Scholar]
- TRAPNELL C, WILLIAMS BA, PERTEA G, MORTAZAVI A, KWAN G, VAN BAREN MJ, SALZBERG SL, WOLD BJ & PACHTER L 2010. Transcript assembly and quantification by RNA-Seq reveals unannotated transcripts and isoform switching during cell differentiation. NatBiotechnol, 28, 511–5. [DOI] [PMC free article] [PubMed] [Google Scholar]
- VAN HEERDEN JA, MCILRATH DC, DOZOIS RR & ADSON MA 1981a. Radical pancreatoduodenectomy--a procedure to be abandoned? Mayo Clin Proc, 56, 601–6. [PubMed] [Google Scholar]
- VAN HEERDEN JA, REMINE WH, WEILAND LH, MCILRATH DC & ILSTRUP DM 1981b. Total pancreatectomy for ductal adenocarcinoma of the pancreas. Mayo Clinic experience. Am J Surg, 142, 308–11. [DOI] [PubMed] [Google Scholar]
- WADDELL N, PAJIC M, PATCH AM, CHANG DK, KASSAHN KS, BAILEY P, JOHNS AL, MILLER D, NONES K, QUEK K, et al. , 2015. Whole genomes redefine the mutational landscape of pancreatic cancer. Nature, 518, 495–501. [DOI] [PMC free article] [PubMed] [Google Scholar]
- WANG J, MULLIGHAN CG, EASTON J, ROBERTS S, HEATLEY SL, MA J, RUSCH MC, CHEN K, HARRIS CC, DING L, et al. , 2011. CREST maps somatic structural variation in cancer genomes with base-pair resolution. Nat Methods, 8, 652–4. [DOI] [PMC free article] [PubMed] [Google Scholar]
- WANG JD, JIN K, CHEN XY, LV JQ & JI KW 2017. Clinicopathological significance of SMAD4 loss in pancreatic ductal adenocarcinomas: a systematic review and meta-analysis. Oncotarget, 8, 16704–16711. [DOI] [PMC free article] [PubMed] [Google Scholar]
- WHITTLE MC, IZERADJENE K, RANI PG, FENG L, CARLSON MA, DELGIORNO KE, WOOD LD, GOGGINS M, HRUBAN RH, CHANG AE, et al. , 2015. RUNX3 Controls a Metastatic Switch in Pancreatic Ductal Adenocarcinoma. Cell, 161, 1345–60. [DOI] [PMC free article] [PubMed] [Google Scholar]
- WILENTZ RE, GERADTS J, MAYNARD R, OFFERHAUS GJ, KANG M, GOGGINS M, YEO CJ, KERN SE & HRUBAN RH 1998. Inactivation of the p16 (INK4A) tumor-suppressor gene in pancreatic duct lesions: loss of intranuclear expression. Cancer Res, 58, 4740–4. [PubMed] [Google Scholar]
- WILENTZ RE, GOGGINS M, REDSTON M, MARCUS VA, ADSAY NV, SOHN TA, KADKOL SS, YEO CJ, CHOTI M, ZAHURAK, et al. , 2000. Genetic, immunohistochemical, and clinical features of medullary carcinoma of the pancreas: A newly described and characterized entity. Am J Pathol, 156, 1641–51. [DOI] [PMC free article] [PubMed] [Google Scholar]
- WITKIEWICZ AK, MCMILLAN EA, BALAJI U, BAEK G, LIN WC, MANSOUR J, MOLLAEE M, WAGNER KU, KODURU P, YOPP A, et al. , 2015. Whole-exome sequencing of pancreatic cancer defines genetic diversity and therapeutic targets. Nat Commun, 6, 6744. [DOI] [PMC free article] [PubMed] [Google Scholar]
- YACHIDA S, JONES S, BOZIC I, ANTAL T, LEARY R, FU B, KAMIYAMA M, HRUBAN RH, ESHLEMAN JR, NOWAK MA, et al. , 2010. Distant metastasis occurs late during the genetic evolution of pancreatic cancer. Nature, 467, 1114–7. [DOI] [PMC free article] [PubMed] [Google Scholar]
- YATES LR, GERSTUNG M, KNAPPSKOG S, DESMEDT C, GUNDEM G, VAN LOO P, AAS T, ALEXANDROV LB, LARSIMONT D, DAVIES H, et al. , 2015. Subclonal diversification of primary breast cancer revealed by multiregion sequencing. Nat Med, 21, 751–9. [DOI] [PMC free article] [PubMed] [Google Scholar]
- YATES LR, KNAPPSKOG S, WEDGE D, FARMERY JHR, GONZALEZ S, MARTINCORENA I, ALEXANDROV LB, VAN LOO P, HAUGLAND HK, LILLENG PK, et al. , 2017. Genomic Evolution of Breast Cancer Metastasis and Relapse. Cancer Cell, 32, 169–184 e7. [DOI] [PMC free article] [PubMed] [Google Scholar]
- ZEHIR A, BENAYED R, SHAH RH, SYED A, MIDDHA S, KIM HR, SRINIVASAN P, GAO J, CHAKRAVARTY D, DEVLIN SM, et al. , 2017. Mutational landscape of metastatic cancer revealed from prospective clinical sequencing of 10,000 patients. Nat Med, 23, 703–713. [DOI] [PMC free article] [PubMed] [Google Scholar]
Associated Data
This section collects any data citations, data availability statements, or supplementary materials included in this article.
Supplementary Materials
Table S1, related to Figure 1. Patient recruitment and tissue extraction details
Table S3, related to Figure 4. Copy number segments highlighted by GISTIC in unpaired PDAC primaries and metastases
Data Availability Statement
For the resected primary tumors, clinical information and variant calls are available from the International Cancer Genome Consortium (ICGC) data portal https://dcc.icgc.org/. Raw reads for other cases are available from the European Genome Phenome Archive https://www.ebi.ac.uk/ega/home (Study ID EGAS00001002543).