Abstract
Objective
To investigate whether cool-evoked potentials (CEP) elicited by brisk innocuous cooling of the skin could serve as an alternative to laser-evoked potentials (LEP), currently considered as the best available neurophysiological tool to assess the spinothalamic tract and diagnose neuropathic pain.
Methods
A novel device made of micro-Peltier elements and able to cool the skin at - 300°C/s was used to record CEPs elicited by stimulation of the hand dorsum in 40 healthy individuals, characterize the elicited responses, and assess their signal-to-noise ratio. Various stimulation surfaces (40 mm2 and 120 mm2), cooling ramps (-200°C/s and -133°C/s) and temperature steps (20°C, 15°C, 10°C, 5°C) were tested to identify optimal stimulation conditions.
Results
CEPs were observed in all conditions and subjects, characterized by a biphasic negative-positive complex maximal at the vertex (Cz), peaking 190-400 ms after stimulus onset, preceded by a negative wave over central-parietal areas contralateral to the stimulated hand. Their magnitude was modulated by stimulation surface, cooling ramp and temperature step.
Conclusion
Rapid innocuous skin cooling elicits robust CEPs at latencies compatible with the conduction velocity of Aδ-fibers.
Significance
CEPs can be a complementary tool to the recording of LEPS for assessing the function of small-diameter Aδ-fibers and the spinothalamic tract.
Keywords: Cool perception, Electroencephalogram, a-delta fibers, High speed cooling ramp, Cool evoked potentials
Introduction
Neuropathic pain is defined by the International Association for the Study of Pain as “pain arising as a direct consequence of a lesion or disease of the somatosensory system” (Loeser and Treede, 2008). This implies that the diagnostic work-up of neuropathic pain requires clinical tools to assess the function of the somatosensory system, including the function of the spinothalamic system. The most recent guidelines on neuropathic pain assessment state that the recording of laser-evoked brain potentials (LEPs) – i.e. brain responses elicited by the brief activation of heat-sensitive skin nociceptors and their spinothalamic projections – is currently the best-available clinical tool to assess spinothalamic function (Cruccu et al., 2010). Despite these recommendations and while the clinical usefulness of LEPs has been demonstrated (Di Stefano et al., 2017), clinical investigations using LEPs remains limited to a small number of centers (Haanpaä et al., 2011). There are several explanations for this. First, laser stimulators are relatively costly and, most importantly, their use requires abiding to the strict safety regulations of Class IV lasers. Second, irradiating the skin with a laser entails a risk of inducing accidental burn lesions. Third, the stimuli can be perceived as painful.
The recording of cool-evoked brain potentials (CEPs) – i.e. brain responses elicited by the brief activation of cool-sensitive afferents of the skin, could constitute an interesting alternative to the recording of LEPs. Furthermore, CEPs and LEPs could provide complementary information, as there is evidence that cold and heat perception can be differentially impacted in neuropathic pain. For example, several studies have shown a dissociation between heat hyperalgesia and cold allodynia (Jensen and Finnerup, 2014; Maier et al., 2010).
Step decreases of skin temperature are known to generate strong and transient activity in cool-sensitive Aδ-fiber afferents (Darian-Smith et al., 1973), compatible with the recording of time-locked responses such as ERPs. Duclaux et al. (1974) were probably the first to record CEPs. The cool stimuli consisted of a temperature decrease of 10 °C from baseline, occurring at a maximum rate of -17°C/s and lasting 5 s. The latency of the CEPs elicited by stimulation of the hand palm was compatible with the conduction velocity of cool-sensitive Aδ-fibers. Using a contact thermode able to generate cooling ramps of 21°C/s, Jamal et al. (1989) also showed that CEPs can be recorded in healthy controls. Furthermore, they showed that CEPs were abolished in two patients with abnormally-elevated thermal detection thresholds, one with severe small fiber neuropathy, the other with syringomyelia. More recently, Hülleman et al., (2016) recorded CEPs in healthy participants, by cooling the skin from 30 to 25°C in approximately 0.5 s, i.e. a cooling rate of -10°C/s. When stimulating the hand dorsum, the stimulus elicited a negative-positive complex, peaking 300-500 ms after stimulation onset, and having a shape and scalp topography resembling the shape and scalp topography of LEPs. This negative-positive complex was preceded by an earlier negative wave, peaking approximately 250 ms after stimulus onset, and maximal at scalp electrodes contralateral to the stimulated hand.
An important limitation of these ERP studies is that the stimulators used to elicit CEPs were not able to generate very steep cooling ramps. Slow cooling rates may explain the relatively low signal-to-noise ratio (SNR) of the reported responses, and poor visibility of CEPs constitutes an important limitation for its use as a clinical diagnostic tool. In the present study, we report CEPs elicited by a novel cooling stimulator that is able to generate very steep cooling ramps of up to -300°C/s. Furthermore, we characterize the effect of varying stimulation surface, amplitude of temperature step and steepness of cooling ramp in order to determine optimal stimulation parameters.
Materials and Methods
Participants
Twenty-one healthy volunteers (9 male, 11 female, 3 left handed, age: 24 ±5 years [mean ±SD; range 18-41]) were included in Experiment 1, and twenty-one healthy volunteers (9 male, 12 female, 2 left handed, age: 25 ±4 years [range 20-38]) were included in Experiment 2. The experiments were performed according to the declaration of Helsinki and approved by the local ethical committee. All participants signed a written informed consent.
Cool stimulation
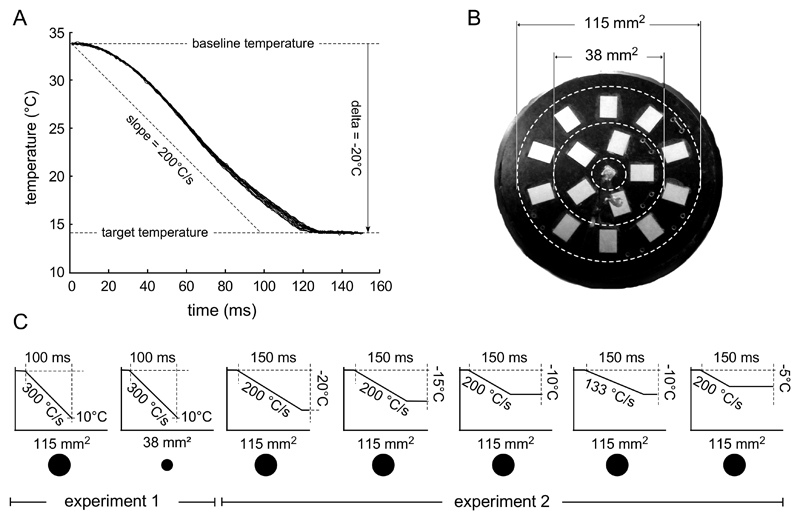
Subjects were comfortably seated with their arms resting on a soft surface, and their volar forearm facing upwards. The cooling stimuli were delivered to the volar forearm using a custom contact cooling device consisting of a control unit connected to a stimulation probe (TCS; Pr. André Dufour, University of Strasbourg; Figure 1B). The stimulation probe has a flat 160 mm2 surface in which 16 micro Peltier elements are embedded. 15 micro-Peltier elements have a surface of 7.7 mm2 and the central micro-Peltier element has a surface of 2 mm2. Before the start of the experiment, the temperature of the skin was measured at three different locations of the volar forearm using an infrared temperature measurement device (Tempett, SenseLab, Sweden). The average of the three measures was used to set the neutral skin temperature of the stimulation probe, i.e. the temperature of the probe in the absence of stimulation. During the experiment, the probe, weighting 440 grams, was manually displaced after each stimulus. The TCS is able to cool the skin with very steep ramps of up to -300°C/s (Figure 1A). A thermocouple located at the centre of the stimulation surface is used to drive the micro-Peltier elements at a frequency of 1000 Hz. Since the thermocouple is embedded in the solder of the central micro-Peltier, the influence of skin temperature is negligible, namely 0.1°C for a stimulation temperature of 20°C below skin temperature. In addition to controlling target temperature and steepness of the cooling ramp, the TCS allows adjusting the size of the stimulated surface by determining which Pelletier elements are active during stimulation. Activation of all micro-Peltier elements resulted in a ~120 mm2 stimulation surface (15x7.7 mm2 + 2 mm2). Activation of only the central element (2 mm2) and the first concentric array of elements (5x7.7 mm2) resulted in a ~40 mm2 stimulation surface. (Figure 1B).
Figure 1.
A. Time-course of skin temperature cooling generated by the contact cold stimulator and measured by the thermocouple located at the centre of the stimulation surface for a requested decrease of 20°C relative to baseline at 200°C/s. Note that the ramp actually reaches 200°C/s, but with a small delay of approximately 20 ms. B. Surface of the stimulation probe containing micro-Peltier elements (white rectangles). The two circles depict the two stimulation surfaces used (40 mm2 and 120 mm2). C. Overview of the different stimulation profiles used in the two experiments.
Experiment 1
In this experiment, we sought to investigate the effect of stimulation surface (40mm2 vs. 120 mm2) on the responses to cool stimuli having a fixed target temperature (10 °C), a fixed stimulus duration (100 ms), and a fixed cooling ramp (-300°C/s) (Figure 1C). A total of 160 stimuli were delivered in an intermingled fashion, in four blocks of 40 stimuli each. The inter-stimulus interval (ISI) was self-paced, with a minimum of 8 s. Participants were asked to rate the intensity of perception of each stimulus on a Numeric Rating Scale (NRS) that ranged between 0 (“no detection”) to 100 (“the coolest intensity I can imagine”).
Experiment 2
In this experiment, we tested the effect of varying the size of the temperature step (respectively -5, -10, -15 and -20°C relative to the baseline skin temperature), as well as the effect of varying the steepness of the cooling ramp (-133 vs. -200°C/s). We thus recorded responses to five different types of stimuli: -5°C, -10°C, -15°C and -20°C delivered using a - 200°C/s cooling ramp, -10°C delivered using a -133°C/s cooling ramp. A schematic representation of the different temperature profiles is shown in Figure 1C. All stimuli lasted 150 ms. The different stimuli were delivered in an intermingled fashion. Each type of stimulus was repeated 20 times, yielding a total of 100 stimuli, divided in 4 blocks of 25 stimuli. Participants were asked to rate the intensity of 25 stimulations out of 100 (5 per condition), randomised across the entire experiment, using the same NRS scale as in Experiment 1.
In both experiments, the stimuli were delivered to the left or right forearm. The stimulated arm was counterbalanced between participants.
Electroencephalogram (EEG)
The EEG was recorded using 32 actively shielded Ag-AgCl electrodes mounted in an elastic electrode cap and arranged according to the International 10-20 system (WaveGuard 32-channel EEG cap; Advanced Neuro Technologies). Participants were instructed to keep their gaze fixed below eye level and to sit as still as possible. The EEG signal was amplified and digitized using a sampling rate of 1000 Hz and an average reference (HS64; Advanced Neuro Technologies). Eye movements were recorded using two surface electrodes placed at the upper-left and lower-right sides of the left eye. Impedance was kept under 20 kΩ for all leads.
The EEG recordings were analysed offline using LetsWave 6 (nocions.org/letswave). As a first step, we applied a 50 Hz notch filter and a 0.3-30 Hz bandpass filter to the continuous EEG data (zero-phase Butterworth filter; 12 dB per octave). The EEG was then segmented into epochs extending from -500 to +1,000 ms relative to stimulus onset. Artefacts due to eye blinks or eye movements were then removed using a validated method based on an independent-component analysis (FastICA algorithm) (Hyvärinen and Oja, 2000). Epochs with amplitude values exceeding ±100 uV were rejected as these were likely contaminated by artefacts. After baseline correction (reference interval: -500 to 0 ms), the data was rereferenced to the average of the left and right mastoid electrodes (M1M2), as well as on Fz (in different datasets). Separate average waveforms were computed for each participant and experimental condition. Two participants in Experiment 1 and one participant in Experiment 2 were excluded from the EEG analysis due to a technical problem with the EEG system not acquiring all stimulation triggers.
Within each average waveform, three peaks were identified in each participant and condition, referred to as N1/P1, N2 and P2. Using the average mastoids as reference, the N1/P1 appeared as a negative deflection over contralateral posterior-parietal areas (N1) and a positive deflection over frontal areas (P1), with a polarity reversal over contralateral central regions. Therefore, this component was identified at central-parietal electrode (CP5/CP6) contralateral to the stimulated forearm, referenced to Fz. In this montage, the N1/P1 appears as a negative wave preceding the N2. It was defined as the first negative deflection between 160 and 220ms after stimulation onset. The later N2 and P2 waves were identified at electrode Cz referenced to M1M2. The N2 was defined as the largest negative deflection between 220 and 300 ms, and the P2 was defined as the first positive deflection following N2.
Statistical analyses
The following statistical tests were used to assess the effect of stimulation surface (Experiment 1: 40 mm2 vs. 120 mm2), temperature step (Experiment 2: -5°C, -10°C, -15°C and -20°C) and steepness of cooling ramp (Experiment 2: -133°C/s vs. -200°C/s) on the average ratings of intensity of perception (Table 1), the peak latency and amplitude of the N1/P1, N2 and P2 waves of CEPs, as well as the N2-P2 peak-to-peak amplitude (Table 1). In Experiment 1, a paired t-test was used to compare the responses obtained for the two stimulation surfaces (40 mm2 vs. 120 mm2). In Experiment 2, a one-way repeated-measures ANOVA with the factor ‘amplitude of temperature step’ (four levels: -5°C, -10°C, -15°C and - 20°C) was used to compare the responses obtained for the stimuli delivered using a - 200°C/s cooling ramp. When justified, post-hoc contrasts were performed, correcting for multiple comparison with the Tukey procedure. A paired t-test was used to compare the responses to the -10°C stimulus delivered using a -133°C/s vs. -200°C/s ramp.
Table 1.
Average and standard deviation of intensity of perception, CEP amplitude and CEP latencies obtained in Experiment 1. The last column indicates the statistical results of the paired t-test testing for the difference between the two surface areas (40 mm2 vs. 120 mm2).
| Surface area (mm2) | 40 | 120 | Effect of surface area |
| Cooling ramp (°C/s) | 300 | 300 | |
| Target temperature (°C) | 10 | 10 | |
| Duration (ms) | 100 | 100 | |
| Intensity of perception | 13.2 ±10.3 | 24.0 ±10.5 | p=.001 |
| N1/P1 amplitude (uV) | -4.4 ±2.5 | -4.6 ±1.6 | p=0.27 |
| N2 amplitude (uV) | -4.1 ±4.1 | -6.6 ±4.7 | p=<.001 |
| P2 amplitude (uV) | 9.2 ±3.1 | 12.3 ±4.0 | p=<.001 |
| N2-P2 amplitude (uV) | 13.9 ±5.3 | 18.5 ±6.0 | p=<.001 |
| N1/P1 latency (ms) | 193 ±16 | 189 ± 18 | p=.60 |
| N2 latency (ms) | 221 ±48 | 216 ±37 | p=.64 |
| P2 latency (ms) | 396 ±59 | 395 ±58 | p=.94 |
Results
Experiment 1
Intensity of perception
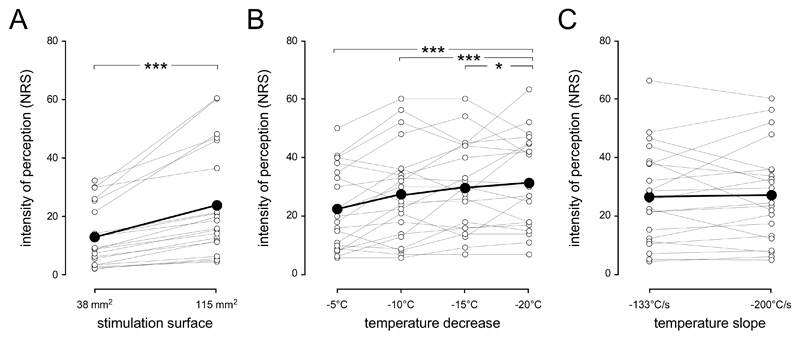
None of the participants qualified any of the cool stimuli as painful. The average rating of the intensity of perception to cool stimuli (-10°C, -300°C/s) was 13 ±10 for the 40 mm2 stimulation surface and 24 ±10 for the 120 mm2 stimulation surface (table 1). This difference was significant (t (19) =-5.04, p<0.001, 95%CI [-15.28;-6.31]) (Figure 2A).
Figure 2.
Intensity of perception. A. The intensity of the cool percept elicited by brief cooling of the skin is dependent on stimulation surface. Stimulation with a large surface (120 mm2) is perceived as cooler than stimulation with a small surface (40 mm2). B. The intensity of cool perception also varies with the amplitude of the temperature step. All temperature steps greater than 5°C from baseline skin temperature are perceived as cooler than the sensation elicited by the 5°C step. C. Varying the steepness of the cooling ramp (-133°C/s vs. -200°C/s) does not influence the intensity of cool perception. Single-subject data is shown as thin lines with white connectors. Group-level averages are shown as thick lines with black connectors. * p<.05, *** p<.001 (paired-sample t-tests).
Cool-evoked brain potentials
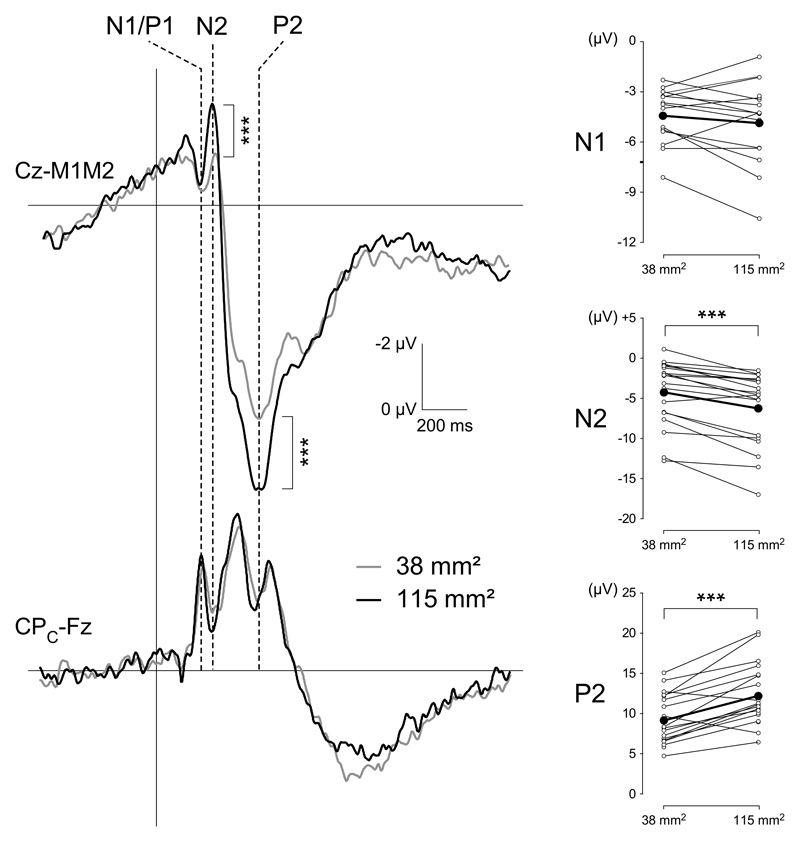
Clear N2 and P2 waves were identified for each participant and condition (Figure 3). N1/P1 components were identified in 17/21 subjects for stimulation using the large surface area, and 15/21 subjects for stimulation using the small surface area. In most average waveforms, a negative drift was observed starting before the onset of the stimulus. This drift is likely to reflect a contingent negative variation related to the anticipation of the stimulus (Brunia et al., 2012). The mean amplitudes of the N1/P1, N2 and P2 waves were -4.4 ±2.5 uV, -4.14 ±4.1 uV and 9.2 ±3.1 uV for the 40 mm2 surface and - 4.6 ±1.6 uV, -6.6 ±4.7 uV and 12.3 ±4.0 uV for the 120 mm2 surface (Table 1). The magnitude of N2 wave (t (19) = 4.3921, p<0.001, 95%CI [0.9; 2.3]), P2 wave (t (19) = -5.9771, p<0.001, 95%CI [-4.2; -2.0]) and peak-to-peak N2-P2 (t (19)=-8.87, p<0.001, 95%CI[-5.8; -3.6]) elicited by the 120 mm2 surface were significantly greater as compared to the responses elicited by 40 mm2 surface. No difference was found on the N1P1 wave (t(14) = -1.14, p=0.27, 95% CI [- 1.3 0.4]).
Figure 3.
Effect of stimulation surface (40 mm2 vs. 120 mm2) on cool-evoked ERPs. The upper waveforms correspond to the group-level average CEPs recorded at Cz vs. M1M2. The lower waveforms correspond to the group-level average CEPs recorded at the contralateral centra-parietal electrode CPC vs. Fz. Larger N2 and P2 amplitudes were obtained for the large stimulation surface. The graphs shown on the right correspond to the individual (thin lines
The mean latencies of the N1/P1, N2 and P2 waves were 193 ± 16 ms, 221 ±48 ms and 396 ±59 ms for the 40 mm2 surface, and 189 ±18 ms, 216 ±37 ms and 395 ±58 ms for the 120 mm2 surface (Table 1). There was no significant effect of stimulation surface on the latencies of the N1, N2 and P2 waves.
Experiment 2
Intensity of perception
The average ratings for the different stimuli are reported in Table 2 and Figure 2B. The repeated-measures ANOVA showed a significant effect of the temperature step (F (3,20) = 8.616, p<0.001, Partial ɳ2 = 0.05). Post-hoc comparisons showed that the -20°C, -15°C and -10°C temperature steps were perceived as more intense than the -5°C temperature steps (p<0.001, p=0.001 and p=0.04, respectively). All other comparisons were not significant (all p-values >0.18) (Figure 2B). There was no effect of the steepness of the cooling ramp (-133°C/s vs. -200°C/s) on the reported intensities of perception (t (20) = 0.25, p = 0.805 [-3.4; 4.4]) (Figure 2C).
Table 2.
Average and standard deviation of intensity of perception, CEP amplitude and CEP latencies obtained in Experiment 2. The 6th column indicates the statistical results of the repeated measure ANOVA testing for differences between the different temperature steps (-5°C, -10°C, -15°C, -20°C). The last column indicates the statistical results of the paired t-test used to compare the effect of temperature slope (-10°C ; 200°C/s (3th column) vs. -10°C; 133°C/s (7th column).
| Surface area (mm2) | 120 | 120 | 120 | 120 | Effect of temperature step | 120 |
| Cooling ramp (°C/s) | 200 | 200 | 200 | 200 | 133 | |
| Temperature decrease (°C) | 5 | 10 | 15 | 20 | 10 | |
| Duration (ms) | 150 | 150 | 150 | 150 | 150 | |
| Intensity of perception | 22.8 ±13.8 | 27.9± 16.3 | 29.9 ± 15 | 31.8 ± 15.6 | p<.001 | 27.4 ± 16. |
| N1/P1 amplitude (uV) | -6.0 ±3.4 | -5.9± 3.4 | -6.1± 4.1 | -5.4± 3.9 | p=.628 | -5.5± 4.4 |
| N2 amplitude (uV) | -4.6 ±4.1 | -5.8± 5.1 | -5.4 ± 4.2 | 7.4± 6.0 | p=.024 | -6.6 ± 4.7 |
| P2 amplitude (uV) | 12.3 ±4.3 | 14.7± 6.6 | 14.2± 6.7 | 13.9± 8.0 | p=.069 | 13.0 ± 5.9 |
| N2-P2 amplitude (uV) | 16.9 ±6.2 | 20.4± 8.1 | 19.6 ± 8.8 | 21.3 ± 10.4 | p=.001 | 19.6 ± 8.7 |
| N1/P1 latency (ms) | 203 ± 19 | 197 ± 15 | 200 ± 19 | 194 ± 16 | p=.461 | 193 ± 22 |
| N2 latency (ms) | 267 ±28 | 278± 33 | 262 ± 30 | 263 ± 31 | p=.052 | 265± 35 |
| P2 latency (ms) | 405 ±56 | 402± 50 | 403 ± 59 | 406 ± 53 | p=.791 | 411± 49 |
Cool-evoked brain potentials
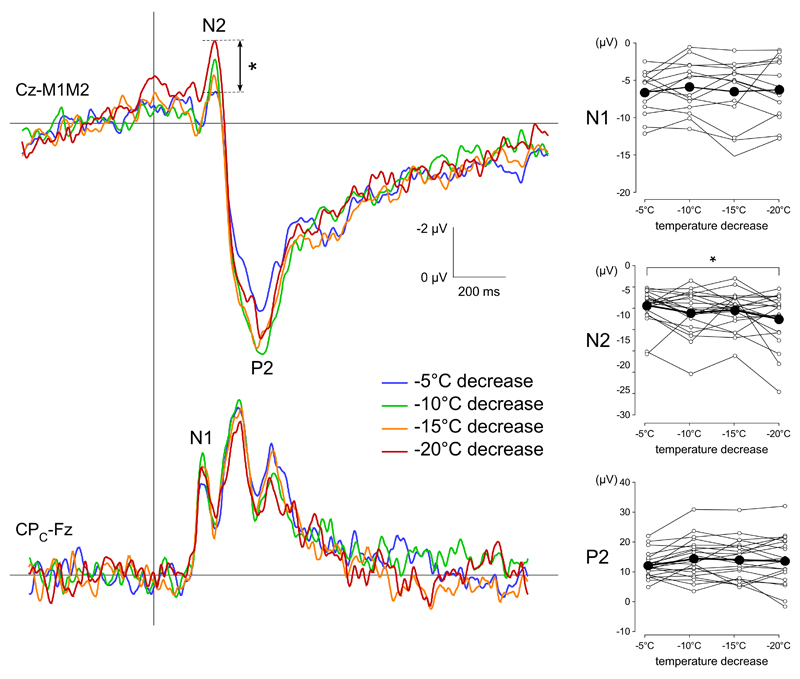
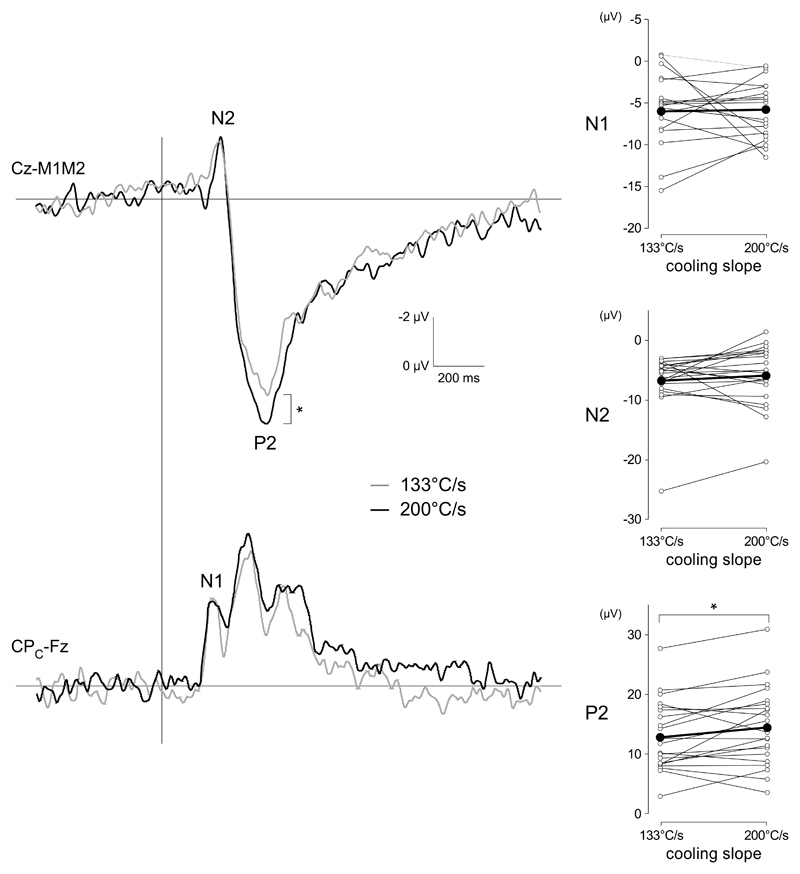
Such as in Experiment 1, clear N2 and P2 waves were identified for each participant and condition (Figure 4-5). N1/P1 were identified in all subjects, but not in all conditions (the N1 wave was identified across all temperature steps in 14/22 subjects and across both cooling ramps in 18/22 subjects). The average amplitudes and latencies of the N1/P1, N2 and P2 waves are reported in Table 2. Varying the temperature step between -5°C to -20°C relative to baseline had little effect on the magnitude of the elicited brain responses. Nevertheless, the repeated-measures ANOVA showed a significant effect of temperature step on the magnitude of the N2 wave (F(3,20)=3.367, p=0.024), as well as the N2-P2 peak-to-peak amplitude (F(3,20)=5.808, p=0.0015). Posthoc pairwise comparisons showed that the magnitude of the N2 wave elicited by the -20°C stimulus was significantly greater than the magnitude of the N2 wave elicited by the -5°C stimulus (p=0.016). The N2-P2 peak-to-peak amplitudes of the responses elicited by the -20°C stimulus and the -10°C stimulus were significantly greater than the N2-P2 peak-to-peak amplitude of the response elicited by the -5°C stimulus (p=0.001 and 0.01, respectively). All other pairwise comparisons were not significant. There was no significant effect of varying the temperature step on the magnitudes of the N1/P1 and P2 waves. There was also no significant effect of varying the temperature step on the latencies of the N1/P1, N2 and P2 waves (Figure 4).
Figure 4.
Effect of the size of the temperature step on cool-evoked ERPs. The upper waveforms correspond to the group-level average CEPs recorded at Cz vs. M1M2. The lower waveforms correspond to the group-level average CEPs recorded at the contralateral centra-parietal electrode CPC vs. Fz. For temperature steps ranging between -5°C and -20°C, the amplitude of the temperature step had little effect on CEP magnitude. Nevertheless, the magnitude of the N2 wave elicited by the -20°C was significantly greater than the magnitude of the N2 wave elicited by the -5°C stimulus. The graphs shown on the right correspond to the individual (thin lines with white connectors) and group-level average (thick lines with black connectors) N1 amplitude, N2 amplitude, P2 amplitude and N2-P2 peak-to-peak amplitude. * p<.05, **p<.01,***p<.001.
Figure 5.
Effect of cooling ramp (-133 vs. -200 °C/s) on cool-evoked ERPs. The upper waveforms correspond to the group-level average CEPs recorded at Cz vs. M1M2. The lower waveforms correspond to the group-level average CEPs recorded at the contralateral centra-parietal electrode CPC vs. Fz. At electrode Cz, larger P2 amplitudes were observed for the steeper cooling ramp (200°C/s). The graphs shown on the right correspond to the individual (thin lines with white connectors) and group-level average (thick lines with black connectors) of N1 amplitude, N2 amplitude, P2 amplitude and N2-P2 peak-to-peak amplitude. * p<.05.
Varying the cooling ramp of the stimuli with a temperature step of 10° C (-133°C/s vs. - 200°C) had a significant effect on the amplitude of the P2 wave (t(20)=2.23, p=0.037, 95%CI[0.11 3.16]) (Figure 5). There was no effect of cooling ramp on the magnitude of the N1/P1 and N2 waves, the N2-P2 peak-to-peak amplitude, or on the latencies of the N1/P1, N2 and P2 waves (Figure 5).
Signal-to-noise ratio of cool-evoked brain potentials
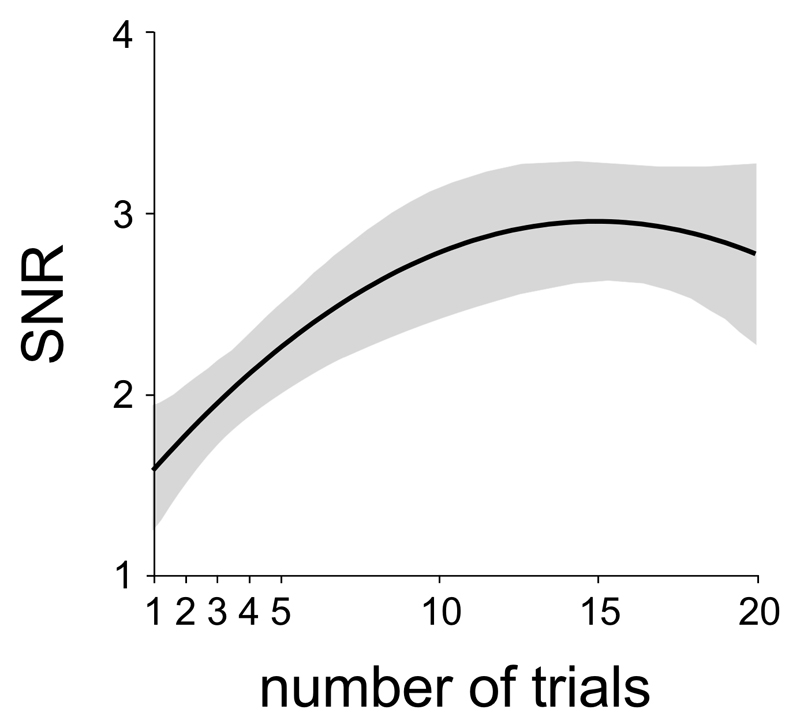
For each participant, we computed the signal-to-noise ratio (SNR) of the CEP waveforms elicited by the -20°C stimulus delivered at -200°C/s in Experiment 2, as a function of the number of trials. The SNR was calculated at electrode Cz vs. M1M2 by computing the ratio between peak-to-peak signal amplitude in the post-stimulus time window (0 – 500 ms relative to stimulation onset; corresponding to the magnitude of the N2-P2) and the peak-to-peak signal amplitude in a pre-stimulus time window (-500 – 0 ms relative to stimulation onset). The SNR was calculated using the EEG signal obtained on the first trial, and the waveforms obtained by averaging the first 2, 3, 4, 5, 10, 15 and 20 trials.
Discussion
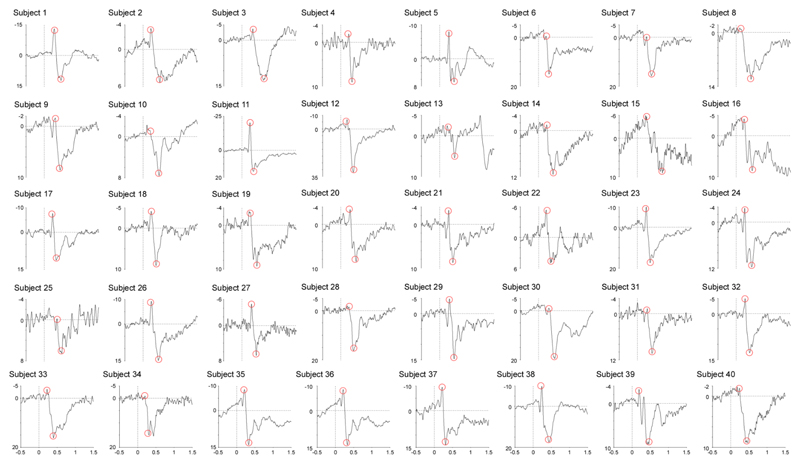
Here, we show that robust CEPs can be obtained using a novel cold stimulator able to achieve very steep cooling ramps up to -300°C/s. Indeed, the obtained CEP waveforms had a high signal-to-noise ratio (Figure 6) and were readily identified in each of the 40 healthy participants (Figure 7). This indicates that CEPs elicited by very rapid but innocuous and non-painful cooling of the skin can be used to assess the function of the spinothalamic system in humans and, hence, that CEPs could constitute an interesting alternative to LEPs for the diagnostic workup of neuropathic pain. Such as in previous studies, CEP latencies (190-400 ms when stimulating the volar forearm) were compatible with the conduction velocity of cool-sensitive thinly-myelinated Aδ-fibers.
Figure 6.
Signal-to-noise ratio (SNR) of cool-evoked ERPs elicited by the -20°C stimulus delivered at 200°C/s in Experiment 2, as a function of the number of trials used to compute the average waveforms. The black waveform corresponds to the average SNR across participants. The grey area corresponds to the standard error of the mean.
Figure 7.
Individual cool-evoked ERP with the N2 indicated by a first red circle, and the P2 indicate by the second one. CEPs were identified in all subjects.
Cool perception elicited by brisk innocuous cooling of the skin
Rapidly and briefly cooling the skin elicited a non-painful but vivid cool sensation. All stimuli were clearly perceived, but the intensity of the elicited sensations was greater for large vs. small decreases in skin temperature, as well as for stimulation using a large vs. small stimulation surface. Previous studies have shown that cool perception is abolished during the presence of an A-fibre nerve compression block (Oliveiro et al., 2005; van den Broeke et al., 2016), which strongly suggests that cool sensation is mediated by cool-sensitive A-fibres. Moreover, electrophysiological recordings of single nerve fibers in primates have identified a subpopulation of cool-sensitive A-fibers that (1) discharge rapidly at the onset of cooling the skin, (2) respond more strongly for fast vs. slow rates of cooling, (3) do not respond or respond minimally to mechanical stimuli and (4) have their ongoing activity suppressed by rapid warming of the skin (Darian-Smith et al., 1973; Dubner et al., 1975; Kenshalo and Duclaux, 1977). These A-fibers thus seem to respond exclusively to cool stimuli and may therefore be the primary mediators of cool perception, especially the brisk cool sensations triggered in the present study.
Cool-evoked brain potentials (CEPs)
The CEPs observed after stimulation of the volar forearm in the present study consisted in a series of three waves: an early-latency N1/P1 maximal over the hemisphere contralateral to the stimulated arm, followed by a large negative-positive complex maximal over the scalp vertex (N2 and P2 waves). The scalp topography of the early-latency N1/P1, negative over contralateral posterior-parietal areas and positive over frontal areas, with a polarity reversal over contralateral central areas, differs from the scalp topography of the N1 wave of LEPs that is typically observed after stimulation of the hand, consisting of a single negative peak maximal over contralateral central-temporal areas (Figure 8). This suggests that the cortical generators of the N1/P1 wave of CEPs are not entirely identical to the cortical generators of the N1 wave of LEPs. Source analysis studies have suggested that the N1 wave of LEPs reflects activity originating from several temporally-overlapping sources, within the contralateral operculo-insular cortex and, possibly, the contralateral primary somatosensory cortex (S1) (Valentini et al., 2012; Perchet et al., 2008; Valeriani et al., 2000). The fact that the N1 wave of CEPs exhibits a clear phase reversal over central areas suggests a strong contribution of a tangential source close to the central sulcus. In fact, this scalp topography closely resembles the scalp topography of the early-latency responses of somatosensory-evoked potentials, such as the N20 wave elicited by stimulation of the median nerve (Lenoir et al., 2017; Allison et al., 1991). These scalp topographies are compatible with activity originating from the posterior bank of the central sulcus, i.e. S1. The finding that S1 may contribute more strongly to CEPs as compared to LEPs is supported by the results of other studies suggesting a stronger involvement of S1 in the processing of cool vs. warm thermosensory input. For example, Mikenkovic et al. (2014) showed that inactivation of S1 neurons in rodents impairs their ability to detect small-amplitude cooling stimuli applied to the glabrous skin. Similarly, in humans, it was shown that transcranial direct current stimulation or repetitive transcranial magnetic stimulation of S1 selectively increases cool detection thresholds (Grundman et al., 2011; Oliveiro et al., 2005). The differential involvement of S1 in cool vs. warm perception could be related to the fact that coldness plays an important role in tactual perception, providing information to the material’s heat capacity and thermal conductivity (Tiest, 2010). However, such as for the responses elicited by brisk heating of the skin using a laser stimulator or contact heat (Garcia-Larrea et al., 2003), other areas such as the secondary somatosensory cortex, the insular cortex and the cingulate are likely to also contribute to the activity underlying CEPs (Maihöfner et al., 2002; Craig et al., 2000).
Figure 8.
Group-level average scalp topography of the N1/P1, N2 and P2 waves of cool-evoked ERPs (averaged across all conditions in Experiment 2).
Several factors could explain why the CEPs obtained in the present study using very steep cooling ramps had a high signal-to-noise ratio, and why the magnitude of the P2 wave elicited by a -200°C/s cooling ramp was greater than the P2 wave elicited by a -133°C cooling ramp. First, it can be explained by the fact that stimuli delivered using steep cooling ramps are likely to activate cool-sensitive afferents in a more synchronous fashion. Second, it can be explained by the fact that Aδ-fiber cool receptors respond more strongly to faster rates of skin cooling (Kenshalo and Duclaux, 1977).
Within the range of stimulation intensities explored in the present study (-5 to -20°C relative to baseline), CEPs were only marginally affected by the size of the temperature step. The lack of dose-response relationship between CEP amplitude and size of the temperature step could indicate that maximum discharge rate within the activated afferents is already reached at moderate intensities of stimulation. Supporting this interpretation, studies have shown that cool-sensitive afferents exhibit a bell-shaped stimulus-response function, with maximum discharge rates observed at 20-30°C (Schepers and Ringkamp, 2009).
Finally, use of a larger stimulation surface resulted in a P2 wave of greater magnitude. Such as the effect of stimulation surface on the intensity of perception, this effect of stimulation surface on the magnitude of the P2 wave of CEPs can be explained by an effect of spatial summation: cooling a larger area of the skin is likely to generate activity within a greater number of cool-sensitive afferents.
CEPs to assess spinothalamic function: advantages and limitations
Because CEPs reflect brain responses related to the selective activation of cool-sensitive Aδ-fibre free nerve endings of the skin and the transmission of that input via the spinothalamic tract, CEPs could be used as an alternative to LEPs to assess the integrity of the spinothalamic system. Furthermore, because brief cool stimuli do not activate the same peripheral afferents as brief laser heat stimuli, the recording of CEPs and LEPs could provide complementary information. Studies have shown that high intensity laser stimuli elicit LEPs predominantly related to the activation of quickly-adapting heat- and mechano-sensitive Aδ-fiber nociceptors (Bromm and Treede, 1987). LEPs related to the activation of quickly-adapting C-fiber nociceptors can also be obtained, but this requires to either avoid the concomitant activation of A-fiber nociceptors, or selectively block conduction within myelinated A-fibers (Nahra and Plaghki, 2003). Importantly, cold allodynia and cold hyperalgesia are frequent clinical findings in patients with neuropathic pain, and the mechanisms responsible for these conditions might differentially affect CEPs and LEPs (Maier et al., 2010).
One advantage of CEPs over LEPs is that the stimulation used to elicit CEPs is non-painful. Furthermore, because cool receptors of the skin have a low threshold, even small decreases in skin temperature elicit responses having a high signal-to-noise ratio, especially if steep cooling ramps are used.
One disadvantage of CEPs is that delivering the cool stimulus requires contact with the skin. Concomitant activation of low-threshold mechanoreceptors could thus interact with the obtained responses. Furthermore, single fibre recordings performed in animals have shown that cool receptors of the skin habituate strongly to repeated stimuli. Hence, reliable responses can probably be obtained only if the probe is slightly displaced after each stimulus, as was done in the present study.
Conclusion
We show in healthy participants that brisk non-painful cooling of the skin using a very steep cooling ramp can be used to elicit event-related potentials having a high signal-to-noise ratio. Because these responses are related to the selective activation of cool-sensitive Aδ-fiber free nerve endings whose inputs are conveyed by the spinothalamic tract, these responses could be used as a robust tool to test the function of the spinothalamic system in humans. However, future studies conducted in patients are required to investigate the diagnostic value of CEPs for detecting loss of small fibre or spinothalamic function.
Highlights.
Robust cool-evoked potentials can be recorded using rapid innocuous cooling of the skin.
Cool evoked potentials could be complementary to the recording of laser-evoked potentials.
Cool evoked potentials are a promising new method to assess the spinothalamic system.
Acknowledgements
EvdB and AM are supported by the ERC “Starting Grant” (PROBING PAIN 336130). RdK is supported by F.N.R.S.-PDR. AD is supported by CNRS and University of Strasbourg.
Footnotes
Conflict of Interest
None declared.
References
- Mackenzie RA, Burke D, Skuse NF, Lethlean AK. Fibre function and perception during cutaneous nerve block. J Neurol Neurosurg Psychiatry. 1975;38(9):865–73. doi: 10.1136/jnnp.38.9.865. [DOI] [PMC free article] [PubMed] [Google Scholar]
- van den Broeke EN, Lenoir C, Mouraux A. Secondary hyperalgesia is mediated by heat-insensitive A-fibre nociceptors. J Physiol. 2016;594(22):6767–6776. doi: 10.1113/JP272599. [DOI] [PMC free article] [PubMed] [Google Scholar]
- Di Stefano G, La Cesa S, Leone C, Pepe A, Galosi E, Fiorelli M, Valeriani M, Lacerenza M, Pergolini M, Biasiotta A, Cruccu G, et al. Diagnostic accuracy of laser-evoked potentials in diabetic neuropathy. Pain. 2017;158(6):1100–1107. doi: 10.1097/j.pain.0000000000000889. [DOI] [PubMed] [Google Scholar]
- Haanpää M, Attal N, Backonja M, Baron R, Bennett M, Bouhassira D, Cruccu G, Hansson P, Haythornthwaite JA, Iannetti GD, Jensen TS, et al. NeuPSIG guidelines on neuropathic pain assessment. Pain. 2011;152(1):14–27. doi: 10.1016/j.pain.2010.07.031. [DOI] [PubMed] [Google Scholar]
- Hüllemann P, Nerdal A, Binder A, Helfert S, Reimer M, Baron R. Cold-evoked potentials - Ready for clinical use? Eur J Pain. 2016;20(10):1730–1740. doi: 10.1002/ejp.896. [DOI] [PubMed] [Google Scholar]
- Duclaux R, Franzen O, Chatt AB, Kenshalo DR, Stowell H. Responses recorded from human scalp evoked by cutaneous thermal stimulation. Brain Res. 1974;78(2):279–90. doi: 10.1016/0006-8993(74)90552-6. [DOI] [PubMed] [Google Scholar]
- Hyvärinen A, Oja E. Independent component analysis: algorithms and applications. Neural Netw. 2000;13(4–5):411–30. doi: 10.1016/s0893-6080(00)00026-5. [DOI] [PubMed] [Google Scholar]
- Lenoir C, Huang G, Vandermeeren Y, Hatem SM, Mouraux A. Human primary somatosensory cortex is differentially involved in vibrotaction and nociception. J Neurophysiol. 2017;118(1):317–330. doi: 10.1152/jn.00615.2016. [DOI] [PMC free article] [PubMed] [Google Scholar]
- Valentini E, Hu L, Chakrabarti B, Hu Y, Aglioti SM, Iannetti GD. The primary somatosensory cortex largely contributes to the early part of the cortical response elicited by nociceptive stimuli. Neuroimage. 2012;59(2):1571–81. doi: 10.1016/j.neuroimage.2011.08.069. [DOI] [PubMed] [Google Scholar]
- Valeriani M, Restuccia D, Barba C, Le Pera D, Tonali P, Mauguière F. Sources of cortical responses to painful CO(2) laser skin stimulation of the hand and foot in the human brain. Clin Neurophysiol. 2000;111(6):1103–12. doi: 10.1016/s1388-2457(00)00273-x. [DOI] [PubMed] [Google Scholar]
- Perchet C, Godinho F, Mazza S, Frot M, Legrain V, Magnin M, Garcia-Larrea L. Evoked potentials to nociceptive stimuli delivered by CO2 or Nd:YAP lasers. Clin Neurophysiol. 2008;119(11):2615–22. doi: 10.1016/j.clinph.2008.06.021. [DOI] [PubMed] [Google Scholar]
- Loeser JD, Treede RD. The Kyoto protocol of IASP Basic Pain Terminology. Pain. 2008;137(3):473–7. doi: 10.1016/j.pain.2008.04.025. [DOI] [PubMed] [Google Scholar]
- Dubner R, Sumino R, Wood WI. A peripheral "cold" fiber population responsive to innocuous and noxious thermal stimuli applied to monkey's face. J Neurophysiol. 1975;38(6):1373–89. doi: 10.1152/jn.1975.38.6.1373. [DOI] [PubMed] [Google Scholar]
- Kenshalo DR, Duclaux R. Response characteristics of cutaneous cold receptors in the monkey. J Neurophysiol. 1977;40(2):319–32. doi: 10.1152/jn.1977.40.2.319. [DOI] [PubMed] [Google Scholar]
- Darian-Smith I, Johnson KO, Dykes R. "Cold" fiber population innervating palmar and digital skin of the monkey: responses to cooling pulses. J Neurophysiol. 1973;36(2):325–46. doi: 10.1152/jn.1973.36.2.325. [DOI] [PubMed] [Google Scholar]
- Milenkovic N, Zhao WJ, Walcher J, Albert T, Siemens J, Lewin GR, Poulet JF. A somatosensory circuit for cooling perception in mice. Nat Neurosci. 2014;17(11):1560–6. doi: 10.1038/nn.3828. [DOI] [PubMed] [Google Scholar]
- Grundmann L, Rolke R, Nitsche MA, Pavlakovic G, Happe S, Treede RD, Paulus W, Bachmann CG. Effects of transcranial direct current stimulation of the primary sensory cortex on somatosensory perception. Brain Stimul. 2011;4(4):253–60. doi: 10.1016/j.brs.2010.12.002. [DOI] [PubMed] [Google Scholar]
- Oliviero A, Esteban MR, de la Cruz FS, Cabredo LF, Di Lazzaro V. Short-lasting impairment of temperature perception by high frequency rTMS of the sensorimotor cortex. Clin Neurophysiol. 2005;116(5):1072–6. doi: 10.1016/j.clinph.2004.12.003. [DOI] [PubMed] [Google Scholar]
- Tiest WM. Tactual perception of material properties. Vision Res. 2010;50(24):2775–82. doi: 10.1016/j.visres.2010.10.005. [DOI] [PubMed] [Google Scholar]


