

Abstract
Gemfibrozil, a ligand of peroxisome proliferator-activated receptor α (PPARα), is one of the most widely prescribed anti-dyslipidemia fibrate drugs. Among the adverse reactions observed with gemfibrozil are alterations in liver function, cholestatic jaundice, and cholelithiasis. However, the mechanisms underlying these toxicities are poorly understood. In this study, wild-type and Ppara-null mice were dosed with a gemfibrozil-containing diet for 14 days. Ultra-performance chromatography electrospray ionization quadrupole time-of-flight mass spectrometry-based metabolomics and traditional approaches were used to assess the mechanism of gemfibrozil-induced hepatotoxicity. Unsupervised multivariate data analysis revealed four lysophosphatidylcholine components in wild-type mice that varied more dramatically than those in Ppara- null mice. Targeted metabolomics revealed taurocholic acid and tauro-α-muricholic acid/tauro-β-muricholic acid were significantly increased in wild-type mice, but not in Ppara-null mice. In addition to the above perturbations in metabolite homeostasis, phenotypic alterations in the liver were identified. Hepatic genes involved in metabolism and transportation of lysophosphatidylcholine and bile acid compounds were differentially regulated between wild-type and Ppara-null mice, in agreement with the observed downstream metabolic alterations. These data suggest that PPARa mediates gemfibrozil-induced hepatotoxicity in part by disrupting phospholipid and bile acid homeostasis.
Keywords: Metabolomics, PPARα, Gemfibrozil, Hepatotoxicity, Bile acid, Phospholipid
Introduction
Gemfibrozil is a fibrate drug and agonist of the nuclear receptor peroxisome proliferator-activated receptor α (PPARα). After heterodimerization with retinoic X receptor, PPARα binds to peroxisome proliferator response elements within target gene promoters and regulates genes involved in metabolism of lipids, glucose, and amino acids (Peters et al. 2005). Clinically, fibrates represent a class of drugs widely used for the treatment of hypertriglyceridemia and mixed hyperlipidemia often associated with atherosclerosis (Fievet and Staels 2009). Prolonged PPARα activation, as a result of chronic fibrate administration, causes hepatocellular carcinoma in rats and mice (Peters et al. 2005; Cunningham et al. 2010). Among the fibrates, gemfibrozil is associated with the highest risk of myotoxicity, in monotherapy or combination with statins (Holoshitz et al. 2008; Liu et al. 2009). In the clinic, gemfibrozil also increases risk of cholestatic jaundice and cholelithiasis (Sabordo and Sallustio 1997; Roglans et al. 2004). It is contraindicated in patients with a history of gallbladder disease. These later adverse reactions and warnings are documented in most manufactures’ package inserts. However, the underlying mechanisms driving hepatotoxicity have not been fully studied.
Pharmacodynamically, fibrates decrease triglyceride (TG), and very-low-density lipoprotein (VLDL) while increasing high-density lipoprotein (HDL). In the Fischer-344 rat model, the PPARα activators clofibrate, Wy-14,643 and three other fibrates were shown to increase phospholipids by 25–57 %. Most of these compounds increased the total lipid content by 26–156 % (Sausen et al.1995). A study in rainbow trout showed that gemfibrozil treatment decreased plasma lipoprotein levels by 29 %, but the corresponding increase in HDL cholesterol documented in humans was not observed (Prindiville et al. 2011). Although the relative abundance of phospholipids did not change, their concentrations were decreased by gemfibrozil treatment. The expression of lipoprotein lipase increased, but no target genes were analyzed to demonstrate the role of PPARα. In a study testing the relationship between biliary phospholipid output and the phospholipid transporter ABCB4 in mice, a gemfibrozil-containing diet (0.5 %) did not affect phospholipid output in bile or significantly alter Abcb4 mRNA expression; this was the weakest response noted among the five fibrates examined (chianale et al. 1996). However, details of systemic phospholipids affected by gemfibrozil treatment and the underlying mechanism have not been reported.
Serum phospholipids were recently revealed as biomarkers in several liver disease models, and alterations in phospholipid levels are often accompanied by disturbances in bile acid (BA) homeostasis. In a nonalcoholic steatohepatitis (NAsH) model induced by a methionine- and choline-deficient diet (McDD), disruption of phospholipid and bile acid (BA) homeostasis was reported (Tanaka et al. 2012). A decrease in seven lysophosphatidylcholine (LPC) components and an increase in three BA components were identified as serum biomarkers in the McDD NAsH model. In mice, McDD induces progressive nonalcoholic fatty liver disease with the potential for developing into cirrhosis and hepatocellular carcinoma. Another report revealed serum LPCs as biomarkers for biliary injury in a cholestasis model induced by lithocholic acid (Matsubara et al. 2011). In an acute colitis model induced by dextran sulfate sodium, biphasic regulation of specific LPC components led to the identification of hepatic stearoyl-CoA desaturase 1 inhibition, which correlated with an increase in proinflammatory cytokines (Chen et al. 2008). Four LPC components were also found to be potential biomarkers in patients with chronic hepatitis B and acutely compromised liver function (Yang et al. 2006). Nevertheless, alterations in LPC levels have not been studied following gemfibrozil administration, which is known to influence phospholipid metabolism as well as induce cholestatic jaundice and cholelithiasis in the clinic.
Extensive efforts have been taken to understand the role of PPARα in BA homeostasis, but the results are contradictory. In rat hepatocytes, gemfibrozil and clofibric acid were found to inhibit taurocholate uptake, but they do not appear to directly alter the hepatic uptake of taurocholate because the Ki values were much higher than their clinical concentrations (Sabordo and Sallustio 1997). Sterol 12α-hydroxylase, a branch-point enzyme in the bile acid biosynthetic pathway, was reported to be upregulated in wild-type mice after Wy-14,643 treatment, as well as fasting conditions, which was diminished in Ppara-null mice (Hunt et al. 2000). Ciprofibrate could decrease expression of BA synthesis genes Cyp7a1 and cholesterol 27α-hydroxylase (Cyp27a1) in wild-type mice but not in Ppara-null mice (Post et al. 2001). In another study, Wy-14,643 was found to stimulate both human CYP7A1 and mouse Cyp7a1 promoters. However, the PPARα agonist bezafibrate was reported to decrease liver BA and Cyp7a1 gene expression in both wild-type and Ppara-null mice (Roglans et al. 2004). A recent study showed that PPARα greatly attenuates BA homeostasis induced by cholic acid challenge using a transgenic mouse model (Li et al. 2012). For gemfibrozil, no studies to date has investigated its effect on BA homeostasis and the relationship with PPARα activation.
In this study, wild-type and Ppara-null mice were treated with gemfibrozil diet for 14 days. Serum samples were collected and subjected to metabolomic study with unsupervised multivariate data analysis (MDA) revealing four LPC components and two BA compounds that varied in a PPARα-dependent manner. Transcription of hepatic genes involved in the metabolism and/or transportation of LPCs and BAs was found differentially regulated between wild-type and Ppara-null mice. The changes in gene expression provide mechanistic evidence that supports the observed downstream metabolic alterations and phenotypic hepatotoxicity observed in wild-type mice. These data suggest PPARα plays an important role in disturbance of phospholipid and BA homeostasis after gemfibrozil treatment, which may be of direct relevance to patients experiencing hepatotoxicity after taking this medication.
Materials and methods
Chemicals and reagents
Gemfibrozil, taurocholic acid (TCA), tauro-α-muricholic acid (TαMCA), tauro-β-muricholic acid (TβMCA), and chlorpropamide were purchased from Sigma (St. Louis, MO). TCA-d5 sodium was provided by Unites States Biological Corp. (Salem, MA). Alanine aminotransferase (ALT, LOT: LB261301301, C164–0A), aspartate aminotransferase (AST, LOT: LI291101, C154–0B), and alkaline phosphatase (ALP, LOT: LF050801E, C174–0C) assay kits were purchased from Catachem (Bridgeport, CT). Colorimetric triglyceride (TG, LOT: DE976, 461–08992) and total bile acid (TBA, LOT: KM996, 990–23491) kits were from Wako Chemicals (Richmond, VA). Standard authentic compounds 1-palmitoyl-sn-glycero-3-phosphocholine (LPC 16:0), 1-stearoyl-sn-glycero-3-phosphocholine (LPC18:0), 1-ole- oyl-2-hydroxy-sn-glycero-3-phosphocholine (LPC18:1, 9Z) were obtained from Avanti Polar Lipids, Inc. (Alabaster, AL). Organic reagents acetonitrile and formic acid were of the highest obtainable grade commercially available.
Animals and treatment
Wild-type and Ppara-null mice on the 129/Sv background, described previously (Lee et al. 1995; Yang et al. 2008), were maintained under a standard 12-h light/12-h dark cycle with free access to water and a normal diet. All procedures were performed in accordance with Institute of Laboratory Animal Resource Guidelines under protocols approved by the National Cancer Institute Animal Care and Use Committee. Male 5- to 7-week-old mice were acclimated to a commercial purified diet (AIN-93G, Bio-Serv, NJ) for 7 days before the experiment. Wild-type mice (n = 5 in each group) were fed with low, medium, and high gemfibrozil diet (AIN-93G supplemented with 0.375, 0.75, and 1.5 % gemfibrozil, respectively) for 14 days. Based on the toxic response observed in wild-type mice, Ppara-null mice were fed with the medium gemfibrozil diet only. Control groups of both mouse lines were treated with control diet (AIN-93G).
Mice were placed into individual metabowls (Jencons, Leighton Buzzard, UK) with free access to water and appropriate diets. Food intake over 24 h was measured from each mouse on day 1, 3, 5, 10, and 14 during treatment. Blood samples were collected in BD microtainer serum separator tubes (Franklin Lakes, NJ) by retroorbital bleeding on day 0, 7 and 14, and then stored at −80 °C waiting for analysis. After a 14-day treatment, the mice were weighed and killed after blood collection. Liver tissues were harvested and weighed to calculate liver/body weight ratio. A section of freshly isolated liver tissues was excised and immediately fixed in 10 % neutral buffered formalin after a brief wash with phosphate-buffered saline. The remaining liver tissues were flash-frozen in liquid nitrogen then stored at −80 °C until further analysis.
Biochemical and pathological analysis
Serum ALT and AST levels were measured, and hepatic ALP, TG, and TBA levels were quantified. All assays were performed using the commercial kits using the manufactures protocols. Fixed liver tissues were subjected to dehydration in serial concentrations of alcohol and xylene followed by paraffin embedding. Four-micrometer serial sections were cut and stained with hematoxylin and eosin. Histopathological examination was performed using an Olympus BX41 light microscope.
UPLC-ESI-QTOFMS analysis and multivariate data analysis
Serum samples of 10 μL were diluted using 190 μL 66.7 % aqueous acetonitrile in which chlorpropamide (5 μM) was added as the internal standard. Samples were vortexed for 30 s and then centrifuged at 18,000 rcf for 20 min at 4 °C to remove particles and precipitate proteins. The supernatant was transferred to an autosampler plate for analysis. An aliquot of 5 μL supernatant was injected into the ultra-performance liquid chromatography coupled quadrupole time-of-flight mass spectroscopy (UPLC-ESI-QTOFMS, ACQUITY UPLC®, Waters). Nitrogen was used as cone gas (50 L/h) and desolvation gas (600 L/h). Source temperature and desolvation temperature were set at 120 and 350 °C, respectively. The capillary voltage and cone voltage was 3,000 and 20 V, respectively. Injection was performed in a randomized order to avoid complications caused by artifacts related with injection order and occasional changes in instrumental efficiency. The liquid chromatography system consisted of a reverse-phase 2.1 × 50 mm ACQUITY UPLC® BEH C18 1.7 μm column (Waters Corp., Milford, MA) with a gradient mobile phase composed by 0.1 % formic acid solution (A) and acetonitrile containing 0.1 % formic acid solution (B). The gradient kept at 100 % A for 0.5 min, increased to 100 % B over the next 7.5 min, and then returned to 100 % A in last 2 min.
Data were collected in both positive and negative modes on a Waters QTOF, operated in full-scan mode at m/z 50–850. Raw data from UPLC-ESI-QTOFMS system were processed using MarkerLynx software (Waters) to generate a data matrix consisting of peak areas corresponding to a unique m/z and retention time (RT) without normalization. The generated multivariate data matrix was imported into SIMCA-P13.0 (Umetrics, Kinnelon, NJ) for score plot by principal component analysis (PCA). Loading scatter S-plot was produced by supervised orthogonal projection to latent structures discriminant analysis (OPLS-DA). The contribution list of metabolites was produced by criteria of p value above 0.05 and P(corr) value above 0.6. The contributory list was further investigated to undermine the candidate biomarkers in gemfibrozil-fed wild-type and Ppara-null mice compared with their control groups.
Metabolite identification and quantification
To identify the metabolites with high contribution score, metabolomics databases (Madison Metabolomics Consortium Database and METLIN) were searched to find potential candidates. For LPC 18:1, LPC 16:0, and LPC 18:0, authentic standards from Avanti Polar Lipids, Inc. at 5–20 μM dissolved in 50 % acetonitrile were used for comparison with the serum sample on the condition of MS/ MS fragmentation with collision energy of 35 V. TCA and TαMCA/TβMCA were measured in liver tissues and serum using the negative data matrix mentioned above. Their identities were confirmed by the same fragmentation profiles and retention times with authentic standards. For LPC 22:6, it was putatively identified based on the fragmentation pattern and retention time in comparison with historical data in the NCI Laboratory of Metabolism.
The level of the above LPC metabolites in serum was measured using a Waters ACQUITY UPLC system coupled with a XEVO triple-quadrupole tandem mass spectrometer. The detection and quantification were accomplished in multiple reaction monitoring (MRM) mode. The following MRM transitions in ESI+ were monitored for each metabolite: LPC 18:1 (522.5 ⟶ 184.1), LPC 16:0 (496.4 ⟶ 104.0), LPC 22:6 (568.3 ⟶ 104.1), and LPC 18:0 (524.5 ⟶ 104.0). Chlorpropamide (0.5 μM, 277 ⟶ 111) was used as internal standard for quantification of LPCs. TCA (514.28, ESI−, RT 3.38) and TαMCA/TβMCA (514.28, ESI−, RT 3.37) were quantified using an Acquity®UPLC H-class coupled to a XEVO®G2 QTOFMS with Quantof™ technology (Waters Corp, Milford, MA) using taurocholic acid-d5 sodium as internal standard (519.3, ESI−, RT 3.38). In the quantification mentioned above, all the calibration curves constructed by authentic standards had the r2 values above 0.99.
Quantitative polymerase chain reaction (qPCR) analysis
Total mRNA was extracted from approximately 20 mg of frozen liver tissues using TRIzol reagent (Invitrogen, Carlsbad, CA). cDNA was generated from 1 μg of total RNA with a SuperScript II Reverse Transcriptase kit and random oligonucleotides (Invitrogen). All the qPCR primer sequences used in this study were designed using qPrimerDepot and have been previously reported (Li et al. 2012; Tanaka et al. 2012; Fang et al. 2013). qPCRs contained 25 ng cDNA, 150 nM of each primer, and 5 μL of SYBR Green PCR Master Mix (Applied Biosystems, Foster City, CA) in a total volume of 10 μL. qPCR was carried out on an ABI-Prism 7900HT Sequence Detection System (Applied Biosystems, Foster City, CA). Measured mRNA abundance was normalized to those of 18S rRNA and expressed as fold change relative to those in wild-type mice fed with a control diet.
Statistical analysis
All the experimental values were expressed as mean ± SD. Statistical analysis was performed using GraphPad Prism 5 (GraphPad Software Inc., San Diego, CA). One-way ANOVA followed by Fisher’s least significant difference (LSD) post hoc tests was used for multiple comparisons of data from wild-type mice and those time-related alterations. The results from Ppara-null mice and the liver/body weight ratio between wild-type mice and Ppara-null mice were analyzed using two-tailed Student’s t test. The results following treatment in both wild-type and Ppara-null mice were compared with their baseline levels or those in their control groups, respectively. 95 % was set as confidence intervals, and difference was considered significant when the p values were less than 0.05 (p < 0.05).
Results
Phenotype of gemfibrozil-treated wild-type and Ppara-null mice
Wild-type mice fed the low (0.375 %) and medium (0.75 %) gemfibrozil diet showed no significant differences in body weight (Fig. 1a). A similar result was found with Ppara-null mice fed a control diet and medium dose gemfibrozil diet (data not shown). However, wild-type mice treated with the high dose (1.5 %) gemfibrozil diet lost significant body mass since day 3 (Fig. 1a). Gemfibrozil consumption was calculated from diet intake measurements taken over the course of the 14-day study (Fig. 1b). Gemfibrozil consumption in mice dosed with medium gemfibrozil diet was similar between WT and Ppara-null mice (Fig. 1b). However, wild-type mice fed the high gemfibrozil diet consumed less, possibly contributing to decreased body mass (Fig. 1a).
Fig. 1.
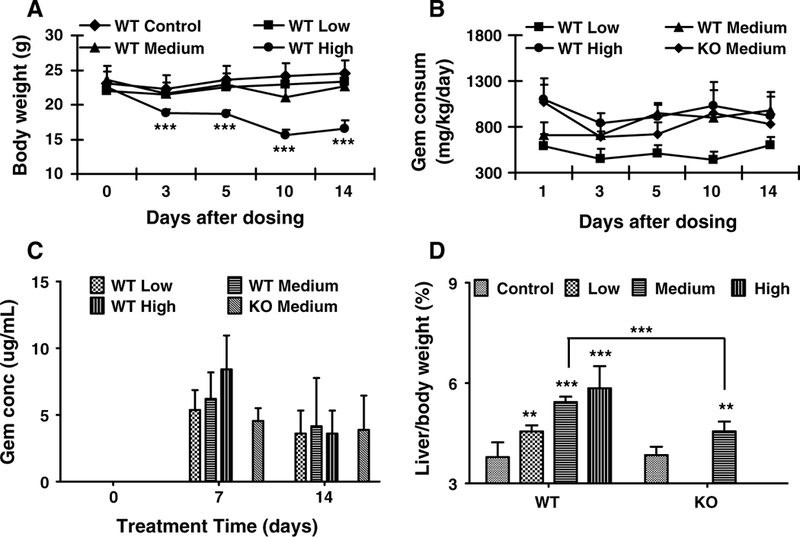
Phenotype of wild-type (WT) and Ppara-null (KO) mice dosed with gemfibrozil for 14 days. a Body weight of WT mice treated with three dosages of gemfibrozil. b Calculated gemfibrozil consumption by WT and KO mice over course of study. c Serum gemfibrozil concentration monitored on days 0, 7, and 14 in WT and KO mice dosed with gemfibrozil diet. d Liver/body weight ratios of WT and KO mice dosed with gemfibrozil. The data are expressed as mean ± SD (n = 5). The *, **, and *** indicatep < 0.05, p < 0.01, and p < 0.001, respectively, compared with control or between indicated groups
Gemfibrozil concentrations were quantified in serum samples collected on days 0, 7, and 14. The concentrations increased slightly in a dose-dependent manner in the three groups dosed with low, medium and high gemfibrozil diet (Fig. 1c), and serum levels were comparable between wildtype and Ppara-null mice. On average, gemfibrozil levels in the blood were lower in all groups on day 14 compared with those on day 7. The observed decrease in serum gemfibrozil concentrations may be the result of cytochrome P450 upregulation, which was reported previously (Liu et al. 2011b). The serum concentrations for both days 7 and 14 fell within reported clinical range (Kyrklund et al. 2003; Schneck et al. 2004). Furthermore, systemic gemfibrozil exposure by diet gave more consistent serum levels than oral gavage. This can be of relevance to the clinically adverse reactions to gemfibrozil.
The liver/body weight ratios increased significantly in the three groups dosed with low, medium, and high gemfibrozil when compared with controls. PPARα activation is known to play a critical role in hepatomegaly. In agreement, the liver/body weight ratio in Ppara-null mice treated with medium gemfibrozil diet increased by 18 %. The degree of hepatomegaly in Ppara-null mice was less than half that observed in wild-type mice, which saw a 43 % increase, and suggests a PPARα-independent mechanism may be associated with gemfibrozil-induced liver enlargement.
Hepatotoxic reactions in gemfibrozil-treated wild-type mice
The TBA levels in the three wild-type groups dosed with low, medium, and high gemfibrozil diet all increased significantly compared with the control group. ALP, a biochemical marker of bile duct and hepatocyte toxicity, increased in concert with TBA (Fig. 2a, c); these changes were not observed in Ppara-null mice treated with medium gemfibrozil diet (Fig. 2b, d). ALT and AST levels were determine to monitor hepatocyte toxicity. ALT in the high gemfibrozil group increased slightly when compared with controls, but levels of ALT or AST did not change significantly for Ppara-null or wild-type mice in the other treatment groups (Supplementary Fig. S1a, S1b, S1c, S1d).
Fig. 2.
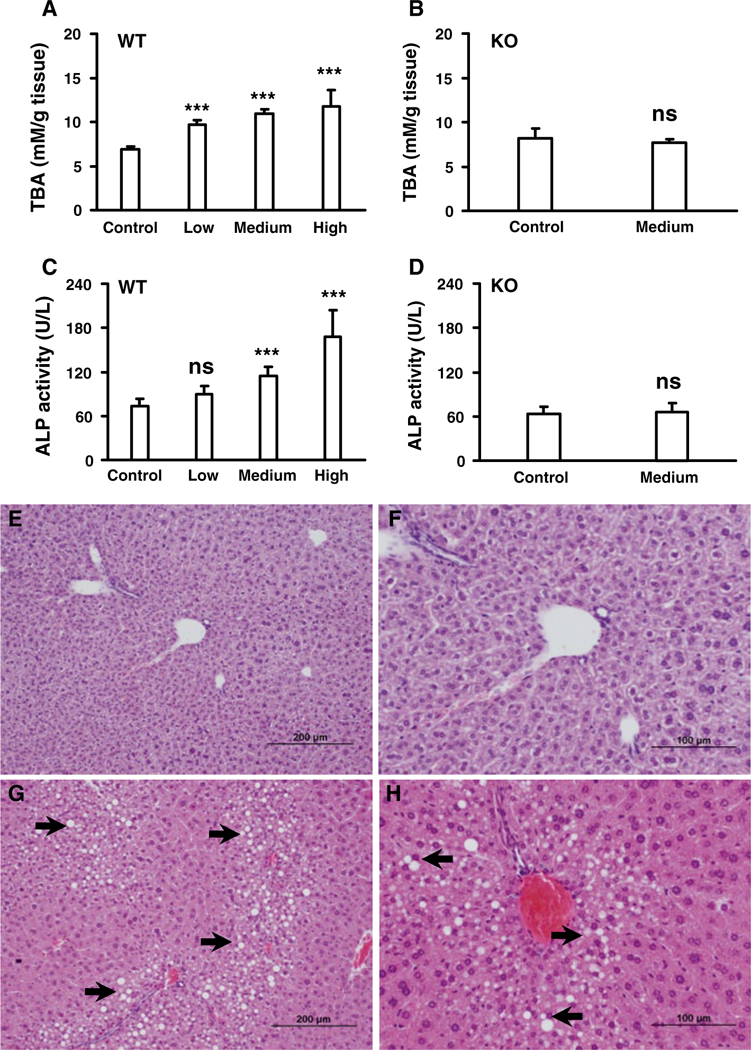
Analysis total bile acids (TBA) and toxicological responses in livers of wild-type (WT) and Ppara-null (KO) mice treated with gemfibrozil diet for 14 days. a Dose- dependent response of total bile acid levels in liver tissues from WT mice. b TBA level in liver tissues from KO mice. c Dose-dependent response of alkaline phosphatase (ALP) in liver tissues from WT mice. d Response of ALP in liver tissues from KO mice. e, f Representative pictures of liver tissues from WT control group. g, h Representative pictures of slight-to- moderate fatty liver in WT mice treated with low gemfibrozil diet. The data were expressed as mean ± SD (n = 5). The *, ** and, *** indicatep < 0.05, p < 0.01, and p < 0.001, respectively, compared with control or between indicated groups
Histological analysis revealed slight-to-moderate fatty liver in the wild-type mice treated with gemfibrozil (Fig. 2e-h), which was absent in the control group. The observed steatosis could be the result of altered LPC and TG metabolism in liver (Supplementary Fig. S1e). In contrast, altered TG metabolism was not found in Ppara-null mice (Supplementary Fig. S1f), and the degree of fatty liver was similar between the treated and control Ppara-null groups (data not shown). No other evident pathological changes were observed under histological analysis of livers in either wild-type or Ppara-null livers. Gemfibrozil-induced hepatotoxicity and the associated alterations in BA and fatty acid metabolism were observed only in wild-type and not in Ppara-null mice, thus indicating that PPARα plays an important role in hepatotoxicity caused by gemfibrozil.
Multivariate data analysis and metabolite identification
To gain a better understanding of role of PPARα in liver toxicity, metabolomic analysis was used to profile the metabolites in the serum from wild-type and in Ppara-null mice. Unsupervised PCA was used to analyze the data sets from both control and gemfibrozil-treated groups in wild-type and Ppara-null mice. As expected, PCA modeling of wild-type mouse serum showed that baseline and control samples grouped together. Samples from low, medium, and high gemfibrozil diet-treated wild-type mice on day 14 clustered away from the baseline and control samples, indicating significant metabolic changes within these groups (Fig. 3a). Notably, they varied along the first component in the scores plot, especially for the high gemfibrozil diet group. These observations suggested that some metabolites were significantly modified by gemfibrozil treatment in wild-type mice. In contrast, Ppara-null baseline and control samples grouped together with those of mice treated with medium dose gemfibrozil diet for 14 days (Fig. 3b), suggesting similar metabolic disturbances were not present in gemfibrozil-treated Ppara-null mice.
Fig. 3.
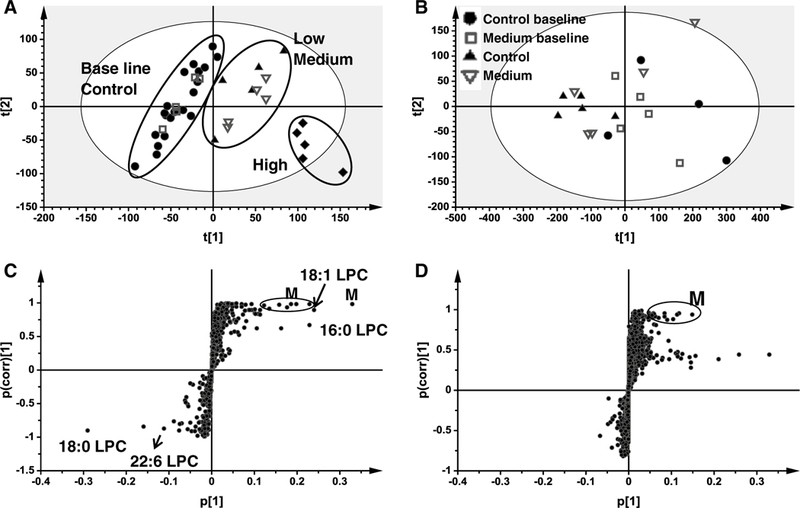
Multivariate data analysis of serum metabolome in positive mode in wild-type (WT) and Ppara-null (KO) mice dosed with gemfibrozil diet for 14 days. a Scores plot of serum metabolome in WT mice treated with three dosages of gemfibrozil diet as determined by PCA. b Scores plot of serum metabolome in KO mice dosed with medium gemfibrozil diet as determined by PCA. c S scatter plot of OPLS-DA recognized serum metabolome in control and treated WT mice, in which identified LPCs and supposed metabolites (M) were indicated. d S scatter plot of OPLS-DA recognized serum metabolome in control and KO mice treated medium gemfibrozil diet, in which supposed metabolites (M) were indicated. Each point represents an individual mouse serum sample (a, b) and a unique serum ion (c, d). Serum metabolites are labeled in the scatter plots. The t[1] and t[2] represent principal components 1 and 2, respectively. The p(corr)[1] represents the interclass difference, and p[1] represents the relative abundance of the ions. Raw data were obtained in positive mode (ESI+), ns means no significance when compared with control or between indicated groups
After pattern recognition of serum samples from wild-type and Ppara-null mice in the control and gemfibrozil-treated groups, OPLS-DA was used to produce loading scatter S-plots (Fig. 3c, d). Each point represents an ion contributing to sample separation between groups. Ions that significantly contributed to separation between gemfibrozil-fed wild-type mice and the control group increased in the first quadrant and decreased in the third quadrant (Fig. 3c). These ions are listed in Table 1 according to their correlation and abundance rank after primary screening. Compared with the distribution in wild-type mice, there were significantly fewer ions that increased or decreased in Ppara-null mice after gemfibrozil loading (Fig. 3d). Gemfibrozil metabolites were excluded, and the MS values that were thought to be endogenous metabolites were used for mass-based searches in the metabolomics databases Madison Metabolomics consortium Database (http://mmcd.nmrfam.wisc.edu/) and METLIN (http://metlin.scripps.edu/index.php).
Table 1.
Serum metabolite ions identified in positive mode that were significantly altered in wild-type mice treated with gemfibrozil diet for 14 days
| p(corr)[1] rank | p[1] rank |
RT (min) | m/z Found |
Putative ion form |
Elemental composition |
Mass error (ppm) |
Supposed identity |
|---|---|---|---|---|---|---|---|
| Increased ions | |||||||
| 19 | 2 | 4.9116 | 522.352 | [M + H] | C26H53NO7P | 6.5 | Oleoyl LPC (LPC 18:1) |
| 28 | 3 | 4.7627 | 496.336 | [M + H] | C24H5lNO7P | 7.6 | Palmitoyl LPC (LPC 16:0) |
| Decreased ions | |||||||
| 2 | 1 | 5.3932 | 524.367 | [M + H] | C26H55NO7P | 7.8 | Stearoyl LPC (LPC 18:0) |
| 3 | 3 | 4.5242 | 568.335 | [M + H] | C30H51NO7P | 8.4 | Decosahexanol PLC (LPC 22:6) |
Wild-type, RT retention time, NI not identified, LPC lysophosphatidylcholine
p(corr)[1] represents the interclass difference, p[1] represents the relative abundance of the ions
Metabolites that had characteristics and accurate masses matching LPC 18:1, LPC 16:0, and LPC 18:0 were reanalyzed and compared with authentic standards using UPLC-ESI-QTOFMS system. Compound identities were confirmed by comparing retention times and fragmentation profiles of serum metabolites with authentic standards. Identification of LPC 16:0 is exemplified in Fig. 4, and those of LPC 18:1 and LPC 18:0 are shown in Supplementary Figure S2 and Figure S3, respectively. For LPC 22:6, it was putatively identified was based on the observed retention time, fragmentation pattern (Supplementary Fig. S3e, S3f), and historical data (Matsubara et al. 2011; Tanaka et al. 2012).
Fig. 4.
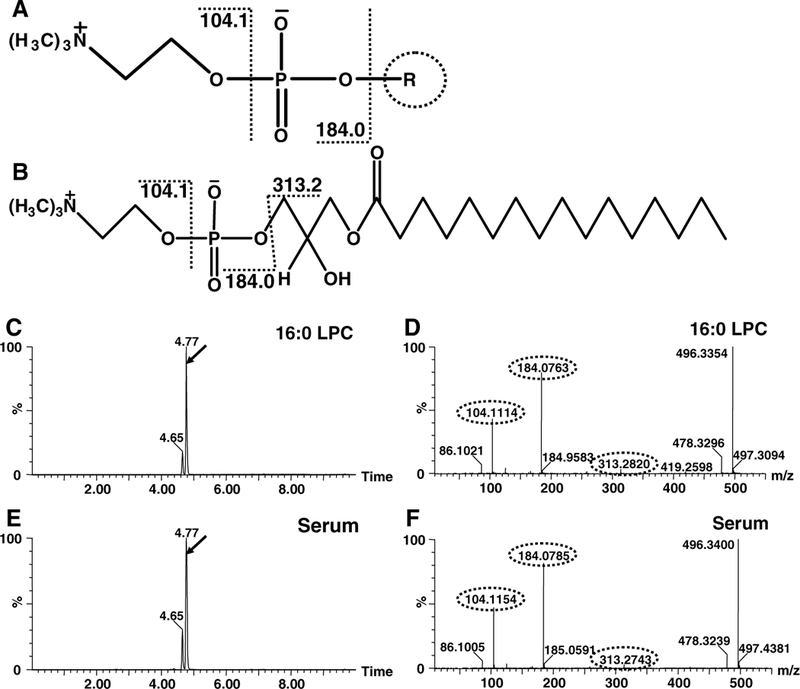
Exemplified identification of LPC 16:0 by fragmentation profiles and retention times on UPLC-ESI-QTOFMS. a common chemical scaffold of LPCs and supposed fragmentation pattern. b Chemical structure of identified LPC16:0 and supposed fragmentation. c Total ion count (TIC) chromatogram of standard LPC 16:0 when fragmentation performed. d MS/MS spectra of the peak with RT 4.77 in panel c. e TIC chromatogram of MS 496 of WT mouse serum sample when fragmentation performed. f MS/ MS spectra of the peak of WT mouse serum sample with RT 4.77 in panel e
TCA, and TaMCA/TßMCA could not be identified by unsupervised MDA in negative mode because of their low responses in the detection system and low p values (Supplementary Fig. S4). Attention was given to these metabolites because total bile acids in the liver increased in wild-type mice but not in Ppara-null mice. Thus, MS values of known BA metabolites were targeted in the negative data matrix mentioned above. The identities of TCA and TαMCA/TβMCA were confirmed by the same fragmentation profiles and retention times between authentic compounds and variation in serum samples (Supplementary Fig. S5 and Supplementary Fig. S6). Changes in TCA, and TαMCA/TβMCA were determined using an XEVO triple-quadrupole tandem mass spectrometer mentioned above.
Disrupted phospholipid and BA homeostasis in wild-type mice
Following identification, LPC 18:1, LPC 16:0, LPC 18:0, and LPC 22:6 concentrations were quantified using an ACQUITY UPLC system coupled with a XEVO triple-quadrupole tandem mass spectrometer. Both LPC 16:0 and LPC 18:1 in wild-type and Ppara-null mice are plotted in Fig. 5a-d on day 7, and levels remained similar until day 14 when the mice were killed. LPC 16:0 in Ppara-null mice increases slightly on day 7 and then returned to control levels by day 14. There were no detected changes in LPC 18:1 in control or gemfibrozil-treated Ppara-null mice. LPC 18:0 and LPC 22:6 significantly decreased on day 7 in wild-type mice compared with their baseline levels, and remained lower through day 14 (Fig. 5e-h). LPC 18:0 and LPC 22:6 levels remained relatively constant during the course of gemfibrozil treatment in Ppara-null mice. No significant differences were noted between the low, medium, and high dosed groups with gemfibrozil. Although the p values compared with baseline in some of the wild-type data among three treatment groups appeared different, they seemed reasonable if a high deviation was considered. Moreover, the serum gemfibrozil concentrations in three groups were similar among the three groups. Based on the above data, it appears as though changes in LPC concentrations as a result of gemfibrozil treatment are mediated by PPARα.
Fig. 5.
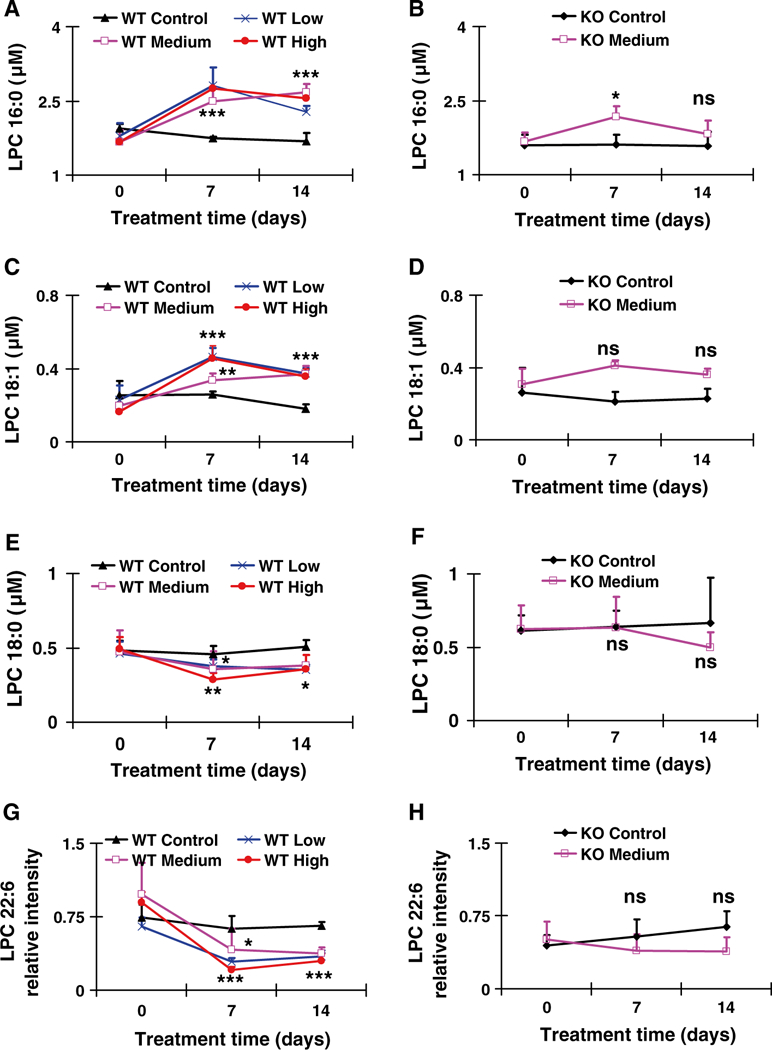
Concentration-time profiles or relative abundance of identified LPCs that were increased or decreased after treatment with gemfibrozil diet for 14 days. a, b Concentration-time profile of LPC 16:0 in WT and KO mice, respectively. c, d Concentration-time profile of LPC 18:1 in WT and KO mice, respectively. e, f Concentration-time profile of LPC 18:0 in WT and KO mice, respectively. g, h Relative abundance-time profiles of putative LPC 22:6 in WT and KO mice, respectively. The data were expressed as mean ± SD (n = 5). The *, **, and *** indicate p < 0.05, p < 0.01, and p < 0.001, respectively, compared with control or between indicated groups. ns means no significance compared with control or between indicated groups
TCA, and TαMCA/TβMCA are among the most abundant endogenous BAs. The above-targeted metabolomic analysis identified significant changes in TCA, and TαMCA/TβMCA after gemfibrozil treatment in wild-type mice. By quantification, average concentrations of TCA, and TαMCA/TβMCA remained unchanged in the control groups for both wild-type and Ppara-null mice. Over the course of the study, TCA concentrations increased in wild-type mice as treatment continued, as measured on day 7 and day 14 (Fig. 6a). Similar increases were observed for TαMCA/TβMCA (Fig. 6b). The largest increase in TCA and TαMCA/TβMCA observed in wild-type mice on day 14 was approximately 13-and 8-fold higher, respectively. A dose-dependent increase was evident for both TCA, and TαMCA/TβMCA. In contrast, no time- or dose-dependent changes in TCA, and TαMCA/TβMCA were observed in Ppara-null mice during the treatment period (Fig. 6a, b).
Fig. 6.
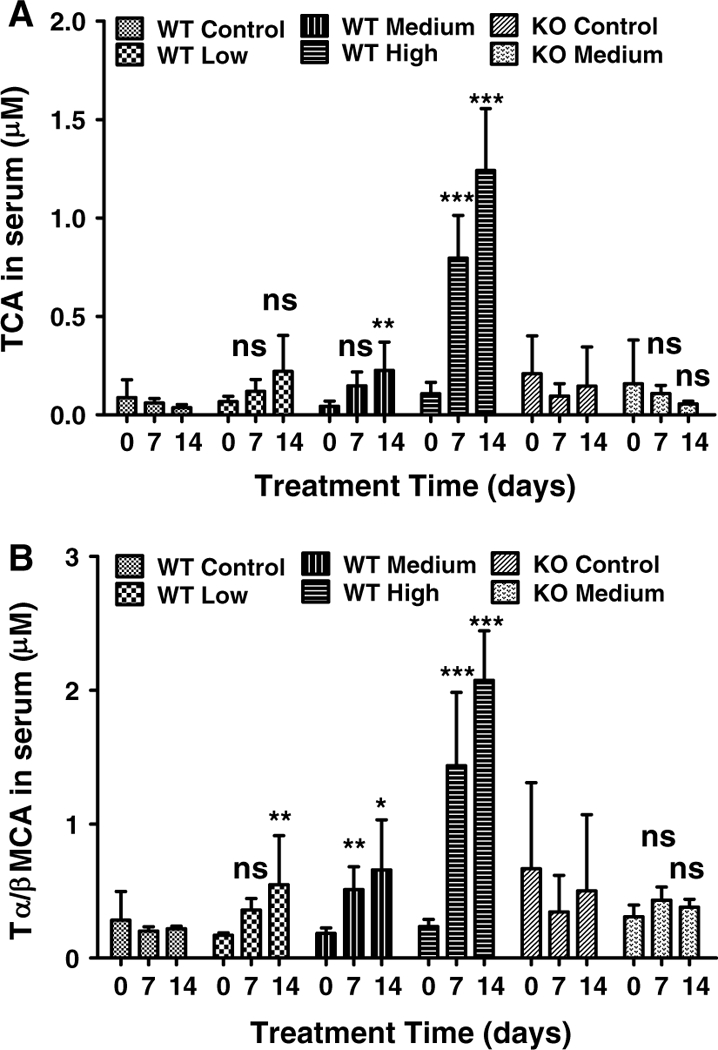
Concentration-time profiles of TCA and tauro-α-muricholic acid/tauro-β-muricholic acid in serum from wild-type (WT) and Ppara-null (KO) mice treated with gemfibrozil diet for 14 days. a TCA concentration-time profile in WT and KO mice on day 0, 7 and 14. b tauro-α-muricholic acid/tauro-β-muricholic acid concentration-time profile in WT and KO mice on day 0, 7 and 14. The data were expressed as mean ± SD (n = 5). The *, **, and *** indicate p < 0.05, p < 0.01 and p < 0.001, respectively, compared with control or between indicated groups. ns means no significance compared with control or between indicated groups
Thus, disruptions in BA homeostasis caused by gemfibrozil treatment are PPARα dependent.
Disruption of LPC and BA metabolism and/or transporter genes
Changes in downstream metabolites are usually preceded by altered expression of upstream genes. Thus, the public Kyoto Encyclopedia of Genes and Genomes database was used to identify those genes involved in LPC and BA metabolism and/or transport, and qPCR was used to quantify mRNAs levels. Lysophosphatidylcholine acyltransferase 1–4 (Lpcat1–4), lysophospholipase A1 (Lypla1), and ectonucleotide pyrophosphatase/phosphodiesterase 2 (Enpp2) are involved in catabolism of LPC. Lecithin cholesterol acyltransferase (Lcat) facilitates the conversion of PC into LPC. The mRNAs for many genes involved in the catabolism and synthesis of LPC were upregulated in wild-type mice after 14-day gemfibrozil treatment (Fig. 7a). While Lcat was moderately upregulated in high gemfibrozil diet-treated mice, the CT values were significantly lower than those of Lpcat3, indicating significantly higher expression levels (data not shown) and stronger regulating role. Moreover, none of the genes in Ppara-null mice treated with medium gemfibrozil were significantly changed compared to controls (Fig. 7b). These results suggest that hepatic genes associated with LPC metabolism were modified, and this response is dependent on PPARα.
Fig. 7.
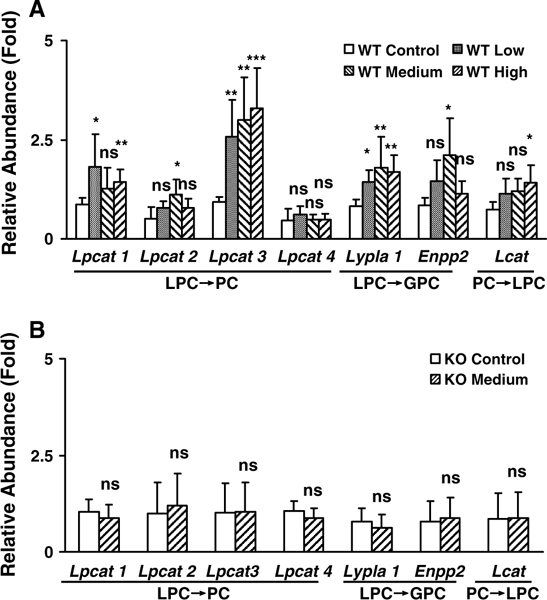
Differentially regulated expression of genes involved in LPCs metabolism in wild-type (WT) and Ppara-null (KO) mice dosed with gemfibrozil diet for 14 days. a Relative mRNA level of genes associated with LPC metabolism in WT mice. b Relative mRNA level from genes associated with LPCs metabolism in KO mice. The data were expressed as mean ± SD (n = 5). The *, **, and *** indicate p < 0.05, p < 0.01, and p < 0.001, respectively, compared with control or between indicated groups. ns means no significance compared with control or between indicated groups
BA levels in liver tissues are closely related with their synthesis, uptake, as well as the basolateral and canalicular transport. Messenger RNA levels for the genes encoding cholesterol 7α-hydroxylase (Cyp7a1) and 8β-hydroxylase (Cyp8b1) were upregulated in wild-type but not in Ppara- null mice; notably Cyp7a1 increased almost 10-fold. The expression of sterol 27-hydroxylase (Cyp27a1) was unchanged in either wild-type or Ppara-null mice (Fig. 8 a). Solute carrier organic anion transporter family member 1a1 (Slco1a1, also known as Oatp1) was downregulated in a dose-dependent manner in wild-type mice treated with gemfibrozil diet, while no decrease was found in Ppara-null mice. Slco1b2 (also known as Oatp2) levels were unchanged in both mouse lines (Fig. 8a).
Fig. 8.
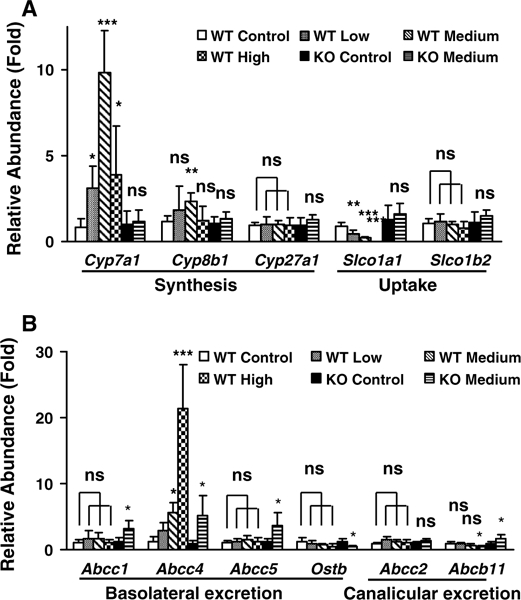
Differentially regulated expression of genes involved in bile acid (BA) metabolism in liver tissues of wild-type (WT) and Ppara-null (KO) mice dosed with gemfibrozil diet for 14 days. a Relative mRNA levels from genes associated with de novo synthesis and uptake of BA by hepatocytes. b Relative mRNA levels from genes associated with basolateral and canalicular excretion of BA by hepatocytes. The data were expressed as mean ± SD (n = 5). The *, **, and *** indicate p < 0.05, p < 0.01, and p < 0.001, respectively, compared with control or between indicated groups
The mRNAs derived from genes encoding basolateral BA transporters, such as ATP-binding cassette subfamily C member 1/5 (Abcc1/5), were upregulated after gemfibrozil treatment in Ppara-null mice, but not in wild-type mice. Abcc4 was sharply upregulated in high-gemfibrozil-diet-dosed wild-type mice. However, the increase was similar between wild-type and Ppara-null mice after medium gemfibrozil diet treatment, compared with their control groups. Organic solute transporter b (Ostb) was downregulated in Ppara-null mice compared to wild-type mice (Fig. 8a). Expression of the canalicular BA excretion transporters Abcc2 was not changed in either strain of mice. However, the ATP-binding cassette subfamily B member 11 (Abcb11) was downregulated in wild-type mice and upregulated in Ppara-null mice by gemfibrozil diet treatment (Fig. 8b). Differential regulation of genes mediating BA metabolism and/or transport provides mechanistic evidence for the observed changes in hepatic total bile acids, as well as altered serum TCA, and TαMCA/ TβMCA levels in wild-type mice treated with gemfibrozil.
Differential activation of PPARα target genes
Treatment of wild-type mice with different doses of gemfibrozil for 14 days sharply increased (up to 90-fold) the expression of mRNAs encoding acyl-CoA oxidase (Acox1), cytochrome P450 4a10 (Cyp4a10), enoyl-CoA hydratase/3-hydroxyacyl CoA dehydrogenase (Ehhadh), and acyl-CoA thioesterase 1 (Acotl) in a dose-dependent manner (Supplementary Fig. S7a). In addition, acyl-CoA dehydrogenase (Acadm), acyl-CoA dehydrogenase long chain (Acadl), and acetyl-CoA acyltransferase 1a (Acaala) were moderately (2–5-fold) upregulated (Supplementary Fig. S7b). In contrast, Ppara-null mice did not exhibit significant changes in expression of the aforementioned genes (Supplementary Fig. S7c). The variation in PPARa target genes between wild-type and Ppara-null mice following gemfibrozil challenge indicated differential downstream fatty acid metabolism. Most notably, modifications in long-chain fatty acid metabolism would contribute to the development of fatty liver, in addition to the observed phospholipids modifications that were shown to be PPARα dependent.
Discussion
Fibrates have been used clinically to treat hyperlipidemia for more than four decades. All fibrates are reported to cause myotoxicity, including gemfibrozil which is associated with the highest risk whether used alone or in combination with statins (Holoshitz et al. 2008). Abnormally regulated lipid metabolism, high systemic exposure, and differential PPARa abundance in skeletal muscle have been speculated as possible mechanisms (Marcoff and Thompson 2007). Recent studies found that gemfibrozil-induced disturbances in intracellular calcium concentrations and inhibition of myocyte differentiation might play an important role in myotoxicity (Liu et al. 2011a, 2012). However, the most common clinically observed toxic reactions with gemfibrozil were cholestatic jaundice and cholelithiasis, especially in patients with a history of gallbladder disease (Roglans et al. 2004; Hajdu et al. 2009). To date, the underlying mechanisms driving these toxicities remains poorly understood.
The most commonly used therapeutic gemfibrozil regimen is 600 mg, twice daily. The average trough concentration is 1.2–1.5 μg/ml, and the maximal concentration was 22–49 μg/ml (Kyrklund et al. 2003; Schneck et al. 2004). In this study, the calculated dosages in mice were 500–1,000 mg/kg/day, where the lowest dosage is within 3-fold of the therapeutic range. In Fischer-334 rats, treatment with a gemfibrozil diet (0.6–1.8 %) for 21 days led to a 2-fold increase in liver/body weight ratio with gemfibrozil concentrations between 18.4 and 21.2 μg/ml (Sausen et al. 1995). A study using Sprague-Dawley rats reported a 65 % increase in liver/body weight ratio by 1,320 mg/ kg/day (twice daily) for 14 days where the trough concentration was determined to be 2.9–10.9 μg/ml (Liu et al. 2011b). In this study, ‘low,’ ‘medium,’ and ‘high’ gemfibrozil doses (0.375, 0.75, and 1.5 %, respectively) were administered in pelleted diets for 14 days. Serum gemfibrozil concentrations were determined as 3.06–8.40 μg/ ml, which was within its therapeutic range in humans. The toxic responses observed in this study, including fatty liver, enhanced ALP and liver/body weight ratio occurred under this systemic exposure.
LPCs are the major phospholipids components in bile related with liver function. Clinically, dihydrosphingosine and phytosphingosine were found to be potential diagnostic biomarkers for hepatocellular carcinoma (Yin et al. 2009). Circulating LPCs were recently reported as clinical biomarkers for distinguishing benign from malignant nonalcoholic fatty liver (Lehmann et al. 2013). Disruption of LPC homeostasis was reported in cholestasis and NASH models (Li et al. 2012; Tanaka et al. 2012). Thus, LPC metabolism is integrally associated with a variety of liver diseases, including those exhibiting BA dysregulation and fatty liver. In this study, metabolomics and subsequent quantification indicated the disruption of phospholipid homeostasis following gemfibrozil treatment. The LPC modifications occurred 7 days after treatment and continued through the end of treatment. Similarly with the above previously published data, Lpcat3, Lyplal, and Enpp2 were upregulated in wild-type mice correlating with the biphasic response of the four LPC components (Figs. 5 and 7). More importantly, all these modifications occurred only in wild-type mice, not in Ppara-null mice treated with gemfibrozil.
Clinically, bile acids such as glycocholic acid, glycochenodeoxycholic acid, taurocholic acid, and taurochenodeoxycholic acid were reported as potential biomarkers related to liver cirrhosis (Yin et al. 2009), and disruption of serum BAs has been widely reported in a variety of liver disease models (Hirschfield et al. 2010; Matsubara et al. 2011; Wagner et al. 2011; Li et al. 2012; Tanaka et al. 2012). In this study, a significant dose- and time-dependent increase in TCA, and TαMCA/TβMCA was detected in serum of gemfibrozil-treated wild-type mice. Wy-14,643, a stronger and more specific PPARα agonist, was reported to increase the relative amount of cholic acid after 1-week treatment in mice, which was not found in Ppara-null mice (Hunt et al. 2000). The present results are in accordance with that of Wy-14,643, which supports a role for PPARa in disruption of BA homeostasis caused by gemfibrozil. Taurine-conjugated bile acids constitute about 18 % of TBA and 60 % of taurine-conjugated bile acids are TcA, and TαMCA/Tβ in mouse (Garcia-Canaveras et al. 2012). TCA, and TαMCA/Tβ represent the main conjugation pathway of bile acid in mouse. In the present study, TBA increased mildly compared with that of TCA, and TαMCA/Tβ, which is understandable given their relative abundances. The combination of TBA, ALP, TCA, and TαMCA/Tβ was strong evidence that indicated the occurrence of cholestasis. Considering the close relationship between phospholipids and BAs, and their association with liver diseases, disturbance of LPC and BA homeostasis were toxic responses of gemfibrozil challenge, which was dependent on PPARα.
PPARα regulates BA homeostasis via biosynthesis, transport, and secretion (Li et al. 2012). In the present study, Cyp7a1 mRNA increased approximately 10-fold in gemfibrozil-treated wild-type mice. However, another study found that wild-type and Ppara-null mice fed bezafibrate developed hepatic cholestasis, and the expression of Cyp7a1 was downregulated (Hays et al. 2005). Clinically, bezafibrate, fenofibrate, and gemfibrozil reduced CYP7A1 mRNA levels (Roglans et al. 2004). So the response of Cyp7a1 to PPARα activation seems contradictory. The underlying reasons could be explained by differences in hepatic PPARα expression levels between mice and humans (Mukherjee et al. 1994; Palmer et al. 1998) or by a variation in the sensitivity of murine Cyp7a1 promoter to PPARα activation (Cheema and Agellon 2000). The increase in Cyp7a1 mRNA in gemfibrozil-treated wild-type mice and elevated downstream BA metabolites in liver and serum were significantly diminished or absent in Ppara-null mice. Additionally, the bile acid transporter gene Slcolal involved in BA uptake into hepatocytes was strongly downregulated in a dose-dependent manner in wild-type mice, but remained unchanged in the absence of PPARα. The basolateral excretion genes Abccl and Abcc5 increased in Ppara-null mice but not in wild-type mice. Additionally, the canalicular excretion gene Abcbll increased in Ppara-null mice but decreased in wild-type mice. Upregulation of Cyp7a1 and Cyp8b1 would contribute significantly to elevated hepatic TBA and serum BAs observed in wild-type mice. Moreover, the regulation of transporter genes promoting increased BA excretion and decreased uptake would further impact hepatic and systemic alterations in TBA and BA levels.
Although biochemical, metabolic, gene expression, and pathology data support the conclusion that hepatotoxicity occurred after gemfibrozil treatment, an interesting observation could not be neglected. As shown in Fig. 7 and Supplementary Fig. S1, fatty liver and TG accumulation was observed. This seems paradoxical when the mice treated with PPARα agonist which increased TG catabolism. The mice in this study were challenged with toxicological dosages, not therapeutic dosage. It is complicated to explain the toxicological responses using pharmacodynamic actions under these conditions. Considering the close relationship between LPC, BA, and clinical diseases reported by different groups, it is not surprising that fatty liver is observed in this study.
Taken together, this study utilized spectrometry-based metabolomics in combination with traditional toxicological strategies to provide new mechanistic insights into the metabolic alterations contributing to gemfibrozil-induced hepatotoxicity. The disturbances in LPC and BA homeostasis were closely related and linked with one another. The mechanism of hepatotoxicity caused by gemfibrozil treatment is summarized in Fig. 9. These toxic alterations developed in a PPARα-dependent manner and occurred under therapeutically relevant gemfibrozil concentrations, which is of particular importance when considering the potential hepatotoxicity associated with clinically used PPARα- activating fibrate drugs.
Fig. 9.
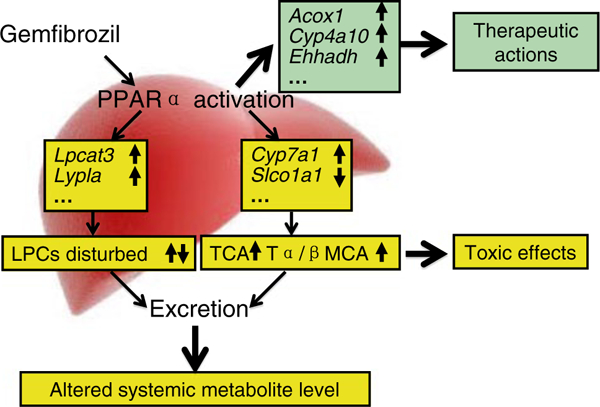
Proposed regulating role of PPARα in gemfibrozil-induced hepatotoxicity caused by gemfibrozil. Pharmacodynamic actions are determined by expression of the target genes involved in β-oxidation of long-chain fatty acids, producing therapeutic effects. Disruption of LPCs and bile acid metabolism and/or transport is regulated in a PPARα-dependent manner, leading to the downstream metabolite modifications
Supplementary Material
Acknowledgments
This work was supported by the Intramural Research Program of the Center for Cancer Research, National Cancer Institute, National Institutes of Health. It was in part supported by Ningbo Natural Science Foundation [Grant 2011A610059], Zhejiang Provincial Natural Science Foundation of China [Grant Y2110016], Zhejiang Provincial Education Department [Grant Y201329949], and National Natural Science Foundation of China [Grant 81273582, 81302848, and 81202586].
Footnotes
Electronic supplementary material The online version of this article (doi:10.1007/s00204-013-1188-0) contains supplementary material, which is available to authorized users.
Conflict of interest The authors declare no conflicts of interest.
References
- Cheema SK, Agellon LB (2000) The murine and human cholesterol 7alpha-hydroxylase gene promoters are differentially responsive to regulation by fatty acids mediated via peroxisome proliferator- activated receptor alpha. J Biol Chem 275:12530–12536 [DOI] [PubMed] [Google Scholar]
- Chen C, Shah YM, Morimura K, Krausz KW, Miyazaki M, Richardson TA, Morgan ET, Ntambi JM, Idle JR, Gonzalez FJ (2008) Metabolomics reveals that hepatic stearoyl-CoA desaturase 1 downregulation exacerbates inflammation and acute colitis. Cell Metab 7:135–147 [DOI] [PMC free article] [PubMed] [Google Scholar]
- Chianale J, Vollrath V, Wielandt AM, Amigo L, Rigotti A, Nervi F, Gonzalez S, Andrade L, Pizarro M, Accatino L (1996) Fibrates induce mdr2 gene expression and biliary phospholipid secretion in the mouse. Biochem J 314(Pt 3):781–786 [DOI] [PMC free article] [PubMed] [Google Scholar]
- Cunningham ML, Collins BJ, Hejtmancik MR, Herbert RA, Travlos GS, Vallant MK, Stout MD (2010) Effects of the PPARalpha agonist and widely used antihyperlipidemic drug gemfibrozil on hepatic toxicity and lipid metabolism. PPAR Res 2010:14. doi: 10.1155/2010/681963 [DOI] [PMC free article] [PubMed] [Google Scholar]
- Fang ZZ, Krausz KW, Tanaka N, Li F, Qu A, Idle JR, Gonzalez FJ (2013) Metabolomics reveals trichloroacetate as a major contributor to trichloroethylene-induced metabolic alterations in mouse urine and serum. Arch Toxicol 87:1975–1987 [DOI] [PMC free article] [PubMed] [Google Scholar]
- Fievet C, Staels B (2009) Combination therapy of statins and fibrates in the management of cardiovascular risk. Curr Opin Lipidol 20:505–511 [DOI] [PMC free article] [PubMed] [Google Scholar]
- Garcia-Canaveras JC, Donato MT, Castell JV, Lahoz A (2012) Targeted profiling of circulating and hepatic bile acids in human, mouse, and rat using a UPLC-MRM-MS-validated method. J Lipid Res 53:2231–2241 [DOI] [PMC free article] [PubMed] [Google Scholar]
- Hajdu D, Aiglova K, Vinklerova I, Urbanek K (2009) Acute cholestatic hepatitis induced by fenofibrate. J Clin Pharm Ther 34:599–602 [DOI] [PubMed] [Google Scholar]
- Hays T, Rusyn I, Burns AM, Kennett MJ, Ward JM, Gonzalez FJ, Peters JM (2005) Role of peroxisome proliferator-activated receptor-alpha (PPARalpha) in bezafibrate-induced hepatocar cinogenesis and cholestasis. Carcinogenesis 26:219–227 [DOI] [PubMed] [Google Scholar]
- Hirschfield GM, Heathcote EJ, Gershwin ME (2010) Pathogenesis of cholestatic liver disease and therapeutic approaches. Gastroenterology 139:1481–1496 [DOI] [PubMed] [Google Scholar]
- Holoshitz N, Alsheikh-Ali AA, Karas RH (2008) Relative safety of gemfibrozil and fenofibrate in the absence of concomitant cerivastatin use. Am J Cardiol 101:95–97 [DOI] [PubMed] [Google Scholar]
- Hunt MC, Yang YZ, Eggertsen G, Carneheim CM, Gafvels M, Einarsson C, Alexson SE (2000) The peroxisome proliferator-activated receptor alpha (PPARalpha) regulates bile acid biosynthesis. J Biol Chem 275:28947–28953 [DOI] [PubMed] [Google Scholar]
- Kyrklund C, Backman JT, Neuvonen M, Neuvonen PJ (2003) Gemfibrozil increases plasma pravastatin concentrations and reduces pravastatin renal clearance. Clin Pharmacol Ther 73:538–544 [DOI] [PubMed] [Google Scholar]
- Lee SS, Pineau T, Drago J, Lee EJ, Owens JW, Kroetz DL, Fernandez-Salguero PM, Westphal H, Gonzalez FJ (1995) Targeted disruption of the alpha isoform of the peroxisome proliferator-activated receptor gene in mice results in abolishment of the pleiotropic effects of peroxisome proliferators. Mol Cell Biol 15:3012–3022 [DOI] [PMC free article] [PubMed] [Google Scholar]
- Lehmann R, Franken H, Dammeier S, Rosenbaum L, Kantartzis K, Peter A, Zell A, Adam P, Li J, Xu G, Konigsrainer A, Machann J, Schick F, Hrabe de Angelis M, Schwab M, Staiger H, Schleicher E, Gastaldelli A, Fritsche A, Haring HU, Stefan N (2013) Circulating lysophosphatidylcholines are markers of a metabolically benign nonalcoholic Fatty liver. Diabetes Care 36:2331–2338 [DOI] [PMC free article] [PubMed] [Google Scholar]
- Li F, Patterson AD, Krausz KW, Tanaka N, Gonzalez FJ (2012) Metabolomics reveals an essential role for peroxisome proliferator-activated receptor alpha in bile acid homeostasis. J Lipid Res 53:1625–1635 [DOI] [PMC free article] [PubMed] [Google Scholar]
- Liu A, Xie S, Sun H, Gonzalez FJ, Wei X, Dai R (2009) Myotoxicity of gemfibrozil in cynomolgus monkey model and its relationship to pharmacokinetic properties. Toxicol Appl Pharmacol 235:287–295 [DOI] [PMC free article] [PubMed] [Google Scholar]
- Liu A, Yang J, Gonzalez FJ, Cheng GQ, Dai R (2011a) Biphasic regulation of intracellular calcium by gemfibrozil contributes to inhibiting L6 myoblast differentiation: implications for clinical myotoxicity. Chem Res Toxicol 24:229–237 [DOI] [PMC free article] [PubMed] [Google Scholar]
- Liu A, Yang J, Zhao X, Jiao X, Zhao W, Ma Q, Tang Z, Dai R (2011b) Induction of P450 3A1/2 and 2C6 by gemfibrozil in Sprague-Dawley rats. Pharmacol Rep 63:157–164 [DOI] [PubMed] [Google Scholar]
- Liu A, Yang J, Huang X, Xiong J, Wong AH, Chang L, Dai R (2012) Relaxation of rat thoracic aorta by fibrate drugs correlates with their potency to disturb intracellular calcium of VSMCs. Vascul Pharmacol 56:168–175 [DOI] [PubMed] [Google Scholar]
- Marcoff L, Thompson PD (2007) The role of coenzyme Q10 in statin-associated myopathy: a systematic review. J Am Coll Cardiol 49:2231–2237 [DOI] [PubMed] [Google Scholar]
- Matsubara T, Tanaka N, Patterson AD, Cho JY, Krausz KW, Gonzalez FJ (2011) Lithocholic acid disrupts phospholipid and sphin-golipid homeostasis leading to cholestasis in mice. Hepatology 53:1282–1293 [DOI] [PMC free article] [PubMed] [Google Scholar]
- Mukherjee R, Jow L, Noonan D, McDonnell DP (1994) Human and rat peroxisome proliferator activated receptors (PPARs) demonstrate similar tissue distribution but different responsiveness to PPAR activators. J Steroid Biochem Mol Biol 51:157–166 [DOI] [PubMed] [Google Scholar]
- Palmer CN, Hsu MH, Griffin KJ, Raucy JL, Johnson EF (1998) Peroxisome proliferator activated receptor-alpha expression in human liver. Mol Pharmacol 53:14–22 [PubMed] [Google Scholar]
- Peters JM, Cheung C, Gonzalez FJ (2005) Peroxisome proliferator- activated receptor-alpha and liver cancer: where do we stand? J Mol Med 83:774–785 [DOI] [PubMed] [Google Scholar]
- Post SM, Duez H, Gervois PP, Staels B, Kuipers F, Princen HM (2001) Fibrates suppress bile acid synthesis via peroxisome proliferator-activated receptor-alpha-mediated downregulation of cholesterol 7alpha-hydroxylase and sterol 27-hydroxylase expression. Arterioscler Thromb Vasc Biol 21:1840–1845 [DOI] [PubMed] [Google Scholar]
- Prindiville JS, Mennigen JA, Zamora JM, Moon TW, Weber JM (2011) The fibrate drug gemfibrozil disrupts lipoprotein metabolism in rainbow trout. Toxicol Appl Pharmacol 251:201–208 [DOI] [PubMed] [Google Scholar]
- Roglans N, Vazquez-Carrera M, Alegret M, Novell F, Zambon D, Ros E, Laguna JC, Sanchez RM (2004) Fibrates modify the expression of key factors involved in bile-acid synthesis and biliary-lipid secretion in gallstone patients. Eur J Clin Pharmacol 59:855–861 [DOI] [PubMed] [Google Scholar]
- Sabordo L, Sallustio BC (1997) Effects of gemfibrozil and clofibric acid on the uptake of taurocholate by isolated rat hepatocytes. Biochem Pharmacol 54:215–218 [DOI] [PubMed] [Google Scholar]
- Sausen PJ, Teets VJ, Voss KS, Miller RT, Cattley RC (1995) Gemfibrozil-induced peroxisome proliferation and hepatomegaly in male F344 rats. Cancer Lett 97:263–268 [DOI] [PubMed] [Google Scholar]
- Schneck DW, Birmingham BK, Zalikowski JA, Mitchell PD, Wang Y, Martin PD, Lasseter KC, Brown CD, Windass AS, Raza A (2004) The effect of gemfibrozil on the pharmacokinetics of rosuvastatin. Clin Pharmacol Ther 75:455–463 [DOI] [PubMed] [Google Scholar]
- Tanaka N, Matsubara T, Krausz KW, Patterson AD, Gonzalez FJ (2012) Disruption of phospholipid and bile acid homeostasis in mice with nonalcoholic steatohepatitis. Hepatology 56:118–129 [DOI] [PMC free article] [PubMed] [Google Scholar]
- Wagner M, Zollner G, Trauner M (2011) Nuclear receptors in liver disease. Hepatology 53:1023–1034 [DOI] [PubMed] [Google Scholar]
- Yang J, Zhao X, Liu X, Wang C, Gao P, Wang J, Li L, Gu J, Yang S, Xu G (2006) High performance liquid chromatography-mass spectrometry for metabonomics: potential biomarkers for acute deterioration of liver function in chronic hepatitis B. J Proteome Res 5:554–561 [DOI] [PubMed] [Google Scholar]
- Yang Q, Nagano T, Shah Y, Cheung C, Ito S, Gonzalez FJ (2008) The PPAR alpha-humanized mouse: a model to investigate species differences in liver toxicity mediated by PPAR alpha. Toxicol Sci 101:132–139 [DOI] [PMC free article] [PubMed] [Google Scholar]
- Yin P, Wan D, Zhao C, Chen J, Zhao X, Wang W, Lu X, Yang S, Gu J, Xu G (2009) A metabonomic study of hepatitis B-induced liver cirrhosis and hepatocellular carcinoma by using RP-LC and HILIC coupled with mass spectrometry. Mol BioSyst 5:868–876 [DOI] [PubMed] [Google Scholar]
Associated Data
This section collects any data citations, data availability statements, or supplementary materials included in this article.