

Abstract
Interleukin-2 (IL-2) has been shown to suppress immune pathologies by preferentially expanding regulatory T cells (Tregs). However, this therapy has been limited by off-target complications due to pathogenic cell expansion. Recent efforts have been focused on developing a more selective IL-2. It is well documented that certain anti-mouse IL-2 antibodies induce conformational changes that result in selective targeting of Tregs. We report the generation of a fully human anti-IL-2 antibody, F5111.2, that stabilizes IL-2 in a conformation that results in the preferential STAT5 phosphorylation of Tregs in vitro and selective expansion of Tregs in vivo. When complexed with human IL-2, F5111.2 induced remission of type 1 diabetes in the NOD mouse model, reduced disease severity in a model of experimental autoimmune encephalomyelitis and protected mice against xenogeneic graft-versus-host disease. These results suggest that IL-2-F5111.2 may provide an immunotherapy to treat autoimmune diseases and graft-versus-host disease.
Interleukin-2 (IL-2) is type I cytokine that functions as a multi-lineage lymphocyte growth factor1–3. IL-2 signals through a trimeric receptor comprised of IL-2Rα (CD25), IL-2Rβ (CD122) and IL-2Rγ (CD132)2–4. The signaling can be initiated either through the high-affinity (Kd≈10 pM) trimeric complex of the three subunits or through an intermediate-affinity dimeric complex (Kd ≈ 1 nM) with only IL-2Rβ and IL-2Rγ, without the non-signaling IL-2Rα subunit. The trimeric IL-2Rs are typically expressed at high levels by Tregs5, activated T effectors (Teffs) and ILC2s6, while the dimeric form of IL-2R is expressed mostly on antigen-experienced CD8+ T cells and natural killer (NK) cells7. Previous studies showed that IL-2 is highly flexible8,9 and exists in different conformations that favor either the high-affinity trimeric IL-2R or intermediate-affinity dimeric IL-2R, resulting in the activation of different immune cells9. This plasticity has complicated the use of the approved drug Proleukin at high doses to treat metastatic melanoma and renal cell carcinoma10, due to the role of IL-2 as an essential growth factor for Tregs11–13. Moreover, adverse effects of high-dose IL-2 therapy have greatly limited its use14,15.
Several studies have shown that low-dose IL-2 therapy preferentially activates Tregs due to the constitutive high expression of IL-2Rα16 and other cell-intrinsic factors that increase signal transduction sensitivity17. Treatment of mice and humans with low doses of IL-2 has been shown to ameliorate autoimmune diseases and graft-versus-host disease (GvHD) as well as delaying organ allograft rejection18–22. However, IL-2 therapy has some limitations, including difficulty in predicting the efficacious dose, off-target effects on different cell populations and a short in vivo half-life23,24. Thus, attempts have been made to engineer or modify the IL-2 structure to improve its therapeutic potential by modulating its ability to selectively target either Teffs or Tregs25–31. Selective antibodies against IL-2 can alter its conformation by binding a number of potential epitopes, thereby modifying the binding interaction of IL-2 to any of the IL-2R subunits and resulting in selective expansion of Tregs or Teff cell subsets32,33. For example, it has been demonstrated that a rat anti-mouse IL-2 monoclonal antibody (JES6–1) can be administered in complex with wild-type mouse IL-2 and used to preferentially enhance Treg populations26. Binding of JES6–1 to IL-2 alters its conformation to lower the affinity of mIL-2 for CD25, such that CD25high Tregs compete favorably for IL-2 binding and expansion against Teffs33.
The therapeutic potential of IL-2 to selectively activate the tolerogenic immune response, combined with the imperative to develop a human Treg-selective IL-2 compound, led us to develop a mechanism-based screening strategy to identify human antibodies against human IL-2 that exhibit an in vivo Treg potentiation profile when complexed with hIL-2. This class of monoclonal antibody, exemplified by F5111.2, blocked IL-2Rβ binding and reduced IL-2Rα binding to IL-2, and, when administered in complex with hIL-2, preferentially promoted Treg expansion and was effective in models of autoimmune disease including type 1 diabetes and experimental autoimmune encephalomyelitis (EAE) in addition to GvHD.
Results
Selective IL-2 stimulation in Tregs.
To directly compare Treg and Teff sensitivity to IL-2, the pSTAT5 signaling response of Tregs was analyzed in a mixed population of peripheral blood mononuclear cells (PBMCs). Teff cells were further divided on the basis of CD25 expression (Supplementary Fig. 1a,b). Tregs have a lower pSTAT5 EC50 in response to IL-2 than CD25+CD8+ T cells or CD25+CD4+ T cells expressing equal CD25 levels (Supplementary Fig. 1b). Cells that have little or no CD25 expression required much higher amounts of IL-2 to induce pSTAT5 signaling, consistent with the reduced affinity of the IL-2RPγ dimer for IL-2. In addition, maximal pSTAT5 signal was achieved in Tregs with less signal duration than in CD25+CD4+ cells (Supplementary Fig. 1c), confirming previous reports that Tregs are more sensitive to IL-2 than CD25+ effector T cells.
The anti-mouse IL-2 antibody JES6–1-IL-2 complex has been shown to promote the expansion of Tregs in vivo selectively, in contrast to other anti-IL-2 monoclonal antibodies such as S4B626,34. However, it is not clear whether this reflected altered pSTAT5 signaling or other effects of the IL-2 engagement with the receptor when bound to the monoclonal antibody. Thus, the pSTAT5 signaling profile of JES6–1-mIL-2 complex treatment on Tregs compared with Teff cells was examined (Supplementary Fig. 2). A heterogeneous population of mouse splenocytes was stimulated with serial dilutions of JES6–1 in complex with different IL-2 concentrations (Supplementary Fig. 2). IL-2-induced pSTAT5 signaling was strongly inhibited by JES6–1 in mouse CD8+ T cells at all IL-2 concentrations tested, whereas similar concentrations of JES6–1 spared Treg pSTAT5 signaling except at the lowest IL-2 and highest antibody concentrations tested. In contrast, S4B6-mIL-2 complex treatment did not inhibit pSTAT5 in CD8+ T cells, but did inhibit pSTAT5 signaling in Tregs stimulated with low levels of IL-2 (Supplementary Fig. 2).
In vivo, treatment of mice with JES6–1-mIL-2 resulted in preferential Treg expansion, suggesting that pSTAT5 signaling can distinguish Treg-or Teff-promoting antibodies.
Treg-sparing anti-human IL-2 antibodies.
Human antibodies against human IL-2 were identified using a single-chain variablefragment phage display library and relevant candidates were developed into full human IgGs. Purified IgGs were assessed by surface plasmon resonance (SPR) analysis to characterize the binding affinity for IL-2, and their ability to inhibit binding of IL-2 to IL-2Rα or IL-2Rβ chains was assessed (Fig. 1a,b). Antibodies were then grouped into epitope bins as follows: antibody inhibits IL-2 binding to IL-2Rα (group 1); antibody inhibits IL-2 binding to IL-2Rβ (group 2); antibody inhibits IL-2 binding to IL-2Rβ and reduces binding to IL-2Rα (group 3).
Fig 1 |. Characterization of human anti-IL-2 antibodies with different receptor inhibition and human Treg pSTAT5 signaling profiles.
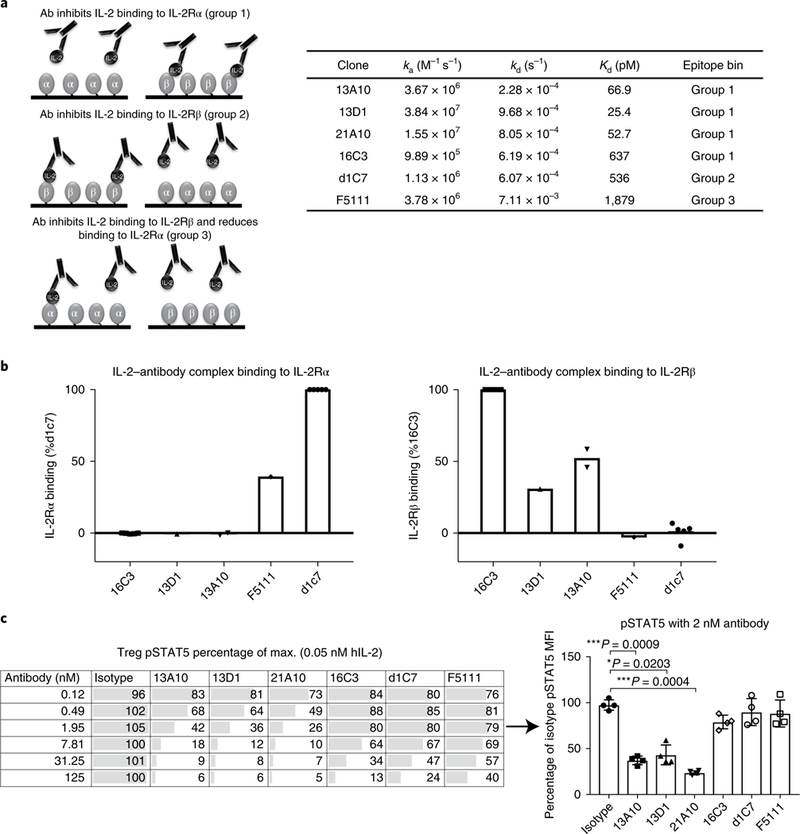
a, Schematic of IL-2Rβ- and α-blocker anti-IL-2 antibodies, and SPR kinetic binding analysis of the antibody-IL-2 interactions. Antibodies were grouped into epitope bins on the basis of their ability to block binding of IL-2 to IL-2Rα (group 1) and IL-2Rβ (group 2), and partial inhibition of IL-2Rα/full inhibition of IL-2Rβ (group 3). b, SPR analysis of antibody-IL-2 complexes binding to the a (left) and p (right) subunits of the IL-2 receptor. The data are shown as a percentage of the control: 16C3 for IL-2Rβ binding and d1C7 for the IL-2Rα binding. c, STAT5 phosphorylation response of human Tregs to anti-hIL-2 antibodies belonging to epitope bin groups 1, 2 and 3. Serial dilutions of antibodies in complex with 0.05nM hIL-2 were used. Left, a single donor representative of four is shown (mean of duplicate wells). Right, responses from four donors are shown for a single antibody concentration (2nM antibody). Each symbol represents an individual donor, the bars indicate the mean and the error bars represent standard deviation. The P values shown were determined by one-way ANOVA (Dunnett’s multiple-comparison test compared with the isotype control).
Antibodies from each functional epitope bin were assessed for their ability to maintain Treg pSTAT5 signaling in response to stimulation of PBMCs with IL-2. As shown in Fig. 1c, some antibodies completely blocked Treg pSTAT5, while others had little inhibitory activity. The antibodies in groups 2 and 3 generally suppressed Treg responses less well. However, some group 1 antibodies, such as 16C3, did not inhibit Treg signaling, although the affinity of 16C3 was weaker than that of other group 1 antibodies, as was the most efficient group 3 antibody, including F5111. Thus, it was unclear whether the Treg- sparing properties of 16C3 and F5111 were a result of the specific epitope targeted, the affinity of the antibody or allosteric properties.
We generated a series of affinity-matured variants of the antibodies 16C3 and F5111 (Fig. 2a) and assessed Treg responses to antibody-IL-2 complexes. Affinity maturation of F5111 did not result in considerable inhibition of Treg signaling (Fig. 2b), in contrast to 16C3, which lost its selective effects when affinity-matured (Fig. 2b). These data suggested that the difference in selective Treg inhibition was epitope-related.
Fig. 2 |. Identification of a novel anti-human IL-2 antibody that inhibits effector T cell responses to IL-2 but does not block Treg pSTAT5.
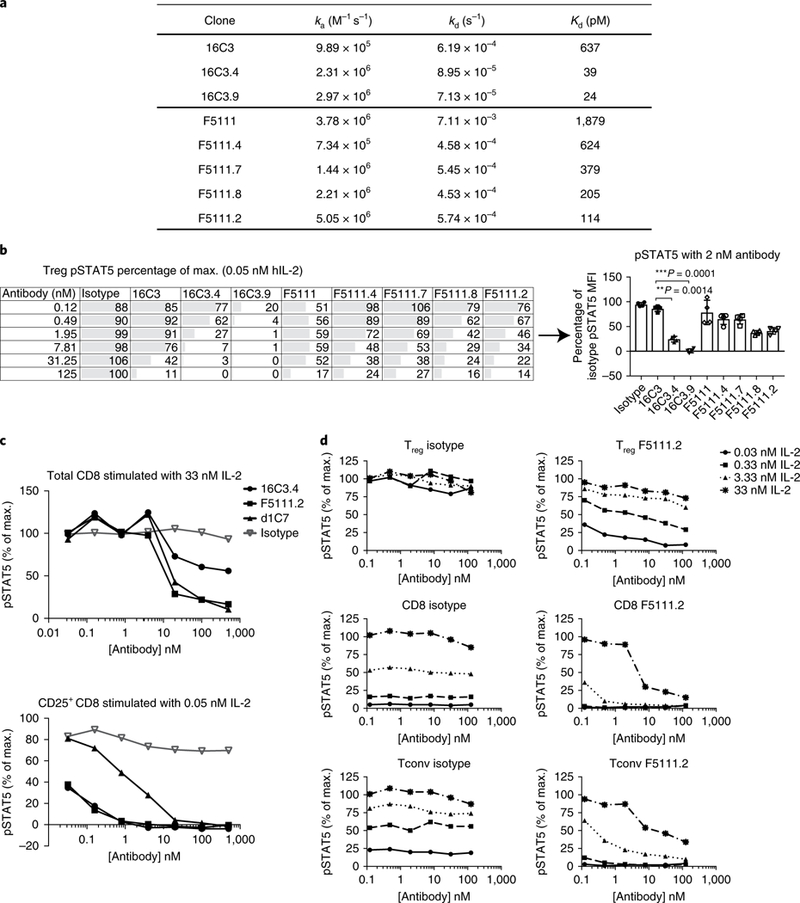
a, Kinetic binding analysis of affinity-matured variants of 16C3 and F5111. b, Serial dilutions of anti-hIL-2 antibodies in complex with 0.05nM of hIL-2 were assessed on the basis of STAT5 phosphorylation responses of human Tregs to increasing affinities of 16C3 (Group 1) and F5111 (Group 3). A single donor, representative of four individuals, is shown on the left (mean of duplicate wells). Right, responses from the four donors are shown for a single antibody concentration (2 nM antibody). Each symbol represents an individual donor, the bars indicate the mean and the error bars represent standard deviation. The P values shown were determined by one-way ANOVA (Dunnett’s multiple-comparison test compared with the isotype control). c, STAT5 phosphorylation of total CD8 versus CD25+ CD8 cells in response to anti-hIL-2 antibodies from different epitopes bins. Serial dilutions of anti-hIL-2 antibodies in complex with two different concentrations of hIL-2 (0.05 nM and 33 nM) were used. Data are representative of four individual donors. d, STAT5 phosphorylation responses of human Tregs, CD8+ T cells and Tconv cells to serial dilutions of F5111.2 in complex with four different concentrations of hIL-2. Data are representative of two individual donors. A similar experiment, with three concentrations of IL-2 (33, 1.32 and 0.05 nM IL-2), was performed on ten individual donors, and results are comparable. For b and d, Tregs were identified by gating on CD3+CD4+CD25highCD127low cells.
In parallel, we assessed the ability of the different anti-IL-2 monoclonal antibodies to inhibit Teff response to IL-2. As shown in Fig. 2c, STAT5 phosphorylation of CD25+CD8+ T cells, induced by low doses of IL-2, was inhibited most effectively by IL-2 antibodies that block the binding of IL-2Rα to IL-2, such as 16C3.4. In contrast, high concentrations of IL-2 were inhibited more effectively by antibodies that blocked the binding of IL-2 to IL-2Rβ, such as d1C7 or F5111.2. In agreement with this observation, the affinity- matured antibody F5111.2 inhibited CD25+CD8+ T cell pSTAT5, while another IL-2RP epitope-blocking antibody, d1C7, did not (Fig. 2c). The F5111.2 antibody inhibited pSTAT5 signaling most effectively in CD8+ T cells across a range of IL-2 concentrations, and maintained functional activity on CD25+CD8+ effector T cells. These results suggest that the biological activity of the F5111.2 antibody was a consequence of the blockade of IL-2 binding to IL-2Rβ as well as a decreased binding of IL-2 to IL-2Rα. STAT5 phosphorylation was efficiently preserved in Tregs versus CD8 cells at low doses of IL-2, which is qualitatively different to anti-IL-2 antibodies that exclusively block IL-2Rα or IL-2Rβ binding.
To fully characterize the pSTAT5 signaling profile of antibody F5111.2, we stimulated human PBMCs with serial dilutions of F5111.2 in complex with different amounts of human IL-2, and gated on different T cell subsets (Fig. 2d). In Tregs, F5111.2 treatment had limited effects on IL-2-induced phosphorylation of STAT5 (Fig. 2d). In contrast, phosphorylation of STAT5 by IL-2 in CD8+ T cells was inhibited by F5111.2 at all IL-2 concentrations tested. Overall, the differential pattern of inhibition of STAT5 phosphorylation by F5111.2 in CD8 and Tregs was similar to that observed with the anti-mouse IL-2 antibody JES6–1 above.
To mitigate any potential confound resulting from cellular competition, cell subsets were purified from PBMCs using magnetic isolation, and then stimulated with different amounts of IL-2-antibody (Supplementary Fig. 3). Due to a low frequency of Tregs in PBMC preparations, Tregs were expanded for 9 days following isolation35 before stimulation. Purified NK cells were studied as well as T cell subsets including naive and memory CD4 and CD8 cells. These data confirmed that the F5111.2 monoclonal antibody had no effect on Treg responses to IL-2 but effectively inhibited effector cell responses.
Inhibited upregulation of IL-2-induced proteins in CD8+ T cells.
To investigate the selective effects of F5111.2 on all T cell subsets downstream of pSTAT5 signaling, we incubated PBMCs with F5111.2−hIL-2 complexes and assessed the expression of CD25 and FoxP3 on Tregs, and CD26 and CD49d on CD8+ T cells (Fig. 3a). CD26 and CD49d were assessed on CD8+ T cells to complement the CD25 analyses, where levels are directly influenced by IL-2 treatment11. CD25 and FoxP3 expression levels were largely equivalent to isotype−IL-2 treatment on Tregs, although a decrease in CD25 and FoxP3 was observed at the very highest ratio of antibody to IL-2. In contrast, IL-2-induced CD26 and CD49d on CD8+ cells were blocked by F5111.2 treatment at all concentrations of IL-2 tested (Fig. 3a). These data are consistent with F5111.2 selectively preserving IL-2 responses in Tregs, while blocking them in CD8+ T cells.
Fig. 3 |. Antibody F5111.2 inhibits upregulation of IL-2-induced proteins in CD8+ T cells but not Tregs in vitro.
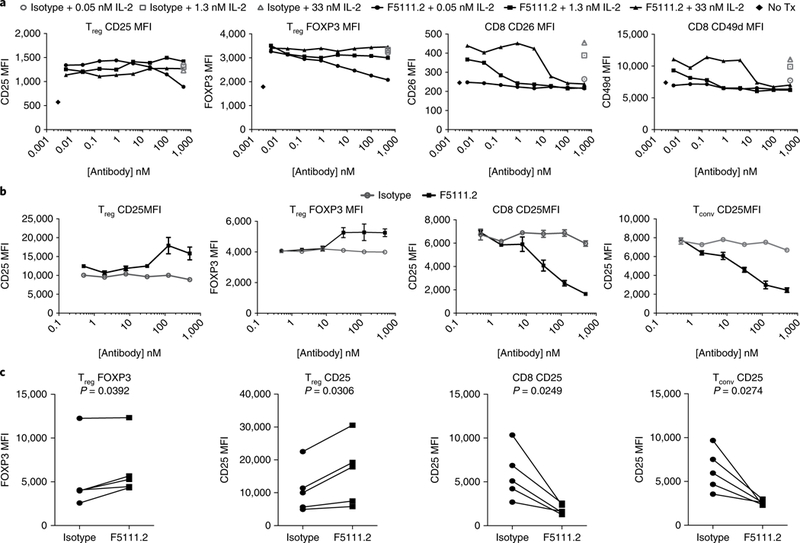
a, IL-2-inducible protein expression on Tregs and CD8+ T cells with serial dilutions of F5111.2 in complex with three different concentrations of hIL-2 (0.05 nM, 1.3 nM and 33 nM) for 48 h. Isotype- matched antibody was used as a control. Representative results from one of four experiments are shown, with data presented as the mean of duplicates of cell culture wells. b, Dose response of CD25 and FoxP3 expression on Treg, Tconv and CD8 cells following expansion of human PBMCs in the presence of hIL-2 (5 ngml−1)-F5111.2 complexes for five days. Representative results from one of five experiments are shown. The symbol is plotted at the mean of triplicate wells, with the error bars representing standard deviation. c, CD25 and FoxP3 expression on Treg, Tconv and CD8 cells following TCR stimulation of human PBMCs in the presence of F5111.2-hIL-2 complex for five days. The amount of F5111.2 used was 125nM in complex with 5 ng ml−1 (0.33 nM) of hIL-2. Five different donors are represented. The P values shown were determined by a two-tailed paired Student’s t-test and 95% confidence intervals.
T cell antigen receptor (TCR)-induced proliferation is known to upregulate CD25 on both Teffs and Tregs. Therefore, F5111.2−hIL-2 complex treatment in PBMCs stimulated with polyclonal TCR stimulation was assessed. Treatment of the cells with F5111.2−hIL-2 resulted in increased levels of FoxP3 and CD25 expression at day 5 as compared with isotype−IL-2. In contrast, induction of CD25 was blocked on CD8+ T cells and conventional CD4+ T cells (Fig. 3b). The response was consistent among multiple donors (Fig. 3c).
Structure of the F5111 Fab in complex with human IL-2.
The crystal structure of the F5111 Fab bound to IL-2 was solved to a 2.75 A resolution (Fig. 4 and Supplementary Table 1). Comparison to the IL-2-IL-2 receptor (α,β,γc) quaternary structure (PDB ID 2B5I) revealed that F5111 blocks the IL-2Rβ-binding site of IL-2 but not the IL-2Rα- or γc-binding sites (Fig. 4a,b). F5111 interacts with the IL-2 molecule at helices A and C and the B-C loop via the light-chain CDR1 and CDR3 loops and the heavy-chain CDR2 and CDR3 loops (Fig. 4c). The overall structure of IL-2 in complex with the F5111 Fab is similar to the unliganded structure (PDB ID 1M47, root mean squared deviation 0.359 Å over 95 Cα atoms). However, significant perturbations occur where F5111 binds the A-B and B-C loops of IL-2 that propagate to the CD25-binding site. These perturbations include the side chains of residues Pro34, Lys35, Arg38, Met39, Phe42, Val69 and Leu72 moving to positions that would be less favorable for CD25 binding (Fig. 4c,d), most likely explaining the decreased affinity of F5111-IL-2 for CD25. This conformational remodeling can be contrasted with the JES6–1-mIL-2 structure33, in which the mIL-2 residues corresponding to Lys35 and Arg38 of hIL-2 move away from the putative CD25-binding site and are sequestered by JES6–1 (Supplementary Fig. 4). Collectively, however, despite different binding sites on human versus murine IL-2, respectively, F5111 and JES6 appear to exert an allosteric effect resulting in lowered affinity for CD25, which presumably results in a competitive advantage for Tregs, which express high levels of CD25.
Fig. 4 |. The IL-2-F5111 complex structure reveals that the F5111 Fab obstructs the IL-2Rβ-binding site on IL-2.
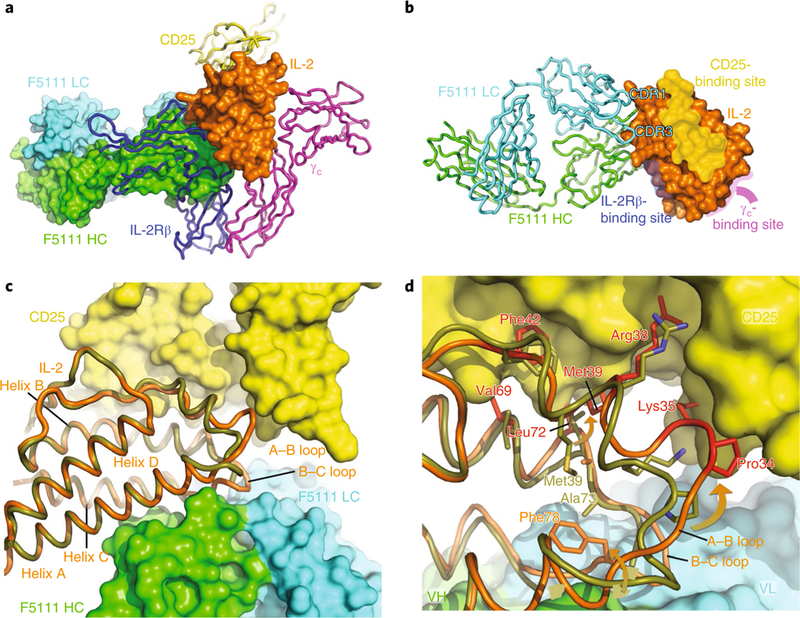
a, The IL-2-F5111 complex superimposed on the IL-2-receptor quaternary complex (PDB code 2B5I) shows steric obstruction of IL-2Rβ by the Fab. The F5111 heavy chain (HC; green) and light chain (LC; cyan) and IL-2 (orange) are shown in surface representation. CD25 (yellow), IL-2Rβ (blue) and γc (magenta) are shown as ribbons. b, IL-2 (surface representation) complexed with F5111 (ribbons) is shown, highlighting the binding sites on IL-2 for the IL-2 receptor complex. c, A ‘top-down’ view comparison of the IL-2 conformations in the IL-2-F5111 complex (orange) and the IL-2-receptor quaternary complex (PDB code 2B5I, olive-yellow) shows that the position of the IL-2 A-B loop in the IL-2-F5111 complex is incompatible with CD25 binding. IL-2 is shown as a ribbon while CD25 is shown in surface representation. d, High-resolution depiction of c. The IL-2 residues in the IL-2-F5111 complex that would conflict with CD25 are highlighted in red. The arrows illustrate movements of the A-B and B-C loops induced by F5111 binding. VH, heavy-chain variable domain; VL, light-chain variable domain.
Preferential Treg proliferation in response to F5111.2−hIL-2.
To investigate the effect of the F5111.2−hIL-2 complex in vivo, we established a humanized mouse model, where human PBMCs isolated from healthy donors were incubated overnight with polyclonal stimulation, and then injected into 12-week-old immuno-deficient non-obese diabetic (NOD) scid gamma (NSG) mice, mimicking the high activation state of effector cells observed in autoimmune diseases. Ex vivo polyclonal activation was more effective in supporting Treg proliferation in vivo and also increased CD25 mean fluorescence intensity (MFI) on all T cell subsets (Fig. 5a). F5111.2-hIL-2 complex treatment increased Treg total cell number, with a considerably smaller proportional increase in total CD4+ and CD8+ T cell number (Fig. 5b). This selective expansion resulted in an increased percentage of Tregs and ratios of Treg to CD4+ and CD8+ T cells in the spleen (Fig. 5c). In addition, F5111.2−hIL-2 complex treatment promoted a relatively smaller increase in Th1, Th2 and Th17 cell numbers, as compared to Tregs, while decreasing NK cell numbers (Supplementary Fig. 5a). Overall, the data demonstrated that F5111.2−hIL-2 complex treatment considerably increased the ratios of Tregs to NK cells, Th1, Th2 and Th17 (Supplementary Fig. 5b).
Fig. 5 |. The F5111.2-hIL-2 complex preferentially increases Tregs in an in vivo NSG expansion model.
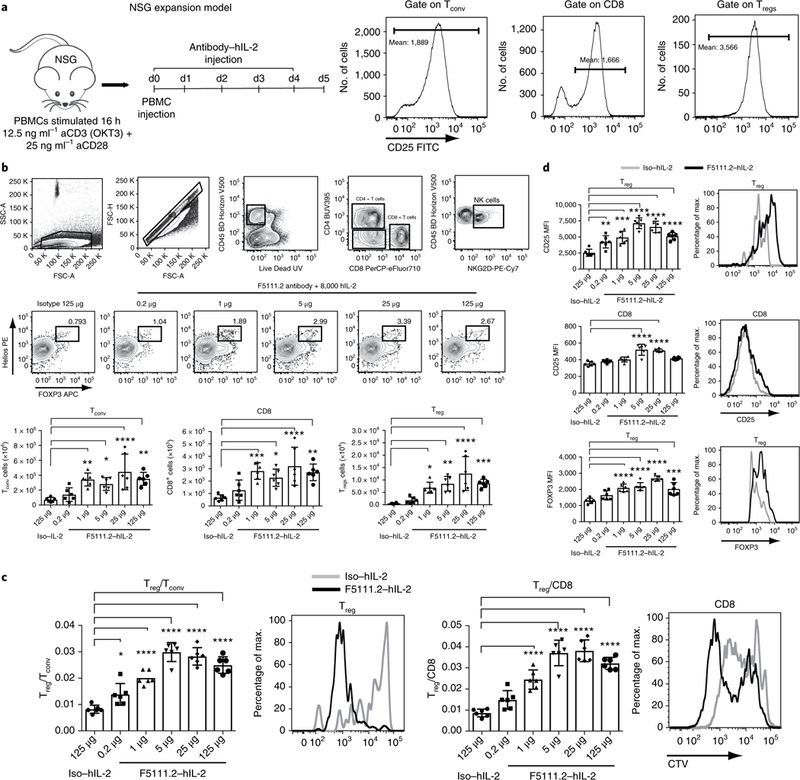
a, NSG expansion model. Human PBMCs were activated with polyclonal stimulation overnight, and injected into 12-week-old NSG mice. The mice received five consecutive days of F5111.2-hIL-2 complex treatment. CD25 expression (MFI) on human Tconv, Tregs and CD8+ T cells before injection at day 0. b, Gating strategy, Treg percentage in response to different doses of F5111.2-hIL-2 complex; Tconv, CD8 and Treg total cell number. c, Treg/Tconv and Treg/CD8 ratio after treatment with different doses of F5111.2 (0.2, 1, 5, 25 and 125 μg) and the isotype (125μg) in complex with 8,000 U (~0.49μg) hIL-2. Representative histograms show CellTrace Violet (CTV) dilutions of Treg and CD8 in response to F5111.2-hIL-2 complex (black line) compared to the isotype control (gray line). d, CD25 and FoxP3 MFI on Tregs and CD8 in response to different doses of F5111.2-hIL-2 complex. Representative histograms show CD25 and FoxP3 MFI on Tregs and CD8 in response to the isotype (gray line) and the F5111.2-hIL-2 complex (black line). For a-d, the experiment was repeated three times with similar results. One of three similar experiments is shown, with data presented as the mean± s.d. of six mice per group. The P values shown were determined by one-way ANOVA (Dunnett’s multiple-comparison test). *P≤0.05, **P≤0.01, ***P≤ 0.001, ****P≤0.0001.
The proliferation of the cells was visualized by labeling the cells with CTV before transfer and treatment. F5111.2 antibody−hIL-2 complexes induced increased proliferation of Tregs and CD8+ T cells; however, a greater number of undivided cells remained in the CD8+ T cell population (Fig. 5c). Thus, a selective expansion of the Tregs accounted for the increased Treg/CD8+ T cell ratio observed.
In addition, treatment with the F5111.2 antibody−hIL-2 complexes led to increased CD25 MFI on the transferred T cell populations, especially on Tregs (Fig. 5d). Moreover, increased FoxP3 expression in Tregs was observed, consistent with the treatment effectively increasing cell stability (Fig. 5d).
Additional functional markers and cytokine production showed that F5111.2−hIL-2 complex treatment considerably increased CTLA-4 MFI and the percentage of IL-10+ Tregs, while not altering IL-2 or IFNγ production by Tregs (Supplementary Fig. 6a). An increase in all transcription factors analyzed on CD4+ T (Tconv) cells as well as the percentage of IFNγ+, IL-17A+ and IL-4+ cells was observed with a pronounced decrease in the percentage of IL-2+ cells (Supplementary Fig. 6b). F5111.2−hIL-2 complex treatment also induced a slight increase in cytolytic molecules and effector cytokines in CD8+ T cells and NK cells, although a substantial decrease in the percentage of IL-2+ CD8+ T cells was observed after treatment (Supplementary Fig. 6c,d).
Together, these data suggest that F5111.2−hIL-2 complex treatment preferentially increases Tregs over other immune cell populations and that expanded Tregs exhibit increased expression of relevant molecular determinants of function and otherwise phenotypic integrity.
F5111.2−hIL-2 promoted Treg expansion better than 16C3.4.
In vitro data showed that the antibodies that blocked binding of IL-2 to IL-2Rβ were better at promoting differential Treg expansion. To directly test this observation in vivo, we compared the physiologic effects of the antibody 16C3.4 to the antibody F5111.2. In both cases, treatment of mice with the antibody-hIL-2 complexes increased Treg cell number. However, the 16C3.4-hIL-2 complexes led to a markedly greater increase in CD8 cell number (Supplementary Fig. 7a). Consistent with the altered cell numbers, treatment of mice with F5111.2-hIL-2 complexes resulted in increased Treg/CD4 and Treg/CD8 ratios, which was not observed with 16C3.4-hIL-2 complex treatment (Supplementary Fig. 7b). These results suggest that the combined steric and allosteric effects of F5111.2 were critical to the biologic activity of these complexes seen in vivo.
F5111.2−hIL-2 efficacy in autoimmune diseases and GvHD.
Treatment of NOD mice with JES6–1−mIL-2 at the time of disease onset can increase islet-resident Tregs and reverse disease progression36. F5111.2−hIL-2 complex treatment of NOD mice increased the percentage of pancreatic Tregs one week after treatment (Fig. 6a) and influenced phenotypic characteristics of Tregs in the pancreas34. No changes in CD8+ and CD4+ Tconv populations were observed (Fig. 6b). In addition, CD25 and FoxP3 expression increased in Tregs, a result not observed following isotype control-hIL-2 complex treatment (Fig. 6a), or on CD8+ and cD4+ Tconv cells (Fig. 6b). No pronounced effects of F5111.2−hIL-2 treatment were observed on other immune cell populations in several organs and no considerable increase in non-Treg cell numbers was observed (Supplementary Fig. 8a). In addition, a substantial increase in CD25 MFI was observed on Tregs after F5111.2-hIL-2 treatment in spleen and blood as well as on Tconv in the pancreas. No pronounced increase in CD25 MFI was observed for CD8+ T cells and NK cells (Supplementary Fig. 8b). To further evaluate the functionality of the expanded Tregs in response to the F5111.2−hIL-2 complex, we performed an in vitro suppression assay that shows that F5111.2−hIL-2-expanded Tregs retained their suppressive ability (Supplementary Fig. 9a). A substantial increase in FoxP3, CD25, CTLA-4, ICOS and CD39 MFI and in the percentage of IL-10+ Tregs was found following treatment with the F5111.2−hIL-2 complex. In contrast, a pronounced reduction in the percentage of IL-2+ CD4+ T cells and no change in IFNγ production were observed (Supplementary Fig. 9b,c). These data suggest an overall better functionality of Tregs in response to treatment with F5111.2−hIL-2.
Fig. 6 |. The F5111.2-hIL-2 complex increases the Treg proportion and reinforces the Treg phenotype in inflamed pancreas leading to diabetes remission in NOD mice.
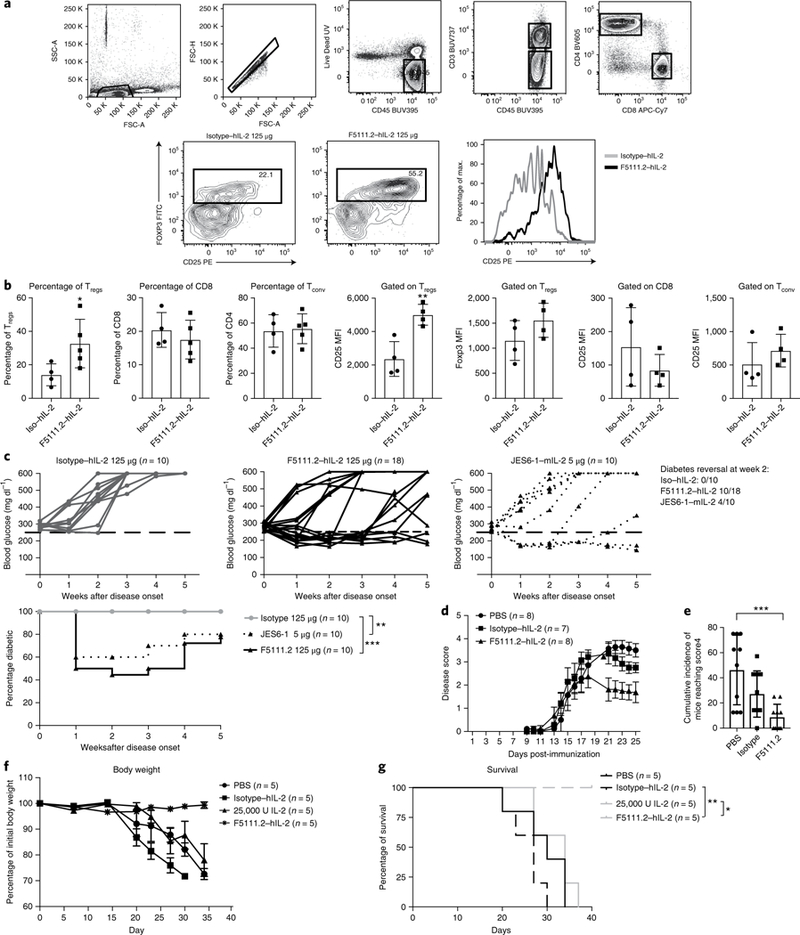
a, The gating strategy and percentage of Tregs in the pancreas of new onset diabetic NOD mice treated with the isotype (125 μg) or F5111.2 (125 μg) in complex with 8,000 U hIL-2 for 5 consecutive days at disease onset. Tregs were identified gating on CD45+CD4+CD25+FoxP3+ cells. Representative histograms show CD25 expression on FoxP3+ Tregs in response to the isotype (gray line) or F5111.2-hIL-2 (black line) complex treatment. b, Bar graphs summarizing the percentage of Tregs, CD8 and Tconv and CD25 expression on Tregs, CD8 and Tconv. The data are presented as the mean±s.d. of four mice per group. The P values shown were determined by unpaired two-tailed f-test. c, Blood glucose concentrations of new onset diabetic NOD mice treated with the isotype (left), F5111.2-hIL-2 (center) and JES6–1-mIL-2 complex (right). The 250 mgdl−1 blood glucose value is indicated by a dashed black line. The age of treatment onset was 14± 24 weeks; percentage of diabetic mice plotted. The P values shown were determined by two-way ANOVA (Dunnett’s test). *P<0.05, **P<0.01, ***P< 0.001. d, Disease score of EAE in B6 mice treated with PBS, 25,000 IU IL-2 in complex with 50 μg of the isotype or 50 μg of F5111.2. e, Cumulative incidence of mice reaching clinical score 4. The data are representative of two independent experiments. The P values shown were determined by one-way ANOVA (Dunnett’s test). f, Recipient NSG mice were grafted with 30×106 activated PBMCs and treated with daily injections of PBS, 25,000 IU hIL-2, 25 μg of F5111.2 or the isotype in complex with 8,000 U hIL-2 for five consecutive days. g, Weight curves and Kaplan-Meier survival curves of the grafted mice. The data are presented as the mean± s.d. of five mice per group. The P values shown were determined by Mantel-Cox test. *P<0.05, **P<0.01, ***P<0.001.
Next, we determined whether the five-day treatment would lead to a considerable effect on diabetes progression in the new onset environment. Treatment of new-onset NOD mice with F5111.2−hIL-2 complexes resulted in diabetes remission in 50% of the mice within 1 week (Fig. 6b). Importantly, the majority of the F5111.2−hIL-2-treated mice remained normoglycemic over the four-week duration of the experiment in the absence of continued treatment (Fig. 6c). There was no reversal of the disease with hIL-2 administered with an isotype control monoclonal antibody, suggesting that the beneficial effect depended on the complex with the anti-hIL-2 monoclonal antibody (Fig. 6c).
F5111.2−hIL-2 complex was also tested in an EAE model. Considerable lower severity of disease was observed in mice treated with F5111.2−hIL-2 as compared to PBS and low-dose hIL-2 groups (Fig. 6d,e).
Finally, to demonstrate therapeutic efficacy on human T cells, we assessed the impact of Treg expansion in response to F5111.2−hIL-2 complex in a xeno-GvHD model37. Administration of F5111.2−hIL-2 complex for five consecutive days protected mice from disease compared to the control group and low-dose IL-2 treatment (Fig. 6f,g).
F5111.2−hIL-2 does not affect immune response to virus.
To evaluate whether the Tregs expanded in response to F5111.2− hIL-2 treatment could impact host defense and affect the de novo generation of effector T cells during viral infection, we infected B6 mice with mouse cytomegalovirus (MCMV) and later confirmed successful infection by verifying maintained viral load in the spleen (Supplementary Fig. 10a,b). Treatment of infected mice for five consecutive days with F5111.2−hIL-2 complexes resulted in an increased number of Tregs in the blood with no concomitant increases in other immune cell populations as previously observed (Supplementary Fig. 10c). Moreover, treatment with F5111.2;hIL-2 did not impact the percentage of NKG2D+CD8+ T cells38 or Ly49H+ NK cells39,40 as compared to the isotype control, suggesting that although the Treg number was increased, the ability of the immune system to respond to viral infection remained intact (Supplementary Fig. 10d).
Discussion
In this study, we set out to develop an antibody that would bind human IL-2 and promote Treg expansion and function selectively. A large, fully human, naive phage display antibody library was screened to identify a series of antibodies with distinct IL-2-binding characteristics ranging from full blockade of IL-2Rα- or IL-2Rβ-binding activity to those that altered IL-2 conformation, resulting in both steric inhibition of IL-2Rβ binding combined with allosteric effects on IL-2Rα binding. Here, we show that these dual inhibitors, exemplified by the F5111.2 monoclonal antibody, when complexed with hIL-2, preferentially inhibited STAT5 signaling in human CD8+ and CD4+ Teff cells, increased the Treg/Teff ratio in a human PBMC NSG expansion model, promoted increased expression of key Treg functional molecules and showed activity in autoimmune disease mouse models such as type 1 diabetes and EAE in addition to GvHD.
Studies initiated in mice, using JES6–1−mIL-2 complexes, showed that a short course of daily injections increased Treg numbers by 7–15-fold, while CD8+ T and NK cells were not considerably affected26,41,42. Structural analyses of the JES6–1−mIL-2 complex suggested that, in addition to the potentially increased half-life of the monoclonal antibody−mIL-2 complexes, the JES6–1 monoclonal antibody stabilized a conformation of IL-2 resulting in preferential binding of IL-2Rαhigh cells2,33. These characteristics of the JES6–1−mIL-2 complexes have been translated into in vivo efficacy in a number of autoimmune and inflammatory disease models34,43–45. This study set out and succeeded in developing a similarly effective human monoclonal antibody that can be developed in complex with human IL-2 to treat immunological diseases in humans.
It is important to note that F5111 exhibits conformational changes observed in the region of IL-2 that engages CD25 in a functionally analogous manner, although distinct in atomic structure, to the conformation change in the CD25-binding regions of mouse IL-2 by JES6–1. Binding of F5111 to human IL-2 may work to lower the affinity for IL-2Rα through a similar allosteric mechanism, although this remains to be shown through detailed biophysical experiments. Nevertheless, given that F5111 does not sterically occlude the CD25-binding site on human IL-2, and that F5111 must release IL-2 for the cytokine to bind and activate the IL-2Rβ−γc dimer, it seems reasonable to speculate that low-affinity binding of CD25 to the human IL-2−F5111 complex leads to a conformational change that results in destabilization of the complex. This mechanism would favor selective activation of CD25high cells through a similar mass-action-based mechanism as JES6–1.
Despite the limitations of low-dose IL-2 therapy, several clinical studies have been performed testing the safety and potential efficacy of low-dose IL-2 in patients46. In one type 1 diabetes clinical trial17, lowering the IL-2 dose resulted in Treg expansion with no pronounced decrease of C-peptide production, a toxicity experienced in a small study examining combined treatment of a higher dose (threefold) and rapamycin24. This observation highlights the fine line between toxicity and efficacy using naked IL-2 therapy and emphasizes the importance of further improving IL-2 selectivity. Due to cross-species difference, the use of low-dose human IL-2 in mice does not reflect its real activity in patients; however, here we demonstrated that, in vivo, F5111.2−hIL-2 complex treatment shows increased efficacy compared to standard low-dose hIL-2 treatment, suggesting an improved therapeutic potential for patients.
Finally, in the clinical field, the administration of IL-2 plus an antibody could be seen as a complex scenario for therapeutic application since the two components could dissociate. However, one can envision two advantages. First, hIL-2 has a well-documented profile in patients, and the use of an approved drug as part of the complex would reduce risk. Second, the ability of the monoclonal antibody to dissociate under some conditions with the complexed IL-2 provides an opportunity to bind locally endogenously produced IL-2, changing its conformation and increasing its half-life to potentially enhance pro-Treg activity.
The promising results obtained using the JES6–1 monoclonal antibody−mIL-2 complex in mice highlight the need to translate that knowledge to the human system. Our data offer the first strong evidence for a completely human anti-IL-2 antibody that can be used therapeutically to specifically target human Tregs and therefore restore a proper Treg/Teff balance in autoimmune diseases. Active efforts are underway to move these compounds forward into patients.
Methods
IL-2-antibody binding kinetics and affinity.
Anti-IL-2 single-chain variable fragments, and subsequent IgG constructs, were generated as described in Supplementary Fig. 11. The affinity of the IL-2-specific antibodies was determined by SPR using a Biacore T200 instrument (GE Healthcare). Anti-IL-2 IgGs were captured on a CM5 sensor chip by an anti-human IgG prepared using the Biacore Human Antibody Capture Kit according to the manufacturer’s directions (GE Healthcare). Experiments were performed at 25 °C using a 30 μl min−1 flow rate in 0.01 M HEPES pH 7.4, 0.15 M NaCl and 0.005% (v/v) surfactant P20 (HBS-P) buffer. After each cycle, the chip surface was regenerated with 3 M MgCl2 and new antibody was captured. Recombinant IL-2 (Humanzyme) was injected over the surface for 3 min and the dissociation was monitored for a further 20 min. Data were analyzed using the Biacore T200 Evaluation software v3; the signal from the adjacent control flow cell with only the capture antibody immobilized was background-subtracted along with buffer-alone injections for each antibody. A 1:1 Langmuir binding model was used to fit all binding curves.
IL-2-antibody epitope characterization.
The anti-IL-2 antibody-binding epitopes were characterized on the basis of their ability to competitively bind to IL-2 using an Octet QK384 system (ForteBio). Biotinylated IL-2 was captured on streptavidin-coated biosensor tips and then incubated for 10 min with 25 nM antibody 1, followed by 25 nM antibody 2 for a further 10 min. Sensor tips were regenerated with low-pH buffer. The commercial antibodies MAB602 (R&D Systems) and 5344 (no. 555051 BD Pharmingen), which have been reported to compete with IL-2Rα and IL-2Rβ binding, respectively26,42, were used to further define the apparent epitope bins as competitive with either IL-2Rα or IL-2Rβ binding to IL-2.
IL-2−antibody complex receptor binding.
The ability of the antibodies to modify IL-2 binding to the IL-2 receptors IL-2Rα and IL-2Rβ was assessed using a Biacore T200 Instrument. Recombinant IL-2Rα and IL-2Rβ protein were biotin-labeled and captured on a Biacore streptavidin chip (GE Healthcare). Experiments were performed at 25°C using a 10 μl min−1 flow rate in HBS-P buffer. IL-2 (333 nM) was pre-incubated with IL-2-specific or isotype control IgGs (1,000 nM) for at least 20 min. IL-2−antibody complexes were injected over the receptor-coupled chip surface for 60 s and allowed to dissociate for 20 min. Data were background-subtracted using the adjacent control flow cell and buffer-alone injections. The response is reported as the binding to IL-2Rα and IL-2Rβ after 60 s as a percentage of the binding of two representative clones, d1C7 and 16C3 in complex with IL-2, to IL-2Rα and IL-2Rβ, respectively.
Crystallization of the Fab 5111 complex with IL-2.
Antibody F5111 Fab was expressed by transient transfection in HEK293 cells and purified by LambdaFabSelect chromatography (GE Life Sciences). F5111 Fab was mixed with a 1.5-fold excess of IL-2, and the complex was purified by fast protein liquid chromatography on a Superdex 200 column. The purified Fab−IL-2 complex was concentrated to 10 mg ml−1 as measured at 280 nm using an extinction coefficient of 1.49 ml mg−1 cm−1. The complex was mixed with an equal volume of precipitant solution (100 mM sodium citrate, pH 5.0; 20% polyethylene glycol 6000) and crystallized by sitting-drop vapor diffusion over a reservoir of precipitant solution. Prismatic crystals formed within one week. Crystals were cryoprotected by addition of glycerol to 30% (v/v), collected and rapidly cooled by plunging into liquid nitrogen.
Crystallographic data collection and refinement.
Diffraction data were collected at 100 K at the Advanced Light Source Beamline 8.2.1. The crystals were indexed in space group P21 with unit-cell dimensions a = 86.01 Å, b = 145.73 Å, c = 107.32 Å and β = 95.38°. A maximum resolution of 2.75 Å was used for structure solution and refinement. The structure was solved by molecular replacement using the program Phaser47. Search models included the heavy-chain constant domain from pdb entry 3U1S, the heavy-chain variable domain from 4NPY, the light-chain constant domain from 3N9G, the light-chain variable domain from 4HP0 and IL-2 from 2B5I (ref.48). Four copies of the Fab−IL-2 complex were modeled in the asymmetric unit. The structure was built by iterative cycles of manual rebuilding and refinement using the programs Coot49 and PHENIX50. Protein-protein interactions were analyzed by visual inspection in Coot and with PISA51.
IL-2-induced pSTAT5 assay.
Splenocytes from C57BL/6 (B6) mice expressing GFP under control of the FoxP3 promoter were collected, processed to a single-cell suspension and resuspended in RPMI 0.1% BSA. Cells were rested at 37°C in a tissue culture incubator until the time of assay (1–2 h).
PBMCs were purified from human Trima residuals (Blood Centers of the Pacific) and resuspended in RPMI 0.1% BSA. In some experiments, specific subpopulations were purified using magnetic isolation kits (Stemcell Technologies). Cells were rested at 37°C in a tissue culture incubator until the time of assay (1–2 h). PBMCs or splenocytes were plated in a 96-well V-bottom plate, such that 1 million cells (or 50,000 purified subpopulations) were in each well, in a volume of 50 μl (RPMI, 0.1% BSA). The plate was returned to the 37°C incubator to maintain the temperature. The antibody JES6–1A12 or anti-human IL-2 was pre-complexed with mouse or human IL-2, respectively, in RPMI 0.1% BSA for 1 h at 37°C at 2× the final concentration. IL-2 was tested at different concentrations: 33, 3.3, 0.33 and 0.03 nM in some experiments, and 33, 1.32 and 0.05 nM in others. An equal volume (50 μl) of 2× antibody−IL-2 complexes was added to wells, and the cells were cultured in the 37°C incubator for 40 min. Cells were fixed by the addition of 100 μl of IC fix buffer (eBioscience). After 15 min of fixation, cells were washed and stored in FACS buffer (PBS + 0.2%BSA) until staining.
Assay plates were centrifuged to pellet cells, and permeabilization buffer III (BD Biosciences) was used to resuspend cells, followed by 30 min incubation on ice. Cells were washed 2× in FACS buffer, and stained with the following antibodies for PBMCs: anti-human CD3 APC-ef780, CD4 PerCp-ef710, CD127 PE, CD8 FITC, CD25 PE-Cy7, FoxP3 ef660 and pSTAT5 Pacific Blue. For splenocytes, the following anti-mouse antibodies were used: CD4 ef660 and CD8 PE-Cy7. pSTAT5 Pacific Blue was used for both mouse and human cells. Data were collected on LSR Fortessa, and analyzed using FlowJo software. Data are plotted as background-subtracted MFI, normalized to the maximum signal for each cell type (IL-2 500 ng ml−1 + isotype). Background is defined as pSTAT5 MFI in non-stimulated, but stained cells. Human Tregs are defined as CD3+CD8–CD4+CD25highCD127low. Mouse Tregs are defined as CD8–CD4+FoxP3.GFP+ cells. All FACs antibodies were used at a 1:50 dilution.
In vitro PBMCs assay with F5111.2−hIL-2.
Human PBMCs were plated (150,000 cells per well) in complete (penicillin/streptomycin, sodium pyruvate and NEAA) RPMI containing 10% HS. Then, 2× IL-2−antibody complexes were formed at 37°C, and added to cells. For assay of IL-2-induced protein expression, cells were collected at 48 h and stained for flow cytometry analysis. For assay of IL-2-induced protein expression following TCR stimulation, cells were stimulated at the time of culture with soluble anti-CD3 (0.5 μg ml−1) and anti-CD28 (1 μg ml−1) and cells were collected on day 5 of culture. FACs antibodies used include: CD49d BUV737, CD8 APC-H7, CD26 PE, FoxP3 Al647, CD3 PE-Cy7, CD4 PerCp-ef710 and CD25 FITC. All FACs antibodies were used at a 1:50 dilution.
NSG expansion model and human IL-2 complex treatment in vivo.
PBMCs were isolated from healthy donors by Ficoll and activated overnight with 12.5 ng ml−1 anti-CD3 and 25 ng ml−1 anti-CD28. After an overnight incubation, cells were collected and labeled with CTV (Life Technologies) at the concentration of 1 μl CTV per 10 × 106 cells. After the staining, the cells were extensively washed in PBS and resuspended at the concentration of 30 × 106 cells in 200 μl of PBS. PBMCs were injected intravenously into 12-week-old NSG recipients. Antibody−IL-2 complexes were formed by incubating isotype or anti-IL-2 antibody, at the concentrations indicated, with 8,000 U human IL-2 (Proleukin) for 30 min at 37°C. The NSG mice injected with human PBMCs received an intraperitoneal injection daily for five days of antibody−IL-2 complexes. Mice were pre-randomized for study group.
Isolation of splenocytes and cell staining.
Mice were euthanized with CO2 and splenocytes were collected and stained extracellularly with anti-human CD45 V500, CD4 PerCp-Cy 5.5, CD3 PE-Cy7, CD3 Pacific Blue, CD25 APC-Cy7, CD39 PE-Cy7, CD8 APC-H7, Ki67 PE, NKG2D PE-Cy7 and CD44 V450, and intracellularly with anti-human Helios FITC and FoxP3 APC. FoxP3 buffer kit (eBioscience) was used for fixation and permeabilization, as per the manufacturer’s instructions, before intracellular staining. Labeled antibodies were purchased from BD PharMingen or eBioscience. Stained single-cell suspensions were analyzed using a Fortessa flow cytometer running FACSDiva (BD Biosciences) and FSC 3.0 files were analyzed and presented with FLOWJO Software.
In vitro suppression assay.
Twenty-two-week-old NOD mice were treated daily for five days with PBS, 8,000 U hIL-2 (Proleukin) complexed with 125 μg of the isotype or 125 μg of F5111.2. Spleens were collected at day 7 and Tregs and naive Teffs were sorted. Tregs were identified as CD4+CD25+CD62L+ cells while naive Teffs were gated on CD4+CD25–CD62L+. Monoclonal antibodies used for sorting were as follows: CD4 FITC, CD62L Al647 and CD25 PE-Cy7.
The purity of Tregs was assessed using intracellular staining with FoxP3 immediately after sorting (>95%). Naive Teffs were CTV-labeled as previously described. Antigen-presenting cells (APCs) were irradiated at 2,000 total rads. Cells were all resuspended at the concentration of 1 × 10⁶ cells ml−1 and 1 μg ml−1 of anti-CD3 (145–2C11) was added to the culture. For each cell type, 5 × 10⁴ cells were plated in triplicate in a 96-well U-bottom plate. Different ratios of Treg/Teff were used. Teff proliferation was assessed at day 4 by analyzing CTV-positive cells and the percentage of suppression was calculated as: Suppression (%) =100 − (proliferated cells/responders alone) x100. Data were analyzed with FLOWJO software.
Cytokine staining in NOD mice after treatment.
Twenty-two-week-old NOD mice were treated daily for 5 days with 8,000 U hIL-2 (Proleukin) complexed with 125 μg of the isotype or 125 μg of F5111.2. Spleens were collected at day 7 and cells were stimulated with phorbol 12-myristate-13-acetate (10 ng ml−1), ionomycin (0.5 μM) and brefeldin A (3 μg ml−1) for 4 h. After stimulation, cells were stained extracellularly with: Viability Dye UV, CD45 BUV 395, CD3 BUV737, CD4 BV605, CD8 APC-Cy7, CD25 PE-Cy7, CD39 PerCp-ef710, ICOS PerCp-Cy5.5, and intracellularly with IFNγ ef450, IL-2 APC, CTLA-4 PE, IL-10 APC and FoxP3 FITC.
Cytokine staining in NSG mice after treatment.
PBMCs were isolated from healthy donors by Ficoll and activated overnight with 12.5 ng ml−1 anti-CD3 and 25 ng ml−1 anti-CD28. After an overnight incubation, cells were collected and resuspended at the concentration of 30 × 106 cells in 200 μl of PBS. PBMCs were injected intravenously into 12-week-old NSG recipients. Mice were treated daily for 5 days with PBS, 25,000 U hIL-2 (Proleukin), 8,000 U hIL-2 complexed with 25 μg of the isotype or 25 μg of F5111.2. Spleens were collected at day 5 and cells were stimulated with phorbol 12-myristate-13-acetate (10 ng ml−1), ionomycin (0.5 μM) and brefeldin A (3 μgml−1) for 4 h. After stimulation, cells were stained extracellularly with: Viability Dye UV (Invitrogen), CD45 V500, CD4 BUV395, NKG2D PE-Cy7, CD8 PerCp-ef710, CD107a PE, CXCR3 PerCp-Cy5.5, CCR6 PE- Cy7, CCR4 BV786, and intracellularly with: Helios FITC, FoxP3 APC, CTLA4 PE- Cy7, IL-10 PE, IL-2 BV650, IFNγ V450, granzyme B A1647,RORγ Al488, IL-17A BV786, Tbet PE, IL-4 APC-Cy7 and GATA3 Al647.
Diabetes remission following treatment with antibody-IL-2 complexes.
Spontaneous new-onset diabetic NOD mice (14–24-week-old mice with one blood glucose concentration between 250 and 350 mg dl−1) were treated daily for 5 days with 8,000 U hIL-2 (Proleukin) complexed with 125 μg of the isotype or 125 μg of F5111.2, or with 0.5 μg mIL-2 (eBioscience) complexed with 5 μg of JES6–1 (eBioscience). Blood glucose concentrations were monitored over time.
After one week of remission, some mice were euthanized and the pancreas was analyzed. Whole pancreas was prepared by digesting for 30 min at 37°C with 0.8 mg ml−1 collagenase P and 20 μg ml−1 DNase (Roche) followed by mincing. After digestion, the homogenate was filtered twice by using a 40 μm cell strainer and stained extracellularly with CD45 PerCp-Cy5.5, CD25 PE, CD4 PE-Cy7, CD8 Al647 and Thy1.2 BV605 and intracellularly with FoxP3 FITC. Stained single-cell suspensions were analyzed and presented with FLOWJO software. Mice were pre-randomized for study group.
Induction of EAE and antibody-IL-2 complex treatment.
C57BL/6 mice at 8 weeks of age were immunized subcutaneously with 100 μl of emulsified CFA (BD Difco) supplemented with 4 mg ml−1 Mycobacterium tuberculosis H37Ra (BD Difco) and 200 μg MOG35–55 peptide (MEVGWYRSPFSRVVHLYRNGK, Genemed Synthesis) and received intraperitoneal injections of 200 ng pertussis toxin from Bordetella pertussis (Sigma Aldrich) at the time of immunization and 48 h later. Disease score was assessed by the scoring of ascending hind-limb paralysis as follows: no signs, score 0; flaccid tail, score 1; hind-limb weakness, score 2; partial hind-limb paralysis, score 3; complete hind-limb paralysis, score 4; and moribund mouse, score 540. Mice received an intraperitoneal injection for 5 consecutive days of PBS, 25,000 U of hIL-2 (Proleukin) pre-complexed with 50 μg of the isotype or F5111.2 for 30 min at 37 °C.
Xeno-GvHD model in NSG mice.
NSG recipient mice (14- to 15- week-old) received an intravenous injection of 30 × 106 PBMCs that had been activated overnight with 12.5 ng ml−1 anti-CD3 and 25 ng ml−1 anti-CD28. The mice received an intraperitoneal injection for 5 consecutive days of PBS, 25,000 U of hIL-2 (Proleukin) and 8,000 U of hIL-2 pre-complexed with 25 μg of the isotype or F5111.2 for 30 min at 37 °C. Mice were monitored for weight loss and survival for 40 days. Body weight loss higher than 25% of initial weight resulted in euthanasia.
MCMV infection.
C57BL/6 mice at 8 weeks of age were infected with 103 pfu of the MCMV Smith strain derived from mouse salivary gland tissue by intraperitoneal injection. For MCMV quantification, DNA was isolated from splenocytes with a ReliaPrep Blood gDNA Miniprep System kit (Promega), and the relative copy numbers of MCMV IE1 were determined by quantitative PCR analysis with SYBR green master mix reagent (Invitrogen). Viral titers were recorded as copies per milligram of spleen. Quantitative PCRs run using standard conditions and the following primer pair: MCMV-IE1_Forward— 5ʹ-AGCCACCAACATTGACCACGCAC-3ʹ and MCMV-IE1_Reverse— 5ʹ-GCCCCAACCAGGACA CACAACTC-3ʹ. Splenocytes were stained extracellularly with Viability Dye UV, Ly49H PE, NK1.1 PerCp-Cy5.5, NKG2D PE, NKG2D APC, CD4 ef450, CD3 BUV737, CD4 BV605, CD8 APC-Cy7 and CD25 PE-Cy7 and intracellularly with FoxP3 FITC. Stained single-cell suspensions were analyzed and presented with FLOWJO software. Mice were pre-randomized for study group.
Antibodies used for flow cytometry experiments.
The following antibodies were used when staining human cells: CD45 V500 (clone HI30, BD Biosciences, no. 560777, lot no. 4164991, 1:50), CD4 BUV395 (clone SK3, BD Biosciences, no. 564724, lot no. 7138963, 1:75), NKG2D PE-Cy7 (clone 1D11, BD Biosciences, no. 562365, lot no. B181349, 1:50), CD8 PerCp-ef710 (clone SK1, eBioscience, no. 46–0087-42, lot no. 4312449, 1:75), CD107a PE (clone H4A3, BD Biosciences, no. 555801, lot no. 3303846, 1:25), CXCR3 PerCp-Cy5.5 (clone G025H7, Biolegend, no. 353714, lot no. B186023, 1:50), CCR6 PE-Cy7 (clone 11A9, BD Biosciences, no. 560620, lot no. 7117549, 1:25), CCR4 BV786 (clone 1G1, BD Biosciences, no. 744141, lot no. 7165530, 1:25), Helios FITC (clone 22F6, Biolegend, no. 137214, lot no. B220728, 1:25), FoxP3 APC (clone 236 A/E7, eBioscience, no. 17–4777 - 42 lot no. 4289565, 1:25), CTLA4 PE-Cy7 (clone BNI3, Biolegend, no. 369613, lot no. B240087, 1:200), IL-10 PE (clone JES3–9D7, eBioscience, no. 12–7108-82, lot no. 4300423, 1:25), IL-2 BV650 (clone 5344.111, BD Biosciences, no. 563467, lot no. 563467, 1:50), IFNγ V450 (clone B27, BD Biosciences, no. 560372, lot no. 6105971, 1:50), granzyme B Al647 (clone GB11, Biolegend, no. 515405, lot no. B197353, 1:50), RORγ A1488 (clone Q21–559, BD Biosciences, no. 563621, lot no. 7104745, 1:50), IL-17A BV786 (clone N49–653, BD Biosciences, no. 563745, lot no. 7047992, 1:50), Tbet PE (clone O4–46, BD Biosciences, no. 561268, lot no. 6357734, 1:25), IL-4 APC-Cy7 (clone MP4–25D2, Biolegend, no. 500833, lot no. B216896, 1:50), GATA3 A1647 (clone 16E10A23, Biolegend, no. 653809, lot no. B229073, 1:25), CD4 PerCp-Cy 5.5 (clone RPA-T4, BD Biosciences, no. 560650, lot no. 5079644, 1:50), CD3 PE-Cy7 (clone UCHT1, eBioscience no. 25–0038-42, lot no. E09903–1632, 1:50), CD3 Pacific Blue (clone HIT3a, Biolegend lot no. B167782, 1:50), CD25 APC-Cy7 (clone M-A251, BD Biosciences, no. 561782, lot no. 4341633, 1:50), CD39 PE-Cy7 (clone A1, Biolegend, no. 328211, lot no. B179621, 1:50), CD8 APC-H7 (clone SK1, BD Biosciences, no. 560273, lot no. 5322835, 1:50), Ki67 PE (clone Ki-67, Biolegend, no. 350503, lot no. B180057, 1:50), CD44 V450 (clone G44–26, BD Biosciences, no. 561292, 1:50), CD25 FITC (clone 2A3, BD Biosciences, no. 347643, lot no. 3109585, 1:50), CD25 PE (clone 2A3, BD Biosciences, no. 341009, lot no. 4287539, 1:50), Helios PE (clone 22F6, Biolegend, no. 137206, lot no. B167503, 1:25), CD49d BUV737 (clone 9F10, BD Biosciences, no. 565296, lot no. 7170988, 1:50), CD26 PE (clone M-A261, BD Biosciences, no. 565158, lot no. 6084564, 1:50), FoxP3 A1647 (clone 236 A/E7, BD Biosciences, no. 561184, lot no. 6008731, 1:50), CD4 PerCp-ef710 (eBiosciences, no. 9046–0047 lot no. E1085–1634, 1:50), CD25 FITC (clone 7G7B6, Ancell, no. 174–040, lot no. 160808, 1:50), CD3 APC-ef780 (clone UCHT1, eBioscience, no. 47–0038, lot no. 4306345, 1:50), CD4 PerCp-ef710 (clone SK3, eBioscience, no. 46–0047, lot no. E1085–1634, 1:50), CD127 PE (clone eBioRDR5, eBioscience, no. 12–1278, lot no. 4324680, 1:50), CD8 FITC (clone HIT8a, BD Biosciences, no. 555634, lot no. 6195899, 1:50), CD25 PE-Cy7 (clone 2A3, BD Biosciences, no. 335807, lot no. 6347910, 1:50), FoxP3 ef660 (clone 236 A/E7, eBiosciences, no. 50–4777, lot no. E15615–102, 1:50) and pSTAT5 Pacific Blue (clone 47/Stat5(pY694), BD Biosciences, no. 560311, lot no. 7199791, 1:50).
The following antibodies were used when staining mouse cells: CD45 BUV 395 (clone 30-F11, BD Biosciences, no. 565967, lot no. 7317755, 1:500), CD3 BUV737 (clone 17A2, BD Biosciences, no. 564380, lot no. 7325647, 1:100), CD4 BV605 (clone RM4–5, Biolegend, no. 100547, lot no. B244808, 1:200), CD8 APC-Cy7 (clone 53–6.7, Biolegend, no. 100713, lot no. 7025872, 1:200), CD25 PE-Cy7 (clone PC61.5, eBioscience, no. 25–0251-82, lot no. 4323751, 1:100), CD39 PerCp-ef710 (clone 24DMS1, eBioscience, no. 46–0391-82, lot no. E13806–1634, 1:200), ICOS PerCp-Cy5.5 (clone C398.4 A, Biolegend, no. 313517, lot no. B237032, 1:100), IFNγ ef450 (clone XMG-1.2, eBioscience, no. 48–7311-82, lot no. E10946–1634, 1:200), IL-2 APC (clone JES6–5H4, eBioscience, no. 17–7021-82, lot no. 4277774, 1:200), CTLA-4 PE (clone UC10–4F10–11, BD Biosciences, no. 561718, lot no. 5104610, 1:400), IL-10 APC (clone JES5–16E3, eBioscience, no. 17–7101-82, lot no. 4300020, 1:50), FoxP3 FITC (clone FJK-16s, eBioscience, no. 11–5773-82, lot no. 4307321, 1:100), CD4 FITC (clone GK1.5, eBioscience, no. 11–0041-82, lot no. B245891, 1:200), CD62L Al647 (clone MEL-14, UCSF Antibody Core, lot no. MC13106, 1:200), CD45 PerCp-Cy5.5 (clone 30-F11, eBioscience, no. 45–0451-82, lot no. B169995, 1:200), CD25 PE (clone PC61.5, eBioscience, no. 12–0251-82, lot no. E01155–1633, 1:200), CD4 PE-Cy7 (clone RMA-5, eBioscience, no. 25–0042-82, lot no. E07503–1631, 1:200), CD8 Al647 (clone YTS169.4, UCSF Antibody Core, lot no. MC09033, 1:200), Thy1.2 BV605 (clone 53–2.1, Biolegend, no. 140317, lot no. B179968, 1:400), Ly49H PE (clone 3D10, Biolegend, no. 144705, lot no. B160455, 1:100), NK1.1 PerCp-Cy5.5 (clone PK136, Biolegend, no. 108727, lot no. B168826, 1:100), NKG2D PE (clone CX5, eBioscience, no. 12–5882-82, lot no. E01869–1634, 1:100), NKG2D APC (clone CX5, Biolegend, no. 130211, lot no. B147572, 1:100), CD4 ef660 (clone GK1.5, eBioscience, no. 50–0041, lot no. E12184–1635, 1:50), CD8 PE-Cy7 (clone 53–6.7, eBioscience, no. 25–0081, lot no. 4189800, 1:50) and pSTAT5 Pacific Blue (clone 47/Stat5(pY694), BD Biosciences, no. 560311, lot no. 7199791, 1:50).
Study approval.
Research was conducted on human blood acquired in accordance with all applicable Pfizer policies, including IRB/IEC approval. All procedures performed on these animals were in accordance with regulations and established guidelines and were reviewed and approved by a UCSF Institutional Animal Care and Use Committee or through an ethical review process. All healthy donors were included in the analysis. No exclusion, inclusion or blinding criteria were used for samples used for in vitro assay or animal studies.
Statistical analysis.
All statistical calculations were performed using GraphPad Prism. For in vitro experiments, P values were determined using one-way analysis of variance (ANOVA; Dunnett’s multiple comparison) or two-tailed paired Student’s t-test where indicated. Data are presented as the mean ± s.d. of duplicate wells, except for Fig. 2c,d, where multiple IL-2 concentrations were tested in parallel, the experiment size required singlicate wells, and are representative of at least three donors. For in vivo experiments, P values were determined using either one-way ANOVA (Dunnett’s multiple comparison), two-way ANOVA (Dunnett’s multiple comparison), two-tailed unpaired Student’s t-test or the Mantel-Cox test. Mouse studies included at least four mice per group and the results were presented as the mean ± s.d. Data are representative of at least two independent experiments unless otherwise noted. *P ≤ 0.05, **P ≤ 0.01, ***P ≤ 0.001, ****P ≤ 0.0001.
Supplementary Material
Acknowledgements
We thank Pfizer for funding this study and participating in experiments and discussion, and the entire laboratory of J.A.B. and members of the laboratory of K.C.G. for support. In particular, we thank F. Van Gool and M. DuPage from the Bluestone laboratory for insightful discussions, D. Samuel from CTI-Pfizer for antibodies and protein preparation and UCSF Flow Core for its excellent technical assistance. We would also like to thank all of the healthy donors involved in this study.
Footnotes
Competing interests
CTI-Pfizer funded this study. E.T., P.H.B., L.K.E., N.K.C., J.A.B. and I.J.R. are co-inventors on a patent application filed by CTI-Pfizer and UCSF incorporating discoveries described in the manuscript.
Additional information
Supplementary information is available for this paper at https://doi.org/10.1038/s41591–018-0070–2.
Reprints and permissions information is available at www.nature.com/reprints.
Correspondence and requests for materials should be addressed to J.A.B.
Publisher’s note: Springer Nature remains neutral with regard to jurisdictional claims in published maps and institutional affiliations.
Reporting Summary. Further information on experimental design is available in the Nature Research Reporting Summary linked to this article.
Data availability. All data generated or analyzed during this study are included in this published article and its Supplementary Information files. The crystallographic reflections and model have been deposited in the Protein Data Bank with accession code 5UTZ. Diffraction images have been deposited in the SBGrid Data Bank (https://doi.org/10.15785/SBGRID/424). Antibody sequences are available at UCSF upon reasonable request from J.A.B. (jeff.bluestone@ucsf.edu).
Methods
Methods, including statements of data availability and any associated accession codes and references, are available at https://doi.org/10.1038/s41591–018-0070–2.
References
- 1.Morgan DA, Ruscetti FW & Gallo R Selective in vitro growth of T lymphocytes from normal human bone marrows. Science 193, 1007–1008 (1976). [DOI] [PubMed] [Google Scholar]
- 2.Boyman O & Sprent J The role of interleukin-2 during homeostasis and activation of the immune system. Nat. Rev. Immunol. 12, 180–190 (2012). [DOI] [PubMed] [Google Scholar]
- 3.Liao W, Lin J-X & Leonard WJ Interleukin-2 at the crossroads of effector responses, tolerance, and immunotherapy. Immunity 38, 13–25 (2013). [DOI] [PMC free article] [PubMed] [Google Scholar]
- 4.Malek TR & Castro I Interleukin-2 receptor signaling: at the interface between tolerance and immunity. Immunity 33, 153–165 (2010). [DOI] [PMC free article] [PubMed] [Google Scholar]
- 5.Sakaguchi S, Sakaguchi N, Asano M, Itoh M & Toda M Immunologic self-tolerance maintained by activated T cells expressing IL-2 receptor alpha-chains (CD25). Breakdown of a single mechanism of self-tolerance causes various autoimmune diseases. J. Immunol. 155, 1151–1164 (1995). [PubMed] [Google Scholar]
- 6.Roediger B et al. Cutaneous immunosurveillance and regulation of inflammation by group 2 innate lymphoid cells. Nat. Immunol. 14, 564–573 (2013). [DOI] [PMC free article] [PubMed] [Google Scholar]
- 7.Taniguchi T The IL-2/IL-2 receptor system: A current overview. Cell 73, 5–8 (1993). [DOI] [PubMed] [Google Scholar]
- 8.Arkin MR et al. Binding of small molecules to an adaptive protein-protein interface. Proc. Natl Acad. Sci. USA 100, 1603–1608 (2003). [DOI] [PMC free article] [PubMed] [Google Scholar]
- 9.Rickert M, Wang X, Boulanger MJ, Goriatcheva N & Garcia KC The structure of interleukin-2 complexed with its alpha receptor. Science 308, 1477–1480 (2005). [DOI] [PubMed] [Google Scholar]
- 10.Rosenberg SA IL-2: the first effective immunotherapy for human cancer. J. Immunol. 192, 5451–5458 (2014). [DOI] [PMC free article] [PubMed] [Google Scholar]
- 11.Yu A, Zhu L, Altman NH & Malek TR A low interleukin-2 receptor signaling threshold supports the development and homeostasis of T regulatory cells. Immunity 30, 204–217 (2009). [DOI] [PMC free article] [PubMed] [Google Scholar]
- 12.Brusko TM, Putnam AL & Bluestone JA Human regulatory T cells: role in autoimmune disease and therapeutic opportunities. Immunol. Rev. 223, 371–390 (2008). [DOI] [PubMed] [Google Scholar]
- 13.Malek TR, Yu A, Vincek V, Scibelli P & Kong L CD4 regulatory T cells prevent lethal autoimmunity in IL-2Rβ-deficient mice. Immunity 17, 167–178 (2002). [DOI] [PubMed] [Google Scholar]
- 14.London NR et al. Targeting Robo4-dependent Slit signaling to survive the cytokine storm in sepsis and influenza. Sci. Transl. Med. 2, 23ra19 (2010). [DOI] [PMC free article] [PubMed] [Google Scholar]
- 15.Ferrara JLM Cytokine dysregulation as a mechanism of graft versus host disease. Curr. Opin. Immunology 5, 794–799 (1993). [DOI] [PubMed] [Google Scholar]
- 16.Saadoun D et al. Regulatory T-cell responses to low-dose interleukin-2 in HCV-induced vasculitis. N. Engl. J. Med. 370, 786–786 (2014). [DOI] [PubMed] [Google Scholar]
- 17.Yu A et al. Selective IL-2 responsiveness of regulatory T cells through multiple intrinsic mechanisms support the use of low-dose IL-2 therapy in Type-1 diabetes. Diabetes 64, 2172–2183 (2015). [DOI] [PubMed] [Google Scholar]
- 18.He J et al. Low-dose interleukin-2 treatment selectively modulates CD4+ T cell subsets in patients with systemic lupus erythematosus. Nat. Med. 22, 991–993 (2016). [DOI] [PubMed] [Google Scholar]
- 19.Koreth J et al. Interleukin-2 and regulatory T cells in graft-versus-host disease. N. Engl. J. Med. 365, 2055–2066 (2011). [DOI] [PMC free article] [PubMed] [Google Scholar]
- 20.Von Spee-Mayer C et al. Low-dose interleukin-2 selectively corrects regulatory T cell defects in patients with systemic lupus erythematosus. Ann. Rheum. Dis. 75, 1407–1415 (2016). [DOI] [PubMed] [Google Scholar]
- 21.Hartemann A et al. Low-dose interleukin 2 in patients with type 1 diabetes: a phase 1/2 randomised, double-blind, placebo-controlled trial. Lancet Diabetes Endocrinol. 1, 295–305 (2013). [DOI] [PubMed] [Google Scholar]
- 22.Matsuoka K-I et al. Low-dose interleukin-2 therapy restores regulatory T cell homeostasis in patients with chronic graft-versus-host disease. Sci. Transl. Med. 5, 179ra43 (2013). [DOI] [PMC free article] [PubMed] [Google Scholar]
- 23.Arenas-Ramirez N, Woytschak J & Boyman O Interleukin-2: biology, design and application. Trends Immunol. 36, 763–777 (2015). [DOI] [PubMed] [Google Scholar]
- 24.Long SA et al. Rapamycin/IL-2 combination therapy in patients with type 1 diabetes augments Tregs yet transiently impairs (β-cell function. Diabetes 61, 2340–2348 (2012). [DOI] [PMC free article] [PubMed] [Google Scholar]
- 25.Levin AM et al. Exploiting a natural conformational switch to engineer an interleukin-2 ‘superkine’. Nature 484, 529–533 (2012). [DOI] [PMC free article] [PubMed] [Google Scholar]
- 26.Boyman O, Kovar M, Rubinstein MP, Surh CD & Sprent J Selective stimulation of T cell subsets with antibody-cytokine immune complexes. Science 311, 1924–1927 (2006). [DOI] [PubMed] [Google Scholar]
- 27.Mitra S et al. Interleukin-2 activity can be fine tuned with engineered receptor signaling clamps. Immunity 42, 826–838 (2015). [DOI] [PMC free article] [PubMed] [Google Scholar]
- 28.Arenas-Ramirez N et al. Improved cancer immunotherapy by a CD25- mimobody conferring selectivity to human interleukin-2. Sci. Transl. Med. 8, 367ra166 (2016). [DOI] [PubMed] [Google Scholar]
- 29.Yang JC et al. The use of polyethylene glycol-modified interleukin-2 (PEG-IL-2) in the treatment of patients with metastatic renal cell carcinoma and melanoma. A phase I study and a randomized prospective study comparing IL-2 alone versus IL-2 combined with PEG-IL-2. Cancer 76, 687–694 (1995). [DOI] [PubMed] [Google Scholar]
- 30.Wu K et al. Short-term intratracheal use of PEG-modified IL-2 and glucocorticoid persistently alleviates asthma in a mouse model. Sci. Rep. 6, 31562 (2016). [DOI] [PMC free article] [PubMed] [Google Scholar]
- 31.Jafari R, Zolbanin NM, Rafatpanah H, Majidi J & Kazemi T Fc-fusion proteins in therapy: an updated view. Curr. Med. Chem. 24, 1228–1237 (2017). [DOI] [PubMed] [Google Scholar]
- 32.Finkelman FD et al. Anti-cytokine antibodies as carrier proteins. Prolongation of in vivo effects of exogenous cytokines by injection of cytokine-anti-cytokine antibody complexes. J. Immunol. 151, 1235–1244 (1993). [PubMed] [Google Scholar]
- 33.Spangler JB et al. Antibodies to interleukin-2 elicit selective T cell subset potentiation through distinct conformational mechanisms. Immunity 42, 815–825 (2015). [DOI] [PMC free article] [PubMed] [Google Scholar]
- 34.Tang Q et al. Central role of defective interleukin-2 production in the triggering of islet autoimmune destruction. Immunity 28, 687–697 (2008). [DOI] [PMC free article] [PubMed] [Google Scholar]
- 35.Putnam AL et al. Expansion of human regulatory T-cells from patients with type 1 diabetes. Diabetes 58, 652–662 (2009). [DOI] [PMC free article] [PubMed] [Google Scholar]
- 36.Grinberg-Bleyer Y et al. IL-2 reverses established type 1 diabetes in NOD mice by a local effect on pancreatic regulatory T cells. J. Exp. Med. 207, 1871–1878 (2010). [DOI] [PMC free article] [PubMed] [Google Scholar]
- 37.Hannon M et al. Infusion of clinical-grade enriched regulatory T cells delays experimental xenogeneic graft-versus-host disease. Transfusion 54, 353–363 (2014). [DOI] [PubMed] [Google Scholar]
- 38.Jamieson AM et al. The role of the NKG2D immunoreceptor in immune cell activation and natural killing. Immunity 17, 19–29 (2002). [DOI] [PubMed] [Google Scholar]
- 39.Brown MG et al. Vital involvement of a natural killer cell activation receptor in resistance to viral infection. Science 292, 934–937 (2001). [DOI] [PubMed] [Google Scholar]
- 40.Dokun AO et al. Specific and nonspecific NK cell activation during virus infection. Nat. Immunol. 2, 951–956 (2001). [DOI] [PubMed] [Google Scholar]
- 41.Krieg C, Letourneau S, Pantaleo G & Boyman O Improved IL-2 immunotherapy by selective stimulation of IL-2 receptors on lymphocytes and endothelial cells. Proc. Natl Acad. Sci. USA 107, 11906–11911 (2010). [DOI] [PMC free article] [PubMed] [Google Scholar]
- 42.Létourneau S et al. IL-2/anti-IL-2 antibody complexes show strong biological activity by avoiding interaction with IL-2 receptor alpha subunit CD25. Proc. Natl Acad. Sci. USA 107, 2171–2176 (2010). [DOI] [PMC free article] [PubMed] [Google Scholar]
- 43.Webster KE et al. In vivo expansion of T reg cells with IL-2-mAb complexes: induction of resistance to EAE and long-term acceptance of islet allografts without immunosuppression. J. Exp. Med. 206, 751–760 (2009). [DOI] [PMC free article] [PubMed] [Google Scholar]
- 44.Lee S-Y et al. Interleukin-2/anti-interleukin-2 monoclonal antibody immune complex suppresses collagen-induced arthritis in mice by fortifying interleukin-2/STAT5 signalling pathways. Immunology 137, 305–316 (2012). [DOI] [PMC free article] [PubMed] [Google Scholar]
- 45.Liu R et al. Expansion of regulatory T cells via IL-2/anti-IL-2 mAb complexes suppresses experimental myasthenia. Eur. J. Immunol. 40, 1577–1589 (2010). [DOI] [PMC free article] [PubMed] [Google Scholar]
- 46.Saadoun D et al. Regulatory T-cell responses to low-dose interleukin-2 in HCV-induced vasculitis. N. Engl. J. Med. 365, 2067–2077 (2011). [DOI] [PubMed] [Google Scholar]
- 47.McCoy AJ et al. Phaser crystallographic software. J. Appl. Crystallogr. 40, 658–674 (2007). [DOI] [PMC free article] [PubMed] [Google Scholar]
- 48.Wang X, Rickert M & Garcia KC Structure of the quaternary complex of interleukin-2 with its alpha, beta, and gammac receptors. Science 310, 1159–1163 (2005). [DOI] [PubMed] [Google Scholar]
- 49.Emsley P & Cowtan K Coot: model-building tools for molecular graphics. Acta Crystallogr. D 60, 2126–2132 (2004). [DOI] [PubMed] [Google Scholar]
- 50.Adams PD et al. The Phenix software for automated determination of macromolecular structures. Methods 55, 94–106 (2011). [DOI] [PMC free article] [PubMed] [Google Scholar]
- 51.Krissinel E & Henrick K Inference of macromolecular assemblies from crystalline state. J. Mol. Biol. 372, 774–797 (2007). [DOI] [PubMed] [Google Scholar]
Associated Data
This section collects any data citations, data availability statements, or supplementary materials included in this article.