

Abstract
The catalytic subunit p110δ of phosphoinositide 3‐kinase (PI3K) encoded by PIK3CD has been implicated in some human solid tumors. However, its roles in colorectal cancer (CRC) remain largely unknown. Here we found that PIK3CD was overexpressed in colon cancer tissues and CRC cell lines and was an independent predictor for overall survival (OS) of patients with colon cancer. The ectopic overexpression of PIK3CD significantly promoted CRC cell growth, migration and invasion in vitro and tumor growth in vivo. In contrast, inhibition of PIK3CD by specific small‐interfering RNA or idelalisib dramatically suppressed CRC cell growth, migration and invasion in vitro and tumor growth in vivo. Moreover, PIK3CD overexpression increased AKT activity, nuclear translocation of β‐catenin and T‐cell factor/lymphoid enhancer factor (TCF/LEF) transcriptional activity and decreased glycogen synthase kinase 3β (GSK‐3β) activity, whereas PIK3CD inhibition exhibited the opposite effects. Furthermore, PIK3CD‐mediated cell growth, migration and invasion were reversed by blockade of AKT signaling or depletion of β‐catenin. In addition, PIK3CD expression in colon cancer tissues positively correlated with β‐catenin abnormal expression, which was an independent predictor for OS of colon cancer patients. Taken together, our findings demonstrate that PIK3CD is an independent prognostic factor in CRC and that PIK3CD induces CRC cell growth, migration and invasion by activating AKT/GSK‐3β/β‐catenin signaling, suggesting that PIK3CD might be a novel prognostic biomarker and a potential therapeutic target for CRC.
Keywords: β‐catenin signaling; colorectal cancer; growth, invasion; PIK3CD
1. INTRODUCTION
Colorectal cancer (CRC) is the third most common malignancy in males and the second most common malignancy in females, and is the fourth leading cause of cancer‐related mortality in the world.1, 2 Despite recent advances in diagnosis and treatment, the prognosis of patients with CRC remains dismal. The genesis and development of CRC is a complex pathologic process involving many genes and pathways, thus, the molecular mechanisms of CRC progression are not well‐understood. Further insight into the molecular mechanisms underlying CRC progression might help identify novel therapeutic targets and consequently improve its prognosis.
Activation of phosphoinositide 3‐kinase (PI3K) signaling is one of the most frequent events in several human cancers, including CRC.3, 4, 5 PI3K, a family of lipid kinases, phosphorylate phosphatidylinositol 4,5‐bisphosphate (PIP2) to generate phosphatidylinositol‐3,4,5‐trisphosphate (PIP3), which in turn triggers a signaling cascade by activating serine‐threonine protein kinase AKT and its downstream effectors. PI3K are divided into 3 classes according to their substrate specificity and structures in mammals. Among them, class I PI3K seem to be the most relevant to human cancers. Class I PI3K are further divided into subclasses IA and IB based on their adaptors. Class IA PI3K comprise a p110 catalytic subunit and a p85 regulatory subunit. Class IA catalytic isoforms, p110α, p110β and p110δ, are encoded by genes PIK3CA, PIK3CB and PIK3CD, respectively. Accumulated evidence has demonstrated that p110 isoforms play critical roles in cell proliferation, migration and survival.3, 4, 6, 7, 8 PIK3CA is frequently mutated in human cancers, but mutations in other class IA catalytic isoforms are rare.3, 4 However, PIK3CB and PIK3CD are generally overexpressed or amplified in cancers.4 PIK3CD is primarily expressed in leukocytes and plays a critical role in some hematological malignancies.3, 4, 9 Furthermore, PIK3CD has recently been implicated in some human solid tumors, including hepatocellular carcinoma, glioma, glioblastoma, neuroblastoma and breast cancer.10, 11, 12, 13, 14 However, little is known about the roles and underlying molecular mechanisms of PIK3CD in CRC.
In this study, we found that PIK3CD was overexpressed and an independent prognostic factor in colon cancer patients. Furthermore, our results demonstrated that PIK3CD induced cell growth and invasion by the activating AKT/GSK‐3β/β‐catenin pathway in CRC.
2. MATERIALS AND METHODS
2.1. Human tissue specimens
The present study included 153 patients who underwent surgery for colon cancer in the First Affiliated Hospital of Guangzhou Medical University (Guangzhou, China) from January 2009 to December 2011. None of these patients had received chemotherapy or radiotherapy before surgery. Colon cancer and matched adjacent normal tissue specimens (not less than 2 cm away from the cancer) were obtained from all patients after resection and embedded in paraffin. All specimens were histopathologically confirmed. All patients were staged according to the 7th edition of the American Joint Committee on Cancer (AJCC) TNM staging system. These patients were followed after surgery until April 2017, with a median follow up of 66 months (range, 1–91 months). In addition, 8 surgical specimens (both tumor and adjacent normal tissue) from colon cancer patients were collected immediately after surgery and stored at −80°C for later RNA and protein extraction. Informed consent was obtained from all patients before surgery. The present study was approved by the Ethics Committees of our institute.
2.2. Cell culture
Normal human colon epithelial cell line (NCM460) and human CRC cell lines (HT‐29, HCT‐15, LoVo, SW480, DLD‐1, HCT‐8 and HCT‐116) were maintained in DMEM (Gibco, Grand Island, NY, USA) supplemented with 10% FBS (Hyclone, USA) and 1% penicillin/streptomycin in a humidified incubator with 5% CO2 at 37°C.
2.3. Real‐time PCR
Total RNA was isolated using TRIzol Reagent (Invitrogen, Carlsbad, CA, USA) according to the manufacturer's instructions. The complementary DNA was synthesized and real‐time PCR was performed as described previously.15, 16, 17, 18 The primers for human PIK3CD (forward primer: 5′‐CATATGTGCTGGGCATTGGC‐ 3′, reverse primer: 5′‐TTTCACAGTAGCCCCGGAAC‐3′), β‐catenin (forward primer: 5′‐AACTTGCCACACGTGCAATC‐3′, reverse primer: 5′‐AGGTTATGCAAGGTCCCAGC‐3′) and glyceraldehyde‐3‐phosphate dehydrogenase (GAPDH) (forward primer: 5′‐GAGTCAACGGATTTGGTCGT‐ 3′, reverse primer: 5′‐GACAAGCTTCCCGTTCTCAG‐3′) were used for the real‐time PCR. The amplification reactions were performed under the following conditions: 1 cycle at 95°C for 3 minutes, followed by 40 cycles at 95°C for 15 seconds, and 60°C for 30 seconds.
2.4. Western blot
Western blot was performed as previously described.16, 17, 18 Cytoplasmic and nuclear protein fractions were extracted from cells using NE‐PER Nuclear and Cytoplasmic Extraction Reagents (Pierce, Rockford, IL, USA) according to the manufacturer's protocol. The primary antibodies included PIK3CD (Santa Cruz Biotechnology, Santa Cruz, CA, USA, 1:1000), AKT (Cell Signaling Technology, Beverly, MA, USA, 1:1000), phosphorylated (phospho)‐AKT (Ser473) (Cell Signaling Technology, 1:500), glycogen synthase kinase (GSK)‐3β (Cell Signaling Technology, 1:1000), phospho‐GSK‐3β (Ser9) (Cell Signaling Technology, 1:1000), β‐catenin (Cell Signaling Technology, 1:1000), phospho‐β‐catenin (Ser33/37/Thr41) (Cell Signaling Technology, 1:1000), C‐myc (Abcam, Cambridge, MA, USA, 1:1000), CyclinD1 (Abcam, 1:5000), GAPDH (Santa Cruz, 1:2000) and Histone 3 (Cell Signaling Technology, 1:2000). GAPDH or Histone 3 was used as a loading control.
2.5. Immunohistochemistry
Immunohistochemistry was performed on the 4 μm‐thick paraffin‐embedded tissue sections as previously described.15, 16, 17, 18 The specific antibodies against PIK3CD (Santa Cruz Biotechnology, 1:50), β‐catenin (Santa Cruz Biotechnology, 1:200), phospho‐β‐catenin (Abcam, 1:50), C‐myc (Abcam, 1:50) and CyclinD1 (Abcam, 1:100) were used. For level of PIK3CD, negative expression was defined as no staining or weak staining in the cells, whereas positive expression was defined as distinct or strong staining in >20% of cells.19, 20 The staining of β‐catenin was classified into normal expression and abnormal expression. Detection of β‐catenin staining on membrane of >70% of cells was regarded as normal expression, while detection of β‐catenin staining in cytoplasm or nuclei of >10% of cells was considered abnormal expression.21, 22
2.6. Lentivirus production and transduction
PIK3CD‐overexpressing lentivirus was generated and infected as described previously.17 In brief, the PIK3CD sequences were amplified and cloned into the pLV3 vector (GeneChem, Shanghai, China). Subsequently, the lentiviral plasmids were transfected into HEK293T cells and the lentivirus‐containing medium was collected. Then, CRC cells infected with the viral supernatant were selected to obtain cells stably expressing the constructs.
2.7. Small interfering RNA transfection
The sense strand sequences of small interfering RNA (siRNA) used to knock down PIK3CD expression were 5′‐GCGCCAAGATGTGCCAATT‐3′ (PIK3CD siRNA‐1), 5′‐GCAACGAGATGCTGTGCAA‐3′ (PIK3CD siRNA‐2) and 5′‐GCGCCAAGAUGUGCCAAUUTT‐3′ (PIK3CD siRNA‐3). The sense strand sequences of siRNA targeting β‐catenin were: 5′‐AGCTGATATTGATGGACAG‐3′ (β‐catenin siRNA‐1) and 5′‐CAGTTGTGGTTAAGCTCTT‐3′ (β‐catenin siRNA‐2). The siRNA duplexes and negative control (NC) (scrambled siRNA) were synthesized and purified by Ribobio (Guangzhou, China). siRNA transfection was performed using Lipofectamine 2000 (Invitrogen) according to the manufacturer's instructions as described previously.17, 18
2.8. Cell viability, wound healing, migration and invasion assays
Cell viability was assessed by 3‐[4,5‐dimethylthiazol‐2‐yl]‐2, 5‐diphenyltetrazoliumbromide (MTT) assay and cell motility was measured using a wound healing assay, as previously described.16, 17, 18 Cell migration and invasion assays were performed using Transwell chambers (Costar; Corning) without or with coated Matrigel (BD Biosciences, San Jose, CA, USA), as previously described.16, 17, 18
2.9. Colony formation assay
Cells (4 × 10²) were plated into 6‐well plates with DMEM with 10% FBS. After 2 weeks of culture, the cells were fixed with 4% formaldehyde and stained with 0.5% crystal violet. The number of colonies (>50 cells/colony) was counted under a microscope.
2.10. Luciferase reporter assay
Cells were seeded into 24‐well plates and cultured in a humidified incubator for 24 hours. The cells were transiently cotransfected with .4 μg of wild‐type T cell factor (TCF) reporter plasmid TOPFlash (Upstate Biotechnology, Lake Placid, NY, USA) or mutated TCF reporter plasmid FOPflash (Upstate Biotechnology, Lake Placid, NY, USA), Renilla plasmids and .4 μg of PIK3CD overexpressing effector plasmid or indicated siRNA or NC using Lipofectamine 2000 (Invitrogen, Carlsbad, CA, USA). Forty‐eight hours after transfection, the cells were lysed and relative luciferase activities in cell lysates were determined using the Dual‐Luciferase Reporter Assay System (Promega, Madison, WI, USA) according to the manufacturer's instructions.
2.11. Xenograft model in nude mice
HCT‐15 cells stably expressing PIK3CD (HCT‐15‐PIK3CD) and HCT‐15 cells stably expressing vector (HCT‐15‐Vector) (5 × 10⁶) were injected subcutaneously into the right flank of male Balb/C nude mice (6‐week old), respectively. All mice were housed under specific pathogen‐free conditions. Tumor size was measured every week using a slide caliper and tumor volume was calculated using the formula: tumor volume (mm3) = length × width2 × .5. After 4 weeks, all mice were killed and the tumors were excised, weighted, fixed in formalin and embedded in paraffin. In addition, HCT‐116 cells (5 × 10⁶) were injected subcutaneously into the right flank of male Balb/C nude mice. One week after inoculation, the mice were orally administered vehicle DMSO (80 mg/mL, Vehicle group) or idelalisib (30 mg/kg/d) (Selleck Chemicals, Houston, TX, USA) for 10 days. Four weeks after inoculation, the tumors were removed, weighted, fixed and embedded. The 4‐μm‐thick sections from all tumors were prepared for immunohistochemical analysis and stained with hematoxylin. Animal experiments were approved by the Animal Experimentation Ethics Committee and performed in accordance with ethical guidelines for animal experimentation.
2.12. Statistical analysis
Statistical analyses were carried out using SPSS 13.0 software (SPSS, Chicago, IL, USA). The association between PIK3CD or β‐catenin expression and clinicopathological parameters was evaluated using the χ2 test or Fisher's exact test. The correlation between the PIK3CD expression and β‐catenin expression in colon cancer patients was determined using the Spearman correlation test. Survival curves were plotted using the Kaplan‐Meier method and compared by log‐rank test. Multivariate analysis was performed using the Cox proportional hazard model. Data for continuous variables were presented as mean ± SD and differences between groups were compared using ANOVA or Student's t test. P ≤ .05 was considered statistically significant.
3. RESULTS
3.1. Overexpression of PIK3CD was significantly correlated with distant metastasis and poor prognosis in human colon cancer
We first examined PIK3CD expression in human colon epithelial cell line NCM460, human CRC cell lines (HT29, HCT‐15, LOVO, SW480, DLD‐1, HCT‐8 and HCT‐116) and the specimens from 8 patients with colon cancer. The results showed that PIK3CD mRNA and protein expression levels were significantly upregulated in CRC cell lines compared with NCM460 cells (Figure 1A,B). Moreover, PIK3CD mRNA and protein expression levels in colon cancer tissues were higher than those in the matched adjacent normal tissues (P < .01) (Figure 1C,D).
Figure 1.
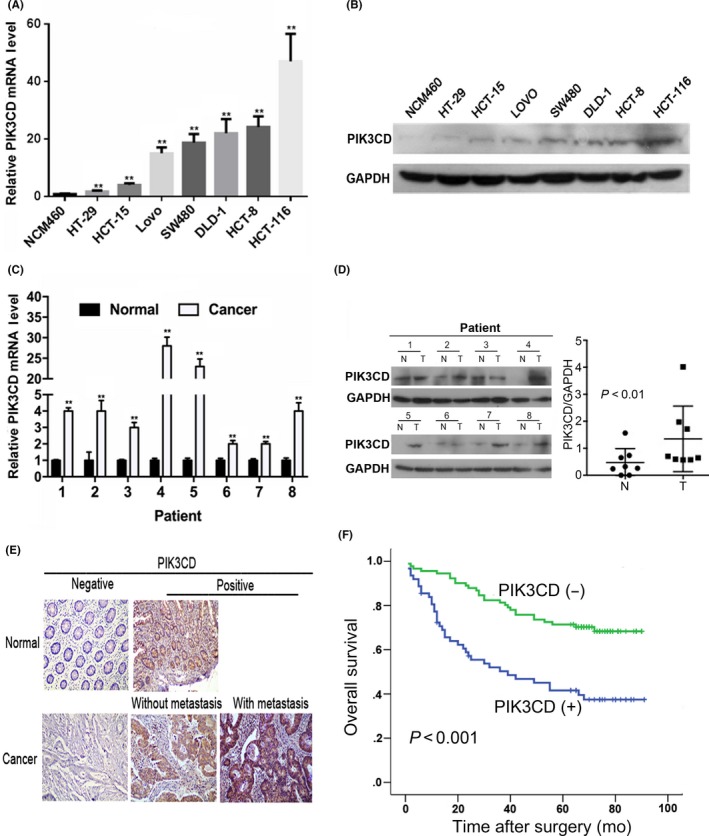
PIK3CD is overexpressed in colorectal cancer cell lines and tissues and is a prognostic factor for colon cancer patients. A, PIK3CD mRNA expression in normal human colon epithelial cell line (NCM460) and human colorectal cancer (CRC) cell lines (HT‐29, HCT‐15, LoVo, SW480, DLD‐1, HCT‐8 and HCT‐116) assessed by real‐time PCR. **P < .01, compared with NCM460 cells. Error bars represent the mean ± SD of triplicate independent experiments. B, PIK3CD protein expression in NCM460 cells and CRC cell lines by western blot analysis. GAPDH was used as a loading control. C, PIK3CD mRNA expression in 8 pairs of colon cancer (Cancer) and adjacent normal (Normal) tissues. **P < .01, compared with matched adjacent normal tissues. D, PIK3CD protein expression in 8 pairs of colon cancer (T) and adjacent normal (N) tissues by western blot analysis (Left). The intensity of bands was quantified using ImageJ software and normalized to GAPDH (Right). E, Representative immunostaining of PIK3CD in adjacent normal tissues (Normal), colon cancer (Cancer) tissues without or with distant metastasis (×200 magnification). F, Kaplan‐Meier analysis of the correlation between PIK3CD and overall survival of 153 colon cancer patients. P‐value is based on a log‐rank test
To further validate the relationship between PIK3CD expression and human colon cancer, we analyzed PIK3CD expression in 153 pairs of colon cancer and adjacent normal tissues by immunohistochemistry. The representative immunostaining profile of PIK3CD is shown in Figure 1E. PIK3CD positivity was detected in 40.52% (62/153) of the colon cancer specimens, whereas it was detected in 7.4% (12/153) of matched adjacent normal tissues (P < .001). Furthermore, PIK3CD overexpression was significantly associated with distant metastasis, higher TNM stage, CEA ≥ 5 ng/mL and higher proliferation index (Ki‐67 label index ≥ 50%) (Table 1). PIK3CD protein expression was detected more frequently in colon cancers with distant metastasis (84%, 21/25) than in colon cancers without distant metastasis (32%, 41/128) (P < .001) (Table 1, Figure 1E). Kaplan‐Meier analyses showed that colon cancer patients with higher levels of PIK3CD had poorer overall survival (OS) (P < .001; Figure 1F). Univariate and multivariate analyses revealed that PIK3CD was an independent predictor for OS of patients with colon cancer (Table S1 and Table 2). These data indicate that overexpression of PIK3CD correlates with advanced TNM stage and distant metastasis and that PIK3CD might be a potential biomarker for unfavorable prognosis in patients with colon cancer.
Table 1.
Association between PIK3CD expression and clinicopathological features of colon cancer
| Variable | n | PIK3CD | P | |
|---|---|---|---|---|
| − | + | |||
| Age (y) | ||||
| <66 (median) | 72 | 47 | 25 | .168 |
| ≥66 | 81 | 44 | 37 | |
| Sex | ||||
| Male | 77 | 43 | 34 | .357 |
| Female | 76 | 48 | 28 | |
| Serum CEA (ng/mL) | ||||
| <5 | 66 | 48 | 18 | .004 |
| ≥5 | 87 | 43 | 44 | |
| Tumor size (cm) | ||||
| <3 | 12 | 9 | 3 | .254 |
| ≥3 | 141 | 82 | 59 | |
| Tumor location | ||||
| Proximal | 77 | 48 | 29 | .468 |
| Distal | 76 | 43 | 33 | |
| Histological differentiation | ||||
| Well | 12 | 8 | 4 | .574 |
| Moderate | 132 | 79 | 53 | |
| Poor | 9 | 4 | 5 | |
| T | ||||
| T1 | 5 | 4 | 1 | .383 |
| T2 | 26 | 18 | 8 | |
| T3 | 15 | 10 | 5 | |
| T4 | 107 | 59 | 48 | |
| N | ||||
| N0 | 78 | 48 | 30 | .091 |
| N1 | 41 | 28 | 13 | |
| N2 | 34 | 15 | 19 | |
| M | ||||
| M0 | 128 | 87 | 41 | <.001 |
| M1 | 25 | 4 | 21 | |
| TNM stage | ||||
| I | 24 | 16 | 8 | <.001 |
| II | 43 | 28 | 15 | |
| III | 61 | 43 | 18 | |
| IV | 25 | 4 | 21 | |
| Ki‐67 (%) | ||||
| <50 | 77 | 52 | 25 | .041 |
| ≥50 | 76 | 39 | 37 | |
Table 2.
Multivariate analysis of prognostic factors for overall survival in patients with colon cancer
| Variable | HR (95% CI) | P |
|---|---|---|
| TNM stage | 2.632 (1.866‐3.713) | .000 |
| PIK3CD | 2.016 (1.195‐3.403) | .009 |
| CEA | 1.939 (1.096‐3.432) | .023 |
CI, confidence interval; HR, hazard ratio.
3.2. PIK3CD induced colorectal cancer cell growth, migration and invasion
To explore the biological functions of PIK3CD in CRC cells, we carried out in vitro gain‐of‐function analyses using HCT‐15 cells that stably overexpressed PIK3CD. We found that the PIK3CD mRNA and protein levels were dramatically increased in HCT‐15 cells that stably overexpressed PIK3CD compared with the control cells (P < .01) (Figure 2A,B). MTT and colony‐formation assays revealed that ectopic expression of PIK3CD markedly promoted cell growth (Figure 2C,D). Moreover, overexpression of PIK3CD significantly enhanced cell mobility, migration and invasion as determined by wound healing, Transwell migration and invasion assays, respectively (Figure 2E,F). Taken together, these data suggest that PIK3CD is important for progression of CRC.
Figure 2.
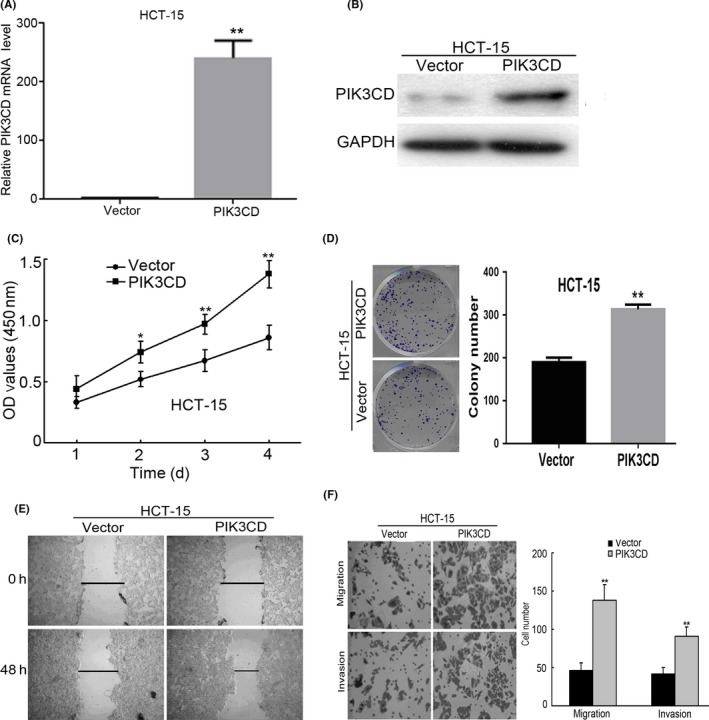
PIK3CD promotes colorectal cancer (CRC) cell growth, migration and invasion. A, PIK3CD mRNA level in HCT‐15 cells stably expressing PIK3CD or vector was examined by real‐time PCR analysis. B, PIK3CD protein expression in HCT‐15 cells stably expressing PIK3CD or vector was analyzed by western blot analysis. C, Cell growth of indicated cells was assessed by MTT assays. D, Anchorage‐dependent growth of indicated cells was measured by colony formation assays. E, Cell mobility of indicated cells was evaluated by wound healing assays. Representative micrographs were taken 0 and 48 h after scratching. F, Quantification of indicated migrating or invading cells was determined by Matrigel‐noncoated or Matrigel‐coated Transwell assays, respectively. F, ×100 magnification. *P < .05; **P < .01
3.3. Inhibition of PIK3CD suppressed colorectal cancer cell growth, migration and invasion
To further confirm the effects of PIK3CD on CRC cell behavior, we inhibited PIK3CD in HCT‐116 cells using siRNA targeting PIK3CD or idelalisib (also known as GS‐1101 and CAL‐101), a selective inhibitor of the p110δ subunit of PI3K. We designed and synthesized 3 different siRNA (siRNA‐1, siRNA‐2 and siRNA‐3) against PIK3CD. The effectiveness of these siRNA to deplete PIK3CD expression was confirmed by real‐time PCR and western blot analyses (Figure 3A,B). Because siRNA‐2 exhibited the greatest inhibitory effect on PIK3CD, siRNA‐2 was used for all subsequent experiments. MTT and colony formation assays showed that PIK3CD siRNA drastically suppressed the growth of HCT‐116 cells compared with negative control (Figure 3C,D). Wound healing and Transwell assays demonstrated that depletion of PIK3CD by siRNA significantly inhibited the mobility, migration and invasion of HCT‐116 cells (Figure 3E,F). Similarly, inhibition of PIK3CD by idelalisib markedly suppressed cell viability, migration and invasion of HCT‐116 cells (Figure 3G,H). Collectively, these results indicate that PIK3CD contributes to the development and progression of CRC.
Figure 3.
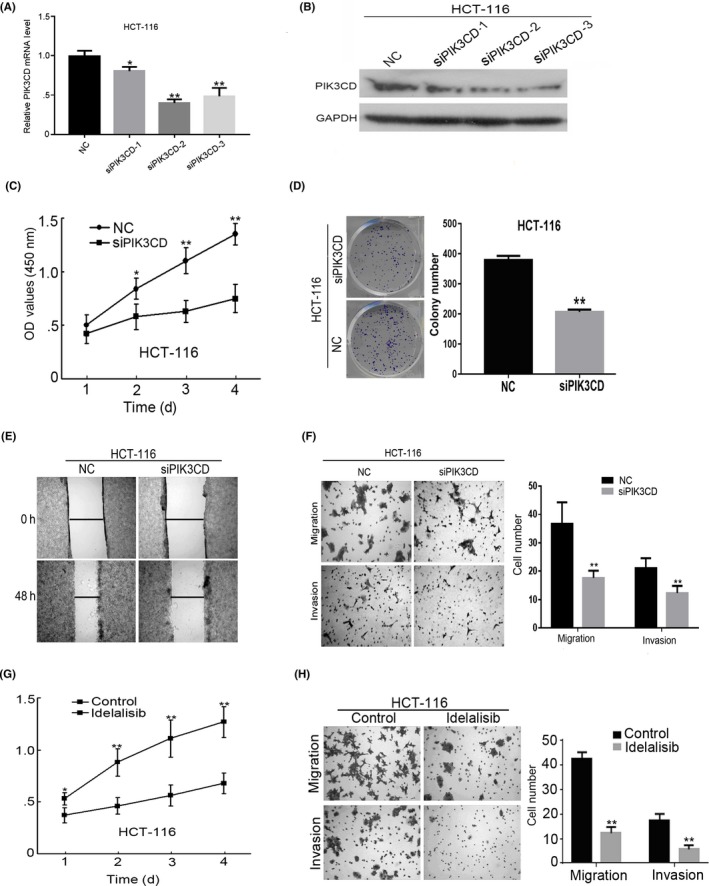
Inhibition of PIK3CD suppresses colorectal cancer (CRC) cell growth, migration and invasion. After HCT‐116 cells were transfected with 100 nmol/L indicated siRNA or NC for 48 h, PIK3CD mRNA (A) and protein (B) expression in indicated cells was analyzed by real‐time PCR and western blot analysis, respectively. (C) After HCT‐116 cells were transfected with 100 nmol/L PIK3CD siRNA‐2 (siPIK3CD) or NC for indicated time, cell viability was determined by MTT assays. After HCT‐116 cells were transfected with 100 nmol/L siPIK3CD or NC for 48 h, colony formation (D), mobility (E), migration and invasion (F) of indicated cells were assessed. (G) After HCT‐116 cells were treated with or without 10 μmol/L idelalisib for indicated time, cell growth of indicated cells was examined by MTT assays. (H) Cell migration and invasion assays for HCT‐116 cells treated with or without 10 μmol/L idelalisib for 48 h. F, H, ×100 magnification. *P < .05; **P < .01. NC, negative control
3.4. PIK3CD promoted cell growth, migration and invasion by activating β‐catenin signaling in colorectal cancer cells
Wnt/β‐catenin signaling pathway is frequently activated and is critical for tumor initiation and progression in CRC,23, 24 therefore, we examined whether PIK3CD activates Wnt/β‐catenin signaling. Western blot analyses showed that overexpression of PIK3CD significantly increased levels of β‐catenin as well as β‐catenin signaling downstream targets, including C‐Myc and Cyclin D1, which was accompanied by decreased phosphorylated β‐catenin (Ser33/37/Thr41) levels in HCT‐15 cells (Figure 4A). Results from the subcellular fraction revealed that overexpression of PIK3CD resulted in increased nuclear β‐catenin expression in HCT‐15 cell (Figure 4B). The TOP/FOP flash luciferase assay revealed that PIK3CD overexpression markedly increased the transactivating activity of β‐catenin in HCT‐15 cells (Figure 4C). Conversely, siRNA‐mediated depletion of PIK3CD expression dramatically decreased β‐catenin, C‐Myc and Cyclin D1 expression, β‐catenin nuclear translocation, and transcriptional activity of T‐cell factor/lymphoid enhancer factor (TCF/LEF), but increased phosphorylated β‐catenin expression in HCT‐116 cells (Figure 4A‐C). These data suggest that PIK3CD contributes to activation of β‐catenin signaling.
Figure 4.
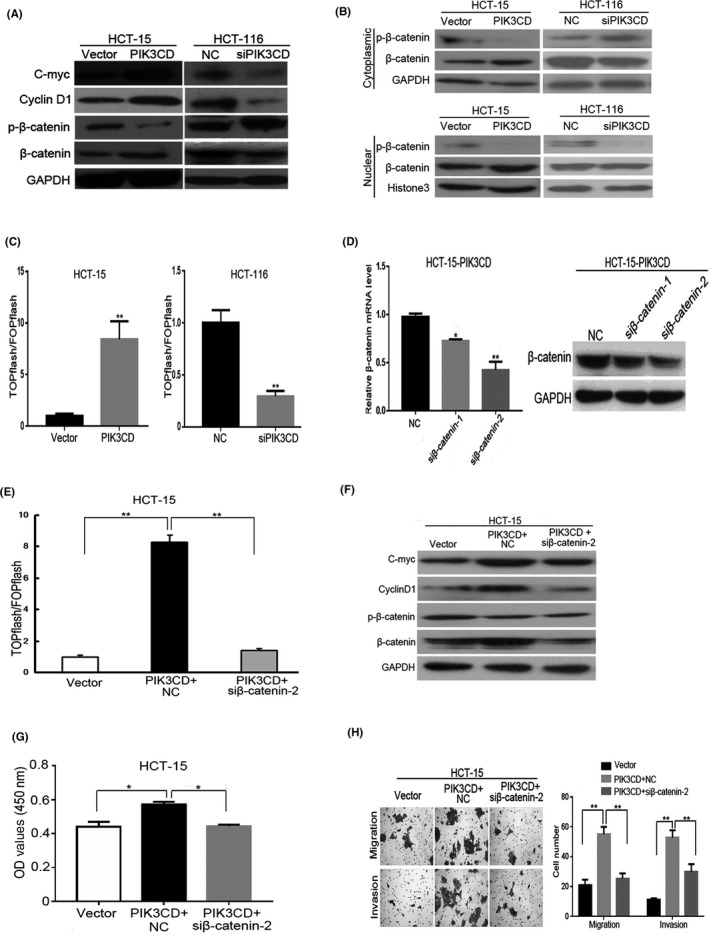
PIK3CD induces colorectal cancer (CRC) cell growth, migration and invasion by activating β‐catenin signaling. A, Effect of PIK3CD overexpression or inhibition on β‐catenin, phosphorylated β‐catenin (Ser33/37/Thr41) (p‐β‐catenin), Cyclin D1 and C‐myc protein expression in CRC cells. B, Cytoplasmic and nuclear fractions of both β‐catenin and p‐β‐catenin expressions in indicated cells in response to PIK3CD overexpression or suppression. Histone 3 was used as a nuclear loading control. C, TCF/LEF transcriptional activity was examined by dual‐luciferase assays in indicated cells in response to PIK3CD overexpression or inhibition. D, After HCT‐15 cells overexpressing PIK3CD were transfected with 100 nmol/L indicated siRNA or NC for 48 h, β‐catenin mRNA and protein expression was determined by real‐time PCR (left) and western blot (right), respectively. After HCT‐15 cells overexpressing PIK3CD (HCT‐15‐PIK3CD) were transfected with 100 nmol/L β‐catenin siRNA‐2 or NC for 48 h. E, TCF/LEF transcriptional activity was analyzed in indicated cells. F, The protein levels of β‐catenin, p‐β‐catenin, Cyclin D1 and C‐myc in indicated cells were assessed by western blot analysis. G, Cell growth of indicated cells was evaluated by MTT assays. H, Migratory and invasive potential of indicated cells, as determined by Transwell assays. H, ×100 magnification.*P < .05; **P < .01. NC, negative control
To further validate whether PIK3CD induces cell growth and invasion via β‐catenin signaling, we analyzed the impact of blocking β‐catenin signaling by knocking down β‐catenin on HCT‐15 cells that stably overexpressed PIK3CD. The effectiveness of the siRNA to inhibit β‐catenin expression was confirmed by real‐time PCR and western blot (Figure 4D). We found that blockade of β‐catenin signaling not only suppressed PIK3CD–induced TCF/LEF transcriptional activity as well as C‐myc and CyclinD1 expression (Figure 4E,F) but also abrogated PIK3CD–induced cell growth, migration and invasiveness (Figure 4G,H). Taken together, our results suggest that PIK3CD induces cell growth, migration and invasion through activating β‐catenin signaling in CRC cells.
3.5. PIK3CD mediated cell growth, migration, invasion and β‐catenin signaling activation through regulating AKT/GSK‐3β pathway in colorectal cancer cells
To further elucidate the mechanism of PIK3CD‐mediated activation of β‐catenin signaling, we investigated the status of GSK3β, a negative regulator of β‐catenin signaling and a downstream target of PI3K/AKT signaling.25, 26 Our results showed that overexpression of PIK3CD significantly upregulated, whereas knockdown of PIK3CD downregulated, AKT phosphorylation at the Ser473 site (active AKT) and GSK‐3β phosphorylation at the Ser9 site (inactive GSK‐3β) levels (Figure 5A). However, neither PIK3CD overexpression nor PIK3CD knockdown altered the total levels of AKT or GSK3β (Figure 5A). These findings indicate that PIK3CD enhances AKT activity, and further suppresses GSK‐3β activity via the increment of GSK‐3β phosphorylation at Ser9 site in CRC cells.
Figure 5.
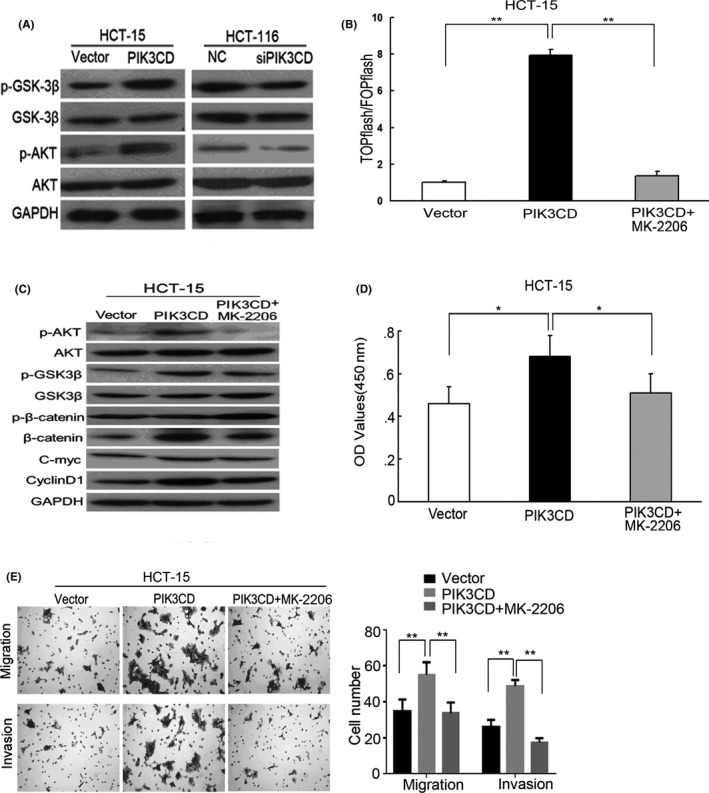
AKT/GSK‐3β signaling is crucial for PIK3CD‐induced cell growth, invasion and β‐catenin signaling activation in colorectal cancer (CRC) cells. A, Western blot analysis of AKT, phosphorylated AKT (Ser473) (p‐AKT) (active AKT), GSK‐3β and phosphorylated GSK‐3β (Ser9) (p‐GSK‐3β) (inactive GSK‐3β) in indicated cells. After HCT‐15 cells overexpressing PIK3CD were treated with 10 μmol/L MK‐2206 for 24 h. B, TCF/LEF transcriptional activity was analyzed in indicated cells. C, The protein levels of AKT, p‐AKT, GSK‐3β, p‐GSK‐3β, β‐catenin, p‐β‐catenin, Cyclin D1 and C‐myc in indicated cells were assessed by western blot analysis. D, The cells were incubated for another 24 h, cell viability of indicated cells was evaluated by MTT assays. E, Quantification of indicated migrating or invading cells. E, ×100 magnification. *P < .05; **P < .01
To determine whether PIK3CD induces cell growth, migration and invasion and β‐catenin activation through regulating AKT/GSK3β signaling in CRC cells, we treated HCT‐15 cells stably expressing PIK3CD with 10 μmol/L MK‐2206, an inhibitor of AKT. The results demonstrated the inhibition of the PI3K/AKT pathway by MK‐2206 reversed the ability of PIK3CD to induce GSK‐3β inactivation, β‐catenin pathway activation, along with cell growth, migration and invasion in HCT‐15 cells (Figure 5B‐E). Taken together, our data suggest that PIK3CD induces cell growth, invasion and β‐catenin signaling activation through the regulation of AKT/GSK‐3β axis in CRC cells.
3.6. PIK3CD promoted colorectal cancer growth and β‐catenin signaling activation in vivo
Given that in vitro experiments demonstrated that PIK3CD promoted CRC cell growth, we next determined whether PIK3CD could promote CRC growth in vivo. We found that the average volume and weight of tumors derived from HCT‐15 cells overexpressing PIK3CD were dramatically larger than those of control in nude mice (Figure 6A‐C). We further investigated the effects of PIK3CD inhibition on CRC growth in vivo. Expectedly, inhibition of PIK3CD by idelalisib markedly suppressed growth of CRC xenograft tumors in nude mice (Figure 6D‐F). These results reveal that PIK3CD promotes the tumorigenesis and development of CRC in vivo.
Figure 6.
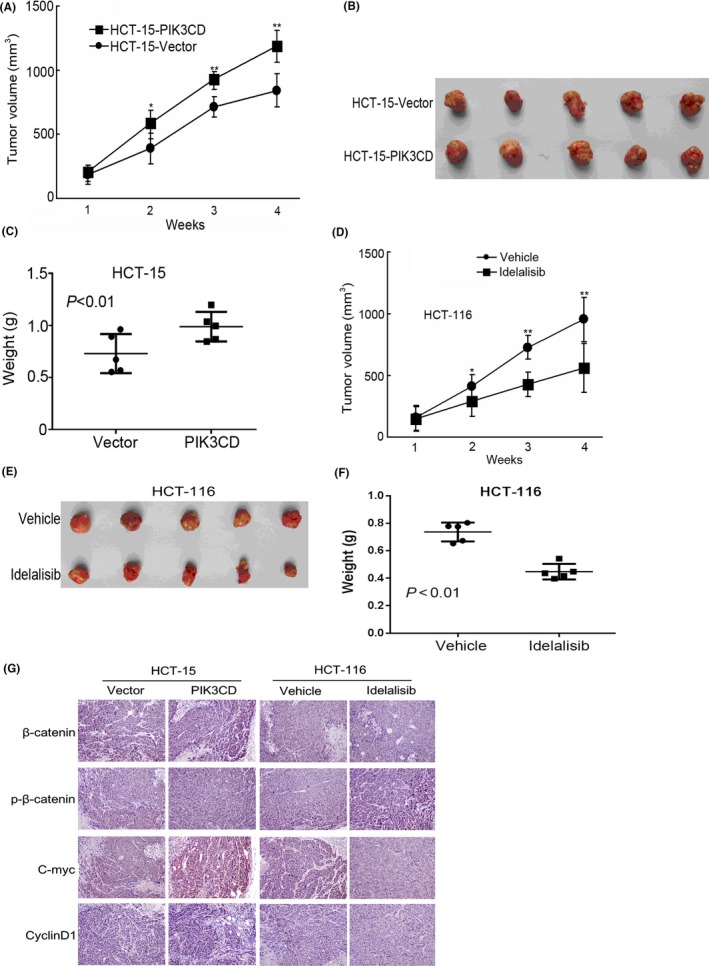
PIK3CD promotes tumor growth and β‐catenin signaling activation of colorectal cancer (CRC) cells in nude mice. HCT‐15 cells overexpressing PIK3CD (HCT‐15‐PIK3CD) and HCT‐15 cells expressing vector (HCT‐15‐vector) were injected into the right flank of nude mice (n = 5). After 4 wk, all mice were killed and tumors were excised. A, Tumor volumes were measured in indicated weeks. B, Representative images of xenograft tumors. C, Quantification of the tumor weight. Symbols represent individual mice; horizontal bars indicate the mean ± SD. After HCT‐116 cells were injected into the right flank of nude mice for 1 wk, the mice were orally administered DMSO (Vehicle group) or idelalisib for 10 d. Four weeks after inoculation, the tumors were excised. D, Tumor volumes were measured in indicated weeks. E, Representative images of xenograft tumors. F, Quantification of the tumor weight. G, Representative images of immunohistochemical analysis of β‐catenin, p‐β‐catenin, Cyclin D1 and C‐myc in xenograft tumors from (B) and € (×200). **P < .01
Furthermore, we examined the expression of β‐catenin, phosphorylated β‐catenin, C‐myc and CyclinD1 in the harvested tumor tissues by immunohistochemistry staining. The results showed that β‐catenin, C‐myc and CyclinD1 expressions were significantly increased, whereas phosphorylated β‐catenin expression was reduced in tumors derived from HCT‐15 cells stably expressing PIK3CD compared with the control group (Figure 6G). In contrast, idelalisib markedly decreased β‐catenin, C‐myc and CyclinD1 expressions and increased phosphorylated β‐catenin expression in tumors compared with the control group (Figure 6G). Collectively, our data suggest that PIK3CD can promote CRC growth and β‐catenin signaling activation in vivo, which is consistent with our in vitro results.
3.7. PIK3CD was positively correlated with β‐catenin abnormal expression in human colon cancer samples
To further investigate the correlation between PIK3CD and β‐catenin in colon cancer, we detected β‐catenin expression using immunohistochemistry in the same cohort of colon cancer samples used to assess the expression levels of PIK3CD. The results demonstrated that β‐catenin abnormal expression was significantly higher in colon cancer tissues than that in matched normal tissues (59.5% vs 7.2%, P < .001; Figure 7A). Moreover, β‐catenin abnormal expression was closely correlated with distant metastasis, higher TNM stage, CEA ≥ 5 ng/mL and higher proliferation index (Table S2). Kaplan‐Meier analyses demonstrated that β‐catenin abnormal expression predicted poorer OS (P < .001; Figure 7B) in colon cancer patients. Univariate and multivariate analyses revealed that β‐catenin abnormal expression was an independent predictor for OS (hazard ratio [HR] = 1.936, 95% confidence interval [CI]: 1.068–3.511, P = .030) of patients with colon cancer. In addition, we found that 91.9% (57/62) of samples exhibited β‐catenin abnormal expression in the positive PIK3CD expression group. Conversely, only 37.4% (34/91) of samples showed β‐catenin abnormal expression in negative staining of the PIK3CD group (P < .01) (Figure 7C). Thus, there was a significant positive correlation between PIK3CD expression and β‐catenin abnormal expression in these colon cancer samples (r = .546, P < .001). Taken together, these data support that PIK3CD regulates β‐catenin activation in human colon cancer tissues.
Figure 7.
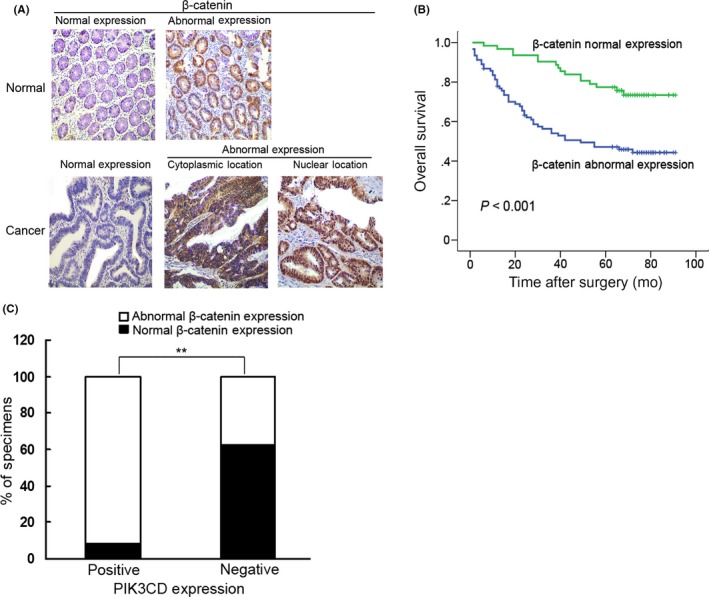
Correlation of PIK3CD expression with β‐catenin expression in colon cancer specimens. A, Representative immunostaining of normal and abnormal β‐catenin expression in adjacent normal tissues (Normal) and colon cancer tissues (Cancer) (×200 magnification). B, Kaplan‐Meier analysis of the association between β‐catenin and overall survival of 153 patients with colon cancer. C, Percentage of specimens showing positive or negative PIK3CD expression in relation to β‐catenin abnormal expression. **P < .01
4. DISCUSSION
In this study, we demonstrated that the catalytic subunit p110δ of PI3K (PIK3CD) was overexpressed in colon cancer samples and a variety of human CRC cell lines and that PIK3CD was an independent predictor for OS of patients with colon cancer. Moreover, the ectopic expression of PIK3CD significantly promoted CRC cell growth, migration and invasion in vitro and tumor growth in vivo. In contrast, suppression of PIK3CD dramatically impaired CRC cell growth, migration and invasion in vitro and tumor growth in vivo. Furthermore, PIK3CD promoted cell growth and invasion by activating AKT/GSK‐3β/β‐catenin pathway in CRC cells. PIK3CD expression positively correlated with β‐catenin abnormal expression in colon cancer samples. Therefore, these data indicate that PIK3CD functions as a tumor promoter through activation of AKT/GSK‐3β/β‐catenin signaling in CRC.
The PI3K subunit p110δ encoded by the PIK3CD gene is expressed predominantly in leukocytes and is required for B cell homeostasis and function.3, 4, 9 PIK3CD has recently been found to regulate progression of several cancer cells.9, 10, 11, 12, 13, 14 Here, we found that PIK3CD was upregulated in colon cancer tissues and CRC cell lines and that PIK3CD was an independent predictor of survival in CRC patients. Moreover, we demonstrated that ectopic expression of PIK3CD induced, whereas inhibition of PIK3CD impaired, CRC cell growth, migration and invasion in vitro and tumor growth in vivo. Therefore, these data suggest that PIK3CD plays an essential, non‐redundant role in CRC progression and that PIK3CD might be a novel potential therapeutic target for CRC.
Inactivation of p110δ can break tumor‐induced immune tolerance and, thus, block progression of several hematological and solid cancers.27 Idelalisib (also known as GS‐1101 and CAL‐101), the p110δ‐selective inhibitor, has shown impressive therapeutic efficacy in human chronic lymphocytic leukemia and indolent lymphoma.28, 29 Previous studies have shown that inactivation of p110δ can suppress neuroblastoma cell and breast tumor growth and metastasis.13, 30 Our results revealed that PIK3CD inhibition by idelalisib or specific siRNA remarkably impaired CRC cell growth, migration and invasion, suggesting that inhibition of PIK3CD might be a promising treatment option for CRC. Our findings provide a rationale for the use of idelalisib in the treatment of CRC.
The Wnt/β‐catenin signaling pathway plays a pivotal role in normal embryonic development, adult tissue homeostasis and regulating various cellular processes, including cell differentiation, proliferation and apoptosis.31, 32, 33 Dysregulation of Wnt/β‐catenin signaling has been widely implicated in cancer.31, 32, 33, 34 Aberrant activation of Wnt/β‐catenin signaling is crucial for the genesis and development of CRC.23, 35, 36 Approximately 90% of CRC originate from constitutive activation of Wnt/β‐catenin signaling.23, 36
β‐catenin is a pivotal component of Wnt/β‐catenin signaling. Wnt/β‐catenin signaling is activated upon Wnt ligand binding to Frizzled receptors and low‐density lipoprotein‐receptor‐related protein‐5/6 (LRP‐5/6) co‐receptors. The cytoplasmic disheveled (Dvl) is subsequently phosphorylated (activated), which impedes β‐catenin phosphorylation by the destruction complex comprised of Axin, adenomatous polyposis coli (APC), casein kinase 1 (CK1) and GSK‐3β. Thereafter, the stabilized β‐catenin accumulates in the cytoplasm and translocates to the nucleus, where it interacts with TCF/LEF transcription factors to transactivate target genes, such as C‐myc and CyclinD1.31, 32, 33 However, in the absence of Wnt ligands, cytoplasmic β‐catenin is phosphorylated at specific serine and threonine residues by CK1 and GSK‐3β in the destruction complex and is subsequently degraded by the ubiquitin‐proteasome system, keeping levels of cytoplasmic and nuclear β‐catenin low.31, 32, 33 We found that PIK3CD overexpression dramatically increased cytoplasmic accumulation and nuclear translocation of β‐catenin and the transactivating activity of β‐catenin in CRC cells, but decreased phosphorylated β‐catenin levels. However, the inhibition of PIK3CD exerted the opposite effect. Furthermore, blocking β‐catenin signaling abrogated the stimulatory effect of PIK3CD on cell growth, migration and invasion. In addition, PIK3CD expression positively correlated with β‐catenin abnormal expression in the colon cancer samples. Therefore, these findings suggest that PIK3CD promotes CRC cell growth through activating β‐catenin signaling.
GSK‐3β can phosphorylate β‐catenin at Ser33/37/Thr41 residues, resulting in β‐catenin sequestration and degradation.37, 38 Therefore, GSK‐3β is a negative regulator of β‐catenin. Accumulated evidence has shown that GSK‐3β is a downstream target of the PI3K/AKT pathway and could be inactivated by AKT‐mediated phosphorylation at its Ser 9 residue.25, 39, 40 Our results demonstrated that PIK3CD overexpression significantly upregulated, whereas inhibition of PIK3CD markedly downregulated, phosphorylated (activated) AKT and phosphorylated (inactivated) GSK‐3β levels. Furthermore, blockade of PI3K/AKT pathway reversed the ability of PIK3CD to induce GSK‐3β inactivation, β‐catenin pathway activation, cell growth, migration and invasion. Therefore, these data reveal that PIK3CD‐mediated AKT activation leads to inactivation of GSK‐3β and consequent β‐catenin pathway activation by reducing phosphorylation of β‐catenin at Ser33/37/Thr41.
In conclusion, our results reveal that PIK3CD is upregulated and is an independent prognostic factor in CRC and that PIK3CD induces CRC cell growth, migration and invasion by activating AKT/GSK‐3β/β‐catenin signaling. Thus, these findings suggest that PIK3CD is a novel independent prognostic biomarker for CRC and that inhibition of PIK3CD might be a promising strategy for CRC.
CONFLICTS OF INTEREST
The authors declare no conflicts of interest.
Supporting information
Chen J‐S, Huang J‐Q, Luo B, et al. PIK3CD induces cell growth and invasion by activating AKT/GSK‐3β/β‐catenin signaling in colorectal cancer. Cancer Sci. 2019;110:997–1011. 10.1111/cas.13931
Jing‐Song Chen, Jiong‐Qiang Huang and Bing Luo contributed equally to this work.
REFERENCES
- 1. Torre LA, Bray F, Siegel RL, Ferlay J, Lortet‐Tieulent J, Jemal A. Global cancer statistics, 2012. CA Cancer J Clin. 2015;65:87‐108. [DOI] [PubMed] [Google Scholar]
- 2. Ferlay J, Soerjomataram I, Dikshit R, et al. Cancer incidence and mortality worldwide: sources, methods and major patterns in GLOBOCAN 2012. Int J Cancer. 2015;136:E359‐E386. [DOI] [PubMed] [Google Scholar]
- 3. Thorpe LM, Yuzugullu H, Zhao JJ. PI3K in cancer: divergent roles of isoforms, modes of activation and therapeutic targeting. Nat Rev Cancer. 2015;15:7‐24. [DOI] [PMC free article] [PubMed] [Google Scholar]
- 4. Fruman DA, Rommel C. PI3K and cancer: lessons, challenges and opportunities. Nat Rev Drug Discov. 2014;13:140‐156. [DOI] [PMC free article] [PubMed] [Google Scholar]
- 5. Zhang J, Roberts TM, Shivdasani RA. Targeting PI3K signaling as a therapeutic approach for colorectal cancer. Gastroenterology. 2011;141:50‐61. [DOI] [PubMed] [Google Scholar]
- 6. Wojtalla A, Fischer B, Kotelevets N, et al. Targeting the phosphoinositide 3‐kinase p110‐α isoform impairs cell proliferation, survival, and tumor growth in small cell lung cancer. Clin Cancer Res. 2013;19:96‐105. [DOI] [PubMed] [Google Scholar]
- 7. Singh P, Dar MS, Dar MJ. p110α and p110β isoforms of PI3K signaling: are they two sides of the same coin? FEBS Lett. 2016;590:3071‐3082. [DOI] [PubMed] [Google Scholar]
- 8. An HJ, Cho NH, Yang HS, et al. Targeted RNA interference of phosphatidylinositol 3‐kinase p110‐beta induces apoptosis and proliferation arrest in endometrial carcinoma cells. J Pathol. 2007;212:161‐169. [DOI] [PubMed] [Google Scholar]
- 9. Tzenaki N, Papakonstanti EA. p110δ PI3 kinase pathway: emerging roles in cancer. Front Oncol. 2013;3:40. [DOI] [PMC free article] [PubMed] [Google Scholar]
- 10. Fang Y, Xue JL, Shen Q, Chen J, Tian L. MicroRNA‐7 inhibits tumor growth and metastasis by targeting the phosphoinositide 3‐kinase/Akt pathway in hepatocellular carcinoma. Hepatology. 2012;55:1852‐1862. [DOI] [PubMed] [Google Scholar]
- 11. Luk SK, Piekorz RP, Nürnberg B, Tony To SS. The catalytic phosphoinositol 3‐kinase isoform p110δ is required for glioma cell migration and invasion. Eur J Cancer. 2012;48:149‐157. [DOI] [PubMed] [Google Scholar]
- 12. Shi Y, Chen C, Zhang X, et al. Primate‐specific miR‐663 functions as a tumor suppressor by targeting PIK3CD and predicts the prognosis of human glioblastoma. Clin Cancer Res. 2014;20:1803‐1813. [DOI] [PubMed] [Google Scholar]
- 13. Boller D, Schramm A, Doepfner KT, et al. Targeting the phosphoinositide 3‐kinase isoform p110delta impairs growth and survival in neuroblastoma cells. Clin Cancer Res. 2008;14:1172‐1181. [DOI] [PubMed] [Google Scholar]
- 14. Sawyer C, Sturge J, Bennett DC, et al. Regulation of breast cancer cell chemotaxis by the phosphoinositide 3‐kinase p110delta. Cancer Res. 2003;63:1667‐1675. [PubMed] [Google Scholar]
- 15. Chen JS, Wang Q, Fu XH, et al. Involvement of PI3K/PTEN/AKT/mTOR pathway in invasion and metastasis in hepatocellular carcinoma: association with MMP‐9. Hepatol Res. 2009;39:177‐186. [DOI] [PubMed] [Google Scholar]
- 16. Chen JS, Huang XH, Wang Q, et al. Sonic hedgehog signaling pathway induces cell migration and invasion through focal adhesion kinase/AKT signaling‐ mediated activation of matrix metalloproteinase (MMP)‐2 and MMP‐9 in liver cancer. Carcinogenesis. 2013;34:10‐19. [DOI] [PubMed] [Google Scholar]
- 17. Chen JS, Li HS, Huang JQ, et al. MicroRNA‐379‐5p inhibits tumor invasion and metastasis by targeting FAK/AKT signaling in hepatocellular carcinoma. Cancer Lett. 2016;375:73‐83. [DOI] [PubMed] [Google Scholar]
- 18. Chen JS, Huang XH, Wang Q, et al. FAK is involved in invasion and metastasis of hepatocellular carcinoma. Clin Exp Metastasis. 2010;27:71‐82. [DOI] [PubMed] [Google Scholar]
- 19. Dong T, Liu Z, Zhao S, et al. The expression of CD9 and PIK3CD is associated with prognosis of follicular lymphoma. J Cancer. 2015;6:1222‐1229. [DOI] [PMC free article] [PubMed] [Google Scholar]
- 20. Cui W, Zheng S, Li X, et al. PIK3CD promoted proliferation in diffuse large B cell lymphoma through upregulation of c‐myc. Tumour Biol. 2016;37:12767‐12777. [DOI] [PubMed] [Google Scholar]
- 21. Zhang F, Meng F, Li H, Dong Y, Yang W, Han A. Suppression of retinoid X receptor alpha and aberrant β‐catenin expression significantly associates with progression of colorectal carcinoma. Eur J Cancer. 2011;47:2060‐2067. [DOI] [PubMed] [Google Scholar]
- 22. Maruyama K, Ochiai A, Akimoto S, et al. Cytoplasmic beta‐catenin accumulation as a predictor of hematogenous metastasis in human colorectal cancer. Oncology. 2000;59:302‐309. [DOI] [PubMed] [Google Scholar]
- 23. White BD, Chien AJ, Dawson DW. Dysregulation of Wnt/β‐catenin signaling in gastrointestinal cancers. Gastroenterology. 2012;142:219‐232. [DOI] [PMC free article] [PubMed] [Google Scholar]
- 24. Novellasdemunt L, Antas P, Li VS. Targeting Wnt signaling in colorectal cancer. A review in the theme: cell signaling: proteins, pathways and mechanisms. Am J Physiol Cell Physiol. 2015;309:C511‐C521. [DOI] [PMC free article] [PubMed] [Google Scholar]
- 25. Cohen P, Frame S. The renaissance of GSK3. Nat Rev Mol Cell Biol. 2001;2:769‐776. [DOI] [PubMed] [Google Scholar]
- 26. Benoit YD, Guezguez B, Boyd AL, Bhatia M. Molecular pathways: epigenetic modulation of Wnt‐glycogen synthase kinase‐3 signaling to target human cancer stem cells. Clin Cancer Res. 2014;20:5372‐5378. [DOI] [PubMed] [Google Scholar]
- 27. Ali K, Soond DR, Pineiro R, et al. Inactivation of PI(3)K p110δ breaks regulatory T‐cell‐mediated immune tolerance to cancer. Nature. 2014;510:407‐411. [DOI] [PMC free article] [PubMed] [Google Scholar]
- 28. Furman RR, Sharman JP, Coutre SE, et al. Idelalisib and rituximab in relapsed chronic lymphocytic leukemia. N Engl J Med. 2014;370:997‐1007. [DOI] [PMC free article] [PubMed] [Google Scholar]
- 29. Gopal AK, Kahl BS, de Vos S, et al. PI3Kδ inhibition by idelalisib in patients with relapsed indolent lymphoma. N Engl J Med. 2014;370:1008‐1018. [DOI] [PMC free article] [PubMed] [Google Scholar]
- 30. Goulielmaki E, Bermudez‐Brito M, Andreou M, et al. Pharmacological inactivation of the PI3K p110δ prevents breast tumour progression by targeting cancer cells and macrophages. Cell Death Dis. 2018;9:678. [DOI] [PMC free article] [PubMed] [Google Scholar]
- 31. Klaus A, Birchmeier W. Wnt signalling and its impact on development and cancer. Nat Rev Cancer. 2008;8:387‐398. [DOI] [PubMed] [Google Scholar]
- 32. Smalley MJ, Dale TC. Wnt signalling in mammalian development and cancer. Cancer Metastasis Rev. 1999;18:215‐230. [DOI] [PubMed] [Google Scholar]
- 33. Anastas JN, Moon RT. WNT signalling pathways as therapeutic targets in cancer. Nat Rev Cancer. 2013;13:11‐26. [DOI] [PubMed] [Google Scholar]
- 34. Reya T, Clevers H. Wnt signalling in stem cells and cancer. Nature. 2005;434:843‐850. [DOI] [PubMed] [Google Scholar]
- 35. Fodde R, Smits R, Clevers H. APC, signal transduction and genetic instability in colorectal cancer. Nat Rev Cancer. 2001;1:55‐67. [DOI] [PubMed] [Google Scholar]
- 36. Sebio A, Kahn M, Lenz HJ. The potential of targeting Wnt/β‐catenin in colon cancer. Expert Opin Ther Targets. 2014;18:611‐615. [DOI] [PubMed] [Google Scholar]
- 37. MacDonald BT, Tamai K, He X. Wnt/beta‐catenin signaling: components, mechanisms, and diseases. Dev Cell. 2009;17:9‐26. [DOI] [PMC free article] [PubMed] [Google Scholar]
- 38. Ikeda S, Kishida S, Yamamoto H, Murai H, Koyama S, Kikuchi A. Axin, a negative regulator of the Wnt signaling pathway, forms a complex with GSK‐3beta and beta‐catenin and promotes GSK‐3beta‐dependent phosphorylation of beta‐catenin. EMBO J. 1998;17:1371‐1384. [DOI] [PMC free article] [PubMed] [Google Scholar]
- 39. Sharma M, Chuang WW, Sun Z. Phosphatidylinositol 3‐kinase/Akt stimulates androgen pathway through GSK3beta inhibition and nuclear beta‐catenin accumulation. J Biol Chem. 2002;277:30935‐30941. [DOI] [PubMed] [Google Scholar]
- 40. Cross DA, Alessi DR, Cohen P, Andjelkovich M, Hemmings BA. Inhibition of glycogen synthase kinase‐3 by insulin mediated by protein kinase B. Nature. 1995;378:785‐789. [DOI] [PubMed] [Google Scholar]
Associated Data
This section collects any data citations, data availability statements, or supplementary materials included in this article.
Supplementary Materials