Abstract
Recent immunotherapies have shown clinical success. In particular, vaccines based on particulate antigen (Ag) are expected to be implemented based on their efficacy. In the current study, we describe a strategy entailing Ag‐encapsulating PEG‐modified liposomes (PGL‐Ag) as antigen protein delivery devices and show that the success of the liposome depends on the antigen‐presenting cell (APC) capacity; after administration of PGL‐Ag, dendritic cells (DCs) in particular take up the Ag and subsequently prime T cells. For the generation of antitumor T cell responses in the lymphoid tissues, the function of encapsulated Ag‐capturing DCs in vivo could be a biomarker. We next designed a prime‐boost strategy to enhance the antitumor effects of the PGL‐Ag. In the tumor sites, we show that Ag retention in nanoparticle‐capturing DCs promotes a robust antitumor response. Thus, this efficient particulate Ag‐based host antigen‐presenting cell delivery strategy provides a bridge between innate and adaptive immune response and offers a novel therapeutic option against tumor cells.
Keywords: adaptive immunity, dendritic cell, immunotherapy, nanoparticle, tumor microenvironment
1. INTRODUCTION
Nanoparticle‐based drug delivery platforms have been developed as suitable vehicles for overcoming pharmacokinetic limitations of chemotherapeutic drug delivery and imaging. Many types of particles have been generated for the distribution of anticancer drugs to tumor tissues. With respect to drug distribution and penetration in tumor tissues, the composition or architecture of nanoparticles must be considered. Metal nanoparticles have been used in a wide range of biomedical applications, such as labeling and probing.1, 2 However, their in vivo application is often limited because of weak colloidal stability and poor endocytosis. In this regard, the improvement of biocompatible organic materials has been explored. Liposomes have been of particular focus because their lipid bilayer can enhance the colloidal stability and efficacy of intracellular delivery in vivo. Liposomes combined with anticancer drugs have been used to penetrate tumor tissue efficiently.3
The incorporation of antigen proteins into nanoparticles allows the transfer of biological properties to liposomes.4 To generate an effective vaccine to enhance immunity, not only materials but also methods of manufacturing must be considered: antigen type and dose; immunostimulatory adjuvant; formulation refinement; and the size, surface charge (anionic, cationic, or neutral), lamellarity, and homogeneity.5 Several factors to generate an immune response through antigen‐carrying nanoparticles must be compared.6, 7, 8, 9 For example, nanoparticle size—nanoscale or microscale—is likely an important aspect of delivery and thus has been examined by many groups. The relevance of nanoparticle size to the adjuvant activity has been controversial.10, 11, 12, 13, 14, 15 It was reported that s.c. administration of 200‐nm antigen‐entrapped liposomes was effective in the generation of antitumor T cells.16 However, this treatment did not result in therapeutic effects.16 Another group showed that a vaccine containing smaller 230‐nm ovalbumin (OVA) nanoparticles administered s.c. induced stronger Ab and cellular immune responses than larger 700‐nm OVA nanoparticles.15 Although some groups have shown that smaller particles are more potent than larger particles,10, 15, 16 others have reported the exact opposite.13, 14 These conflicting results indicated that particle size is not the only determining factor of the resultant immune response. To evaluate the efficacy of nanoparticles—in particular, proteoliposomes—for immunotherapy, we propose the evaluation of selected target antigen‐presenting cells (APCs) or T cell immune responses as immunological parameters. Specifically, in the targeting of APCs, dendritic cells (DCs) have been identified as critical in the shaping of appropriate immune responses.17, 18, 19, 20
Dendritic cells reside in the peripheral and lymphoid organs, where they sense the environment for antigens. After taking up antigen, DCs process the antigen in the peripheral organs. Following migration to lymphoid organs, antigen on MHC of DCs can be presented to T‐cell receptors (TCRs) on T cells together with costimulatory signals, thus triggering adaptive immunity. Further understanding of the relationship between antigen type and DC subset would provide new insight into development of nanoparticle‐mediated delivery systems to promote protective immune responses and facilitate the optimal design of vaccines.
In the current study, we evaluated an antitumor vaccine composed of large PEG‐coated, antigen‐encapsulating neutral liposomes (PGL‐Ag) and present critical facets of immunotherapy.
2. MATERIALS AND METHODS
2.1. Mice and cell line
EG7 (OVA‐expressing EL4) lymphoma cell line was purchased from ATCC (Manassas, VA, USA). C57BL/6J mice were purchased from CLEA Japan (Tokyo, Japan). CD11c‐YFP transgenic mice were purchased from Jackson Laboratories (Bar Harbor, ME, USA). OT‐I TCR transgenic mice (B6 background) were originally provided by Dr. W.R. Heath (Walter and Eliza Hall Institute, Parkville, Vic, Australia), and Ly5.1 congenic OT‐1 mice were generated by cross/backcross breeding of OT‐1 with B6. Ly5.1 mice and screening for the presence of Vα2 and Ly5.1 and the absence of Ly5.2 by flow cytometry.21 All mice were maintained under specific pathogen‐free conditions and studied in compliance with our institutional guidelines.
2.2. Fluorescence‐activated cell sorter staining
The following reagents and mAbs specific to mouse proteins were used in these analyses: CD8‐FITC (53‐6.7), CD11b‐PE‐Cy7 (M1/70), F4/80‐APC (CI:A3‐1), F4/80‐Pacific Blue (CI:A3‐1), CD8‐Pacific Blue (53‐6.7), CD45.1‐FITC (A20), CD11c‐PE‐Cy7 (N418), CD103‐biotin (2E7), CD3‐PerCP‐Cy5.5 (145‐2C11), StAv‐Pacific Blue, Aqua, CD3‐APC (145‐2C11), Vα2 TCR‐PE (B20.1), and OVA/H‐2Kb tetramer‐PE. All mAbs and reagents were purchased from BioLegend (San Diego, CA, USA), eBioscience (San Diego, CA, USA), Thermo Fisher Scientific, BD Biosciences (Franklin Lakes, NJ, USA), and MBL (Nagoya, Japan). Cytokine expression by CD8+ T cells was determined using a previously reported protocol for intracellular cytokine staining.22 Briefly, splenic cells were incubated in the presence of Golgi Plug (BD Biosciences) for 6 hours with or without OVA peptide257‐264 followed by incubation with Abs to surface markers. The cells were then permeabilized in Cytofix‐Cytoperm Plus (BD Biosciences) and stained with a γ‐interferon (IFN‐γ) mAb. Flow cytometry was carried out using a FACSCalibur or FACSCanto II (BD Biosciences) with FlowJo software (FlowJo, Ashland, OR, USA).
Additional materials and methods can be found in Data S1.
3. RESULTS
3.1. Antigen encapsulated in different types of PGL‐Ag captured by different types of APCs in vitro
We generated small and large liposomes and assessed their size distribution and polydispersity index (PDI) as well as fluorescence intensity. According to the measurements obtained by dynamic light scattering, the small and large liposomes were 169 nm and 1029 nm, respectively (Figure S1). Furthermore, the PDI of the small and large liposomes was 0.083 and 0.322, respectively. Because PDI < 0.1 indicates monodispersity, we determined that the small liposomes were monodispersed and the large liposomes were polydispersed. We also confirmed the formation of liposomes by assessing the lipid composition with transmission electron microscopy (Figure S1). Next, we analyzed the phospholipid concentration using the Phospholipid Quantitative Determination Kit (PHOSPHOLIPIDS C AUTOKIT 2‐10 DEGC 120TST, Wako, Japan), which revealed that the small and large liposomes contained 0.79 and 0.88 mg/mL phospholipids, respectively (Figure S1D). In addition, the rhodamine concentration of each liposome dispersion was determined by measurement of absorbance at 570 nm. As shown in Figure S1C,D, the rhodamine concentrations of the small and large liposomes were 14.3 and 15.8 μg/mL, respectively (Figure S1C,D), with an extinction coefficient of 75 000/M/cm.
Next, we evaluated which types of PGL‐Ag, small (200 nm) or large (1000 nm), can be taken up by APCs in vitro (Figure 1A,B). To begin, we examined the amount of protein per 100 μg PGL (/mL) contained in each type of liposome by ELISA. The OVA protein levels in large PGL‐Ag were not statistically different from those in small PGL‐Ag. We cultured bone marrow‐derived DCs (BM‐DCs) with the 2 types of liposomes for 18 hours to examine whether DCs can capture these liposomes in vitro (Figure 1C‐E). Expression of MHC class II on BM‐DCs was not different in the presence or absence of PGL‐Ag (Figure 1C), indicating that the capture of PGL‐Ag did not promote the spontaneous maturation of BM‐DCs. Bone marrow‐derived DCs initiated PGL‐Ag capture at 3 hours, which nearly plateaued at 18 hours (Figure 1D,E, upper). Large PGL‐Ag was captured by BM‐DCs compared with small PGL‐Ag (Figure 1D,E, upper). Furthermore, the mean fluorescent intensity of PE (rhodamine) increased at 10 hours, after which it plateaued (Figure 1E, lower). These results indicated increased large PGL‐Ag content in DCs compared with that of small PGL‐Ag. Next, we assessed the capture of PGL‐Ag by bone marrow‐derived macrophages (BM‐Mϕs) (Figure 2A,B). Similar to BM‐DCs, the time kinetics of PGL‐Ag capture by BM‐Mϕs began at 3 hours and increased until 18 hours. In contrast to DCs, BM‐Mϕs showed similar phagocytic activity toward the small and large PGL‐Ag (Figure 2C‐i). However, the mean fluorescent intensity of PE (rhodamine) was higher for large PGL‐Ag‐capturing Mϕs for at least 18 hours (Figure 2C‐ii). These results indicated that the content of large PGL‐Ag in Mϕs was much higher than that of small PGL‐Ag. Thus, BM‐Mϕs captured both types of PGL‐Ag, whereas DCs predominantly took up large PGL‐Ag. With regard to the amounts of PGL‐Ag contained in APCs, the amount of large PGL‐Ag was much higher than that of small PGL‐Ag.
Figure 1.
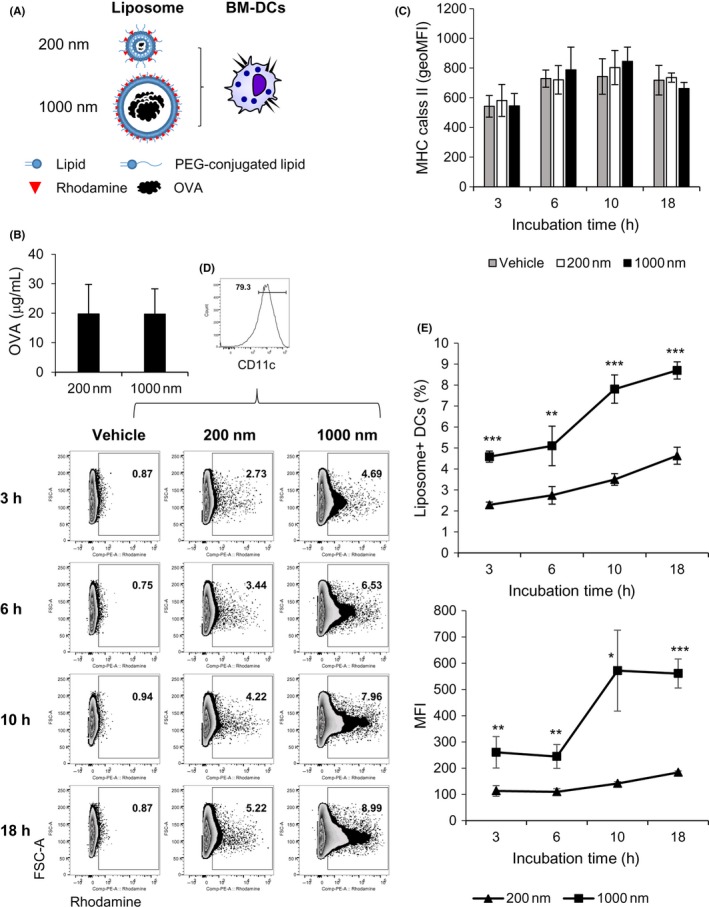
Dendritic cell (DC) uptake of antigen‐encapsulating liposomes in a size‐dependent manner. A, Ovalbumin (OVA) antigen‐encapsulating liposomes—large (1000 nm) and small (200 nm)—were fabricated to contain OVA protein and present rhodamine on the surface. B, The amounts of OVA protein in both liposomes were measured by ELISA (n = 8). C‐E, Bone marrow‐derived DCs (BM‐DCs) were cultured with the two sizes of OVA antigen‐encapsulating liposomes for 18 hours (n = 4). Expression of MHC class II on DCs was analyzed by flow cytometry. C, The frequency (E, upper) and mean fluorescent intensity (MFI) (E, lower) of liposome uptake by DCs were measured by FACS at the indicated time points. Significance of difference between 200‐nm and 1000‐nm liposomes: *P < .05, **P < .01, ***P < .001, Student's t test
Figure 2.
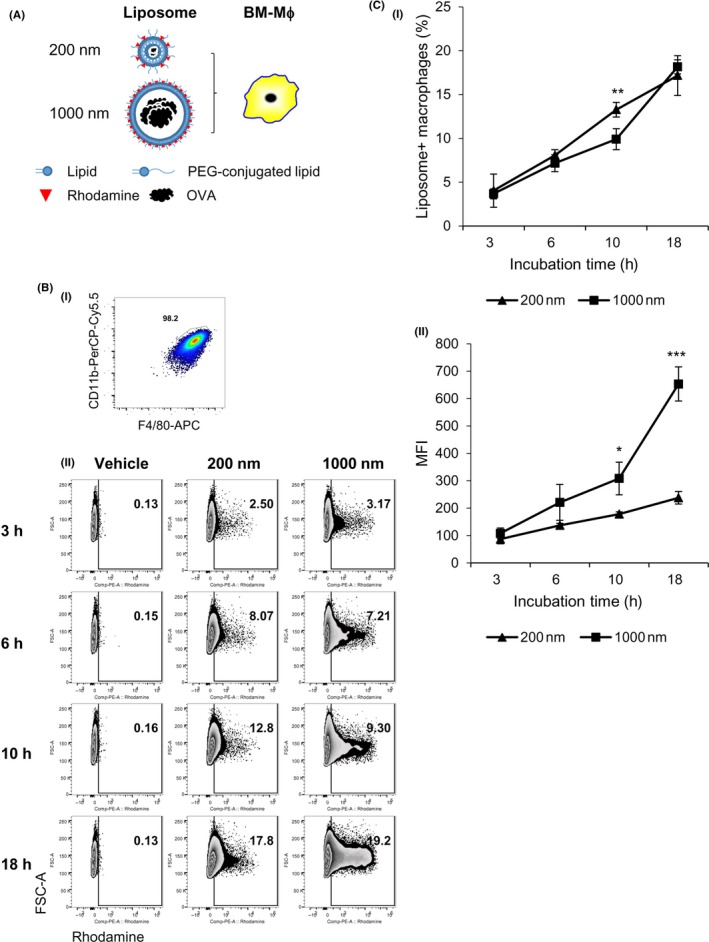
Macrophage uptake of antigen‐encapsulating liposomes. A‐C, Bone marrow‐derived macrophages (BM‐Mϕs) were verified to express CD11b+F4/80+ (A,B‐i) and were cultured with two types of ovalbumin (OVA) antigen‐encapsulating liposomes, small and large, for 18 hours (n = 4). The frequency (B,C‐i) and mean fluorescent intensity (MFI) (C‐ii) of BM‐Mϕs uptake of the liposomes were measured by flow cytometry at the indicated time points. Significance of difference between 200‐nm and 1000‐nm liposomes: *P < .05, **P < .01, ***P < .001, Student's t test
3.2. Alteration of APC function by capture of PGL‐Ag
We speculated that APCs sometimes change after the uptake of exogenous antigen. To evaluate APC function, we compared the cytokine production (interleukin [IL]‐12p40 as an immunostimulative and IL‐10 as an immunosuppressive cytokine) of BM‐DCs or BM‐Mϕs after capture of particles. Dendritic cells capturing the large PGL‐Ag produced high levels of IL‐12p40, but not IL‐10 (Figure 3A). Bone marrow‐derived Mϕs produced less IL‐12p40 than DCs, but still at sufficient amounts. In contrast, BM‐Mϕs produced more IL‐10 than BM‐DCs, but the amount of IL‐10 was still lower. With regard to small PGL‐Ag capture, there was little difference between BM‐DCs and BM‐Mϕs in the production of IL‐12p40 and IL‐10. These results indicated that large PGL‐Ag have the potential to enhance the capacity of DCs and Mϕs, which would help generate antigen‐specific T cells.
Figure 3.
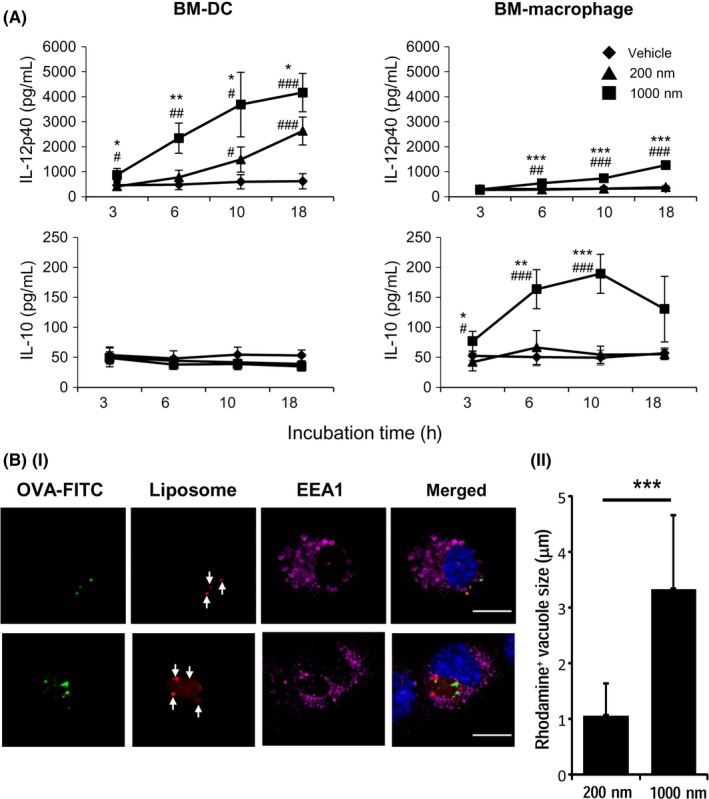
Stimulation of antigen‐presenting cell function by capture of antigen‐encapsulating liposomes. A, The cytokine production of dendritic cells (DCs) or macrophages after particle capture was measured. Bone marrow‐derived (BM)‐DCs and macrophages were cultured with each liposome, and the supernatants were measured for interleukin (IL)‐12p40 and IL‐10 by ELISA (n = 4). Significance of difference between 200‐nm and 1,000‐nm liposomes: *P<.05, **P<.01, ***P<.001. Significance of difference between vehicle and 200‐nm or 1,000‐nm liposomes: #P<.05, ##P<.01, ###P<.001, Student’s t test. B, (i) Engulfment of liposomes by BM‐DCs was assessed by confocal microscopy. BM‐DCs were cocultured with ovalbumin (OVA)‐FITC‐containing small (upper panels) and large (lower panels) rhodamine+ liposomes for 10 hours and then fixed and stained with anti‐EEA rabbit polyclonal Ab, anti‐rabbit Alexa 647 (magenta), and DAPI (blue). Representative images are shown. Arrows indicate intracellularly engulfed rhodamine+ liposomes. (ii) Rhodamine+ vacuoles, representing liposome‐containing particles, in BM‐DCs were calculated from captured confocal microscopic images. At least 15 images of vacuoles were analyzed (mean ± SEM, ***P < .001)
The engulfment of PGL‐Ag by BM‐DCs was evaluated 10 hours after culturing. The PGL‐Ag of 200 nm diameter (Figure 3B‐i, upper panels) and 1000 nm diameter (Figure 3B‐i, lower panels) incorporated into BM‐DCs were visualized by confocal microscopy. In BM‐DCs, PGL‐Ag appeared to be accumulated, as the size of rhodamine+ vacuoles was larger than the original liposome size, and therefore the size of each vacuole in the 1000 nm PGL‐Ag‐incorporating cells was much larger than that in the 200 nm PGL‐Ag‐incorporating cells (Figure 3B‐ii).
3.3. Different types of PGL‐Ag were captured by APCs in lymphoid tissues after administration in vivo
We next investigated the potential of APCs for capturing PGL‐Ag in vivo. After administration of small or large PGL‐Ag, we compared the capturing potentials of DC subsets (CD11c+CD8α+ DCs or CD11c+CD8α− DCs) and CD11b+F4/80+ Mϕs in the spleen. The ability of APCs to capture the PGL‐Ag was assessed 3 hours after i.v. PGL‐Ag injection (Figure 4A,B). We speculated that small PGL‐Ag would be taken up by the APCs. As small PGL‐Ag, that is, the anticancer drug within the nanoparticles, are likely to permeate blood vessels, they were reported to have effective antitumor ability.23 However, small PGL‐Ag were captured at equal proportions by all types of APCs, but at low frequency (5%‐8%) (Figure 4C). In contrast, large PGL‐Ag were surprisingly captured at higher amounts in vivo by APCs, particularly by CD8α+ DCs and Mϕs, than small PGL‐Ag (Figure 4B,C). Thus, irrespective of the size, any PGL‐Ag can be taken up by APCs. Nonetheless, the antigen content in the large PGL‐Ag was more efficiently captured mainly by CD8α+ DCs and Mϕs. Therefore, the choice of size of PGL‐Ag can determine the subsequent PGL‐Ag‐capturing APC types.
Figure 4.
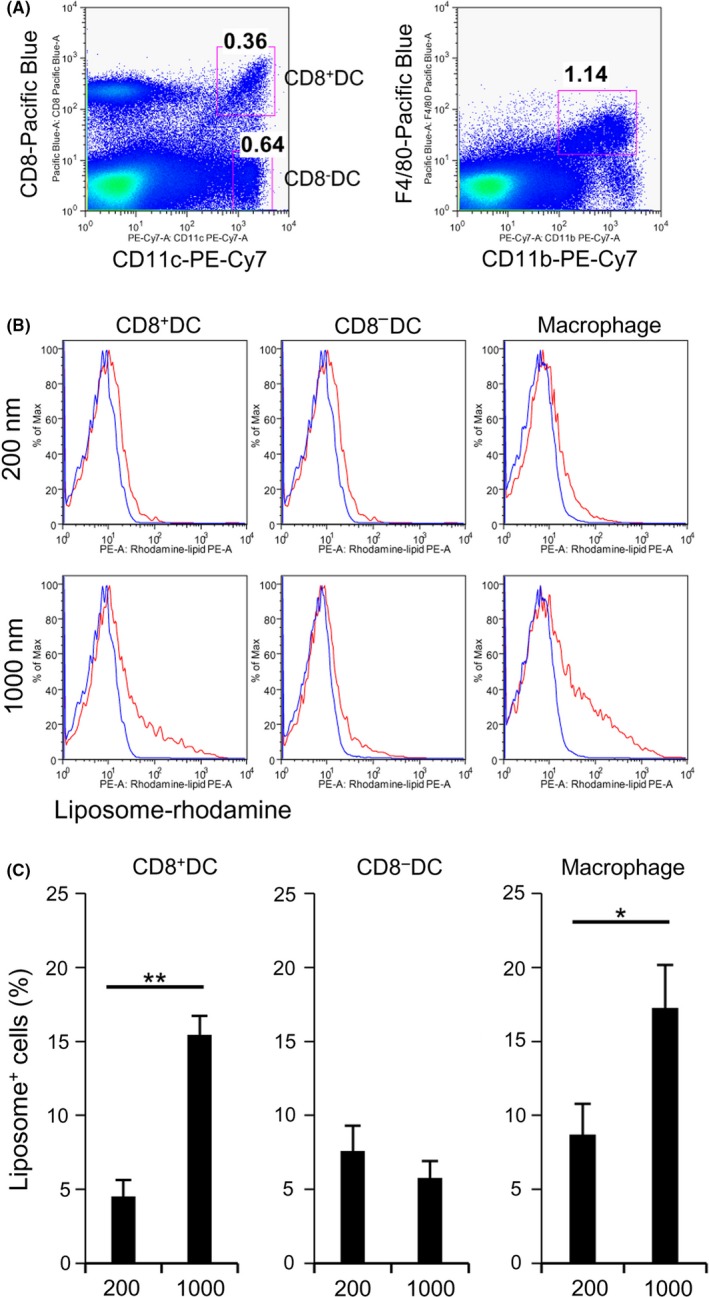
Dendritic cell (DC) and macrophage (Mϕ) capture of different types of liposomes in vivo. A, The liposome‐capturing ability of DC subsets (CD11c+ CD8α+ DCs or CD11c+ CD8α− DCs) and CD11b+F4/80+ Mϕs was analyzed in the spleen. B,C, The ability of antigen‐presenting cells, including DCs and Mϕs, to capture the liposomes was assessed by FACS 3 hours after i.v. injection of small or large liposomes (100 μg/mouse). Uptake of liposomes was measured by rhodamine fluorescence. C, Data were pooled from 8 (200 nm) or 9 (1000 nm) independent experiments. *P < .05, **P < .01, Student's t test
3.4. Antigen‐presenting activity and antigen‐specific T cell induction by Ag‐PGL
We assumed that the function of APCs capturing antigen can determine the subsequent antigen‐specific T cell response in vivo. As shown in Figure 1B, the amount of encapsulated OVA protein was the same in the large and small PGL‐Ag. To assess the antigen‐presenting activity, 1 day after adoptive transfer of congenic carboxyfluorescein succinimidyl ester‐labeled OVA‐specific CD8+ T cells, mice were i.v. injected with 1000‐nm OVA‐encapsulating PGL‐Ag with or without immunoadjuvant polyinosinic‐polycytidylic acid (poly(I:C)). Three days after PGL‐Ag injection, OVA‐specific CD8+ T cells vigorously proliferated in immunized mouse spleen (Figure S2). Nevertheless, OVA‐specific CD8+ T cell proliferation was not significantly different between immunized mice administered PGL‐Ag with and without poly(I:C) (Figure S2C). This suggested that liposome‐encapsulated OVA can be efficiently processed and presented on MHC of DCs to OT‐I T cells in vivo, resulting in OT‐I cell proliferation.
We then investigated whether antigen‐specific T cell immunity can be generated in WT mice. C57BL/6 mice were immunized with small or large OVA‐encapsulating PGL together with poly(I:C). Seven days after immunization, OVA‐specific CD8+ T cells were analyzed in the spleen, lymph nodes (LNs), liver, and lungs (Figure 5). Antigen‐specific T cell responses to large PGL‐Ag were superior to those to small PGL‐Ag (Figure 5A,B). We also verified that antigen‐specific T cells produced IFN‐γ in an antigen‐dependent manner (Figure 5C,D). These results indicated that APCs preferentially took up large PGL‐Ag and efficiently induced antigen‐specific T cell response in vivo. Next, we assessed the route of administration. For this, we compared the s.c. route of vaccination to the i.v. route. When we administered the large PGL‐Ag plus poly(I:C) s.c., we did not detect a T cell response as robust as that from i.v. administration (Figures 5 and S3). In addition, the antigen‐specific splenic T cell response from i.v. administration was significantly more pronounced than that from s.c. administration (P < .05). We subsequently investigated the vaccine protocol by comparing the form of antigen. Our current approach of administration of large PGL‐Ag with poly(I:C) was compared with another vaccine form, that is, large PGL‐Ag conjugated with poly(I:C). We found that the T cell responses to both vaccines based on tetramer and antigen‐specific IFN‐γ production were not statistically different (Figure S4A,B). Therefore, we used the co‐administration approach in our experiments thereafter.
Figure 5.
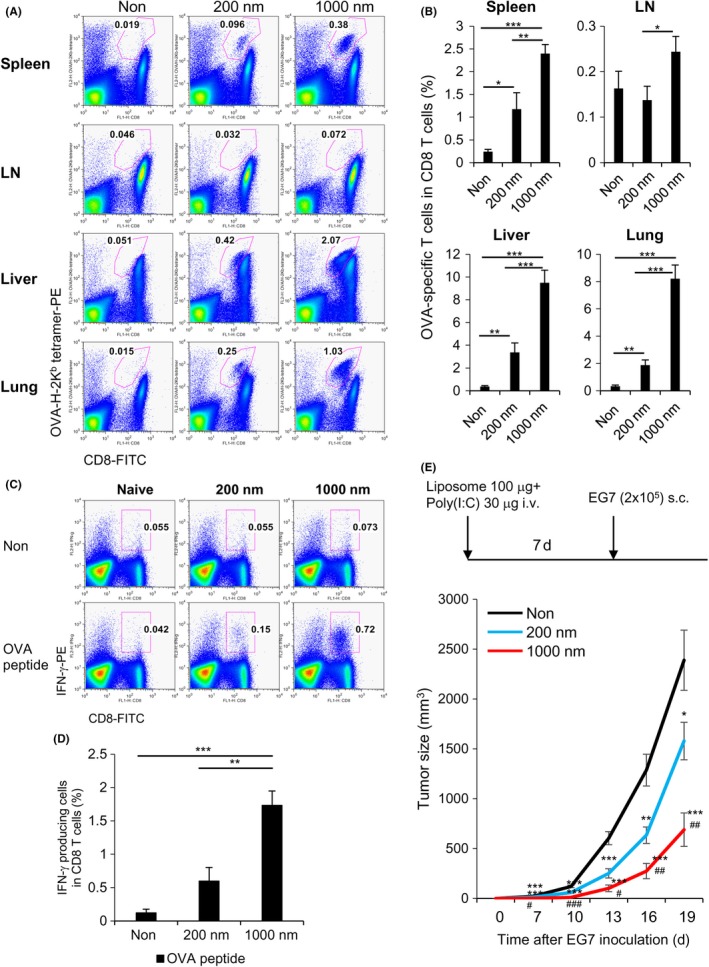
Antigen‐specific T cell induction and prophylactic antitumor effect of protein antigen‐encapsulating liposomes. A,B, C57BL/6 mice were i.v. administered small or large ovalbumin (OVA)‐encapsulating liposomes together with polyinosinic‐polycytidylic acid (poly(I:C)). Seven days23 after immunization, OVA‐specific CD8+ T cells were analyzed using CD8‐FITC and OVA tetramer‐PE in the spleen, lymph node (LN), liver, and lung. The numbers indicate OVA‐H‐2Kb tetramer+ T cells in CD8 T cells. Data were pooled from 8‐10 (negative control), 8‐9 (200 nm), or 10‐11 (1000 nm) independent experiments. *P < .05, **P < .01, ***P < .001, Student's t test. C,D, Same as (A), but antigen‐specific T cell responses to small or large OVA‐encapsulating liposomes were assessed for γ‐interferon (IFN‐γ) production by intracellular staining. For this, spleen cells were cultured in the presence and absence of OVA peptide for 6 hours. Numbers indicate the OVA peptide‐specific IFN‐γ production in CD8 T cells. Data were pooled from 8‐10 (negative control), 8‐9 (200 nm), or 10‐11 (1000 nm) independent experiments. *P < .05, **P < .01, ***P < .001, Student's t test. E, Scheme of antitumor prophylactic model protocol is shown. C57BL/6 mice were injected i.v. with small or large OVA‐encapsulating liposomes together with poly(I:C). One week later, the mice were inoculated with EG7 cells s.c. in the right flank. Data were pooled from 5 independent experiments (n = 12). Significance of difference between vehicle and 200‐nm or 1000‐nm liposomes: *P < .05, **P <0.01, ***P < .001. Significance of difference between 200‐nm and 1000‐nm liposomes: # P < .05, ## P < .01, ### P < .001, Student's t test
3.5. Effective antitumor strategy designed with PGL‐Ag vaccine
In the prophylactic tumor models, mice were i.v. vaccinated with small or large PGL‐Ag together with poly(I:C). One week later, the mice were challenged with s.c. EG7 tumor cells (OVA‐expressing EL4 lymphoma) (Figure 5E). Mice vaccinated with large PGL‐Ag showed significantly inhibited tumor growth, whereas those vaccinated with small PGL‐Ag revealed less tumor inhibition. Next, we examined the antitumor effect against established tumors in the therapeutic model. Initially, C57BL/6 mice were inoculated with EG7 s.c. and treated i.v. (Figure 6A) or intratumorally (i.t.) (Figure 6B) with large PGL‐Ag and poly(I:C) twice. As a result, we detected an antitumor effect in the prophylactic model, but there was no difference in tumor growth between large PGL‐Ag‐treated and untreated mice in the therapeutic model.
Figure 6.

Antitumor therapeutic strategy for protein antigen‐encapsulating liposome. C57BL/6 mice were inoculated s.c. with 2 × 10⁵ EG7 cells in the right flank and treated with large ovalbumin (OVA)‐encapsulating liposome and polyinosinic‐polycytidylic acid (poly(I:C)) twice i.v. (A) or intratumorally (i.t.) (B). Data were pooled from 2 independent experiments (n = 6). C, As a new therapeutic strategy, mice that had been inoculated with 2 × 10⁵ EG7 cells were treated twice i.v. with large liposomes and poly(I:C) 6 and 9 days later and were again treated twice i.t. with small or large liposomes and poly(I:C) 12 and 15 days later. Tumor size was measured every 3 days (C, upper panels). Tumor size was measured at every 3 days (C, lower panel). Data were pooled from 4 independent experiments (n = 7). Significance of difference between vehicle and small or large liposomes: *P < .05, **P < .01, ***P < .001. Significance of difference between small and large liposomes: # P < .05, ## P < .01, ### P < .001, Student's t test
It has been reported that vaccine and boosting approaches designed for administration by different routes are sometimes more effective, even if a single therapy is ineffective.24 To establish a more effective PGL‐Ag vaccine protocol in vivo, we tested the vaccine‐boosting protocol. Instead of boosting i.v., we examined the approach of sequential i.t. injection, that is, administration directly to the tumor site of tumor‐bearing mice (Figure 6C, upper panels). Tumor‐bearing mice, which had been injected with EG7 6 days before, were treated twice with large PGL‐Ag and poly(I:C) i.v. and then boosted by large PGL‐Ag and poly(I:C) i.t. (Figure 6C, upper panels). Three days after the first i.t. injection (d15), tumor growth was significantly suppressed by treatment with both sizes of PGL‐Ag; particularly, therapy with the large PGL‐Ag led to marked tumor inhibition (Figure 6C, lower). Thus, we showed the advantage of vaccine i.t. boosting.
3.6. Retention of PGL‐Ag by APCs at tumor sites
We next investigated the potential of APCs for capturing PGL‐Ag in the tumor sites. We assessed the antigen retention in vivo to elucidate the mechanism of superior antigen‐specific T cell immunity that was elicited by boosting with large PGL‐Ag. For this analysis, the retention of PGL‐Ag in immune cells at tumor sites was monitored with the IVIS instrument, IVIS Lumina Series III, PerkinElmer, Hopkinton, MA, (Figure 7A,B). Small and large PGL‐Ag were retained at the tumor, peaking at 3 hours and gradually decreasing until 24 hours. The large PGL‐Ag was sustained at tumor sites for more than 24 hours after administration (Figure 7A). When we compared small and large PGL‐Ag, the amount and intensity of large PGL‐Ag were 2‐fold higher than those of small PGL‐Ag (Figure 7B). Thus, the mechanisms of decreased kinetics of both PGL‐Ag were similar, but large PGL‐Ag were much more sustained. Then, we assessed the types of APCs that recruit and capture the PGL‐Ag and sustain them at the tumor site. In fact, CD103+ and CD103− DC subsets and F4/80+ Mϕs took up large PGL‐Ag 2‐3 times more efficiently than small PGL‐Ag (Figure 7C‐E). Above all, CD103+ DCs and Mϕs showed efficient uptake. Taken together, large PGL‐Ag can be taken up by CD103+ DCs or Mϕs at the tumor site more efficiently than small PGL‐Ag.
Figure 7.
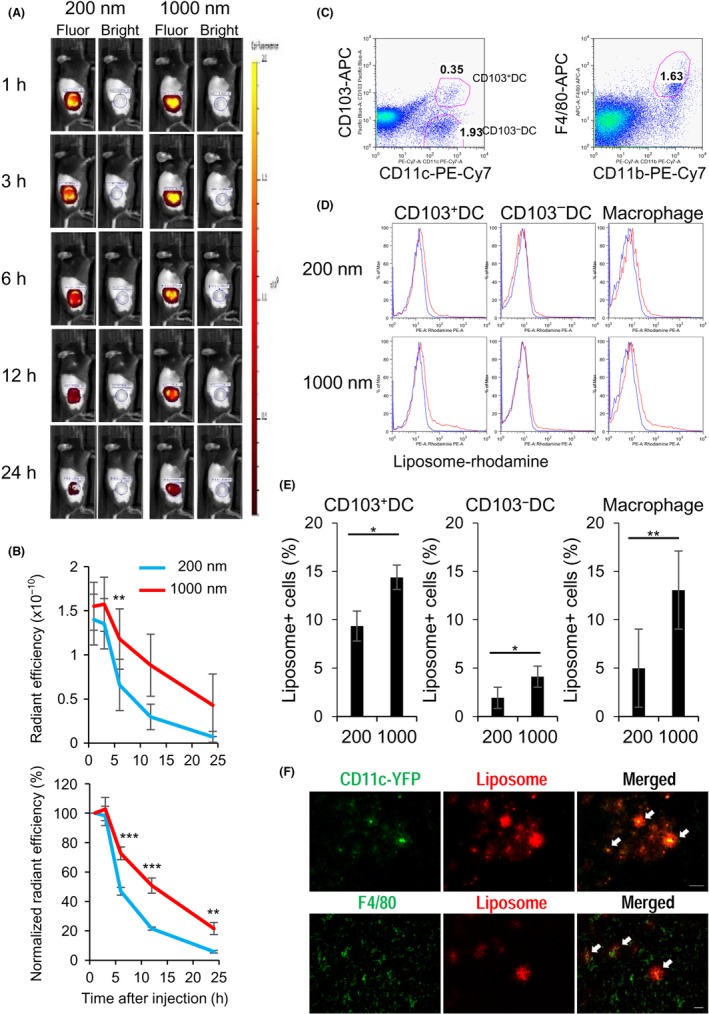
Retention of antigen‐encapsulating liposome by antigen‐presenting cells (APCs) at tumor sites. The retention of liposomes by APCs at the tumor site was monitored with the IVIS instrument. Twelve days after s.c. inoculation of EG7 cells (2 × 10⁵) in the right flank of mice, 50 μg liposomes was injected into the tumor site. Mice were monitored by IVIS at the indicated time points. A, Typical localization of 200‐nm 24or 1000‐nm liposomes in injected mice in fluorescence (Fluor) or bright field. B, Radiant efficiency of rhodamine from the tumor site (upper panel) and normalized radiant efficiency calculated with the 1 hour time point (lower panel). Data were pooled from 4 independent experiments (n = 8). C‐E, APCs capturing the liposomes at the tumor site. The liposome‐capturing capacity of APCs at the tumor site, including dendritic cell (DC) subsets (CD103+ and CD103− DCs) (C, left) and F4/80+ macrophages (C, right), was analyzed 12 hours after administration of antigen‐encapsulating liposomes (D, E). Data were pooled from 5 independent experiments (n = 8‐9). Significance of difference between small and large liposomes: *P < .05, **P < .01, ***P < .001. F, Upper panels: same as in (C), but CD11c‐YFP transgenic mice were used as recipients. Tumors were harvested 12 hours after administration of antigen‐encapsulating liposomes. Representative fluorescence images of CD11c+ DCs (green) and liposomes (red) in tumor sites are shown. Scale bar = 50 μm. Lower panels: same as in (A), but WT type mice were used as recipients. Representative fluorescence images of F4/80+ macrophages (green) and liposomes (red) in tumor sites are shown. Scale bar = 50 μm
3.7. Dynamics of tumor antigen‐specific T cells after treatment with PGL‐Ag
To understand the immune response in a successful therapeutic strategy, we monitored the T cell response in lymphoid tissues and tumor sites. To trace the T cell response, CD8+ OT‐I T cells were transferred to mice that were treated i.v. with large PGL‐Ag together with poly(I:C) and then boosted with this concoction i.t (Figure 8A). Before the treatment (d6), OT‐I CD8+ T cells were detected in lymphoid organs (regional LNs and spleen), but not at the tumor site (Figure 8B,C). In fact, there was no difference between the frequency in regional LNs and distal LNs. On day 18, after treatment with large PGL‐Ag and poly(I:C), OT‐I CD8+ T cells were greatly expanded in lymphoid organs and the tumor site. Although the peak of OT‐I CD8+ T cells occurred 12 days after i.v. immunization, tumors were not inhibited. By boosting using i.t. immunization with large—but not small—PGL‐Ag, the frequency of OT‐I CD8+ T cells was increased at the tumor site of mice (Figure 8B,C). In this case, tumor cells were inhibited. However, the frequency of natural killer cells was not significantly different between immunized mice and untreated mice (Figure S5). These results indicated that large PGL‐Ag immunization not only established antigen‐specific CTL but also effectively enhanced their infiltration into the tumor.
Figure 8.
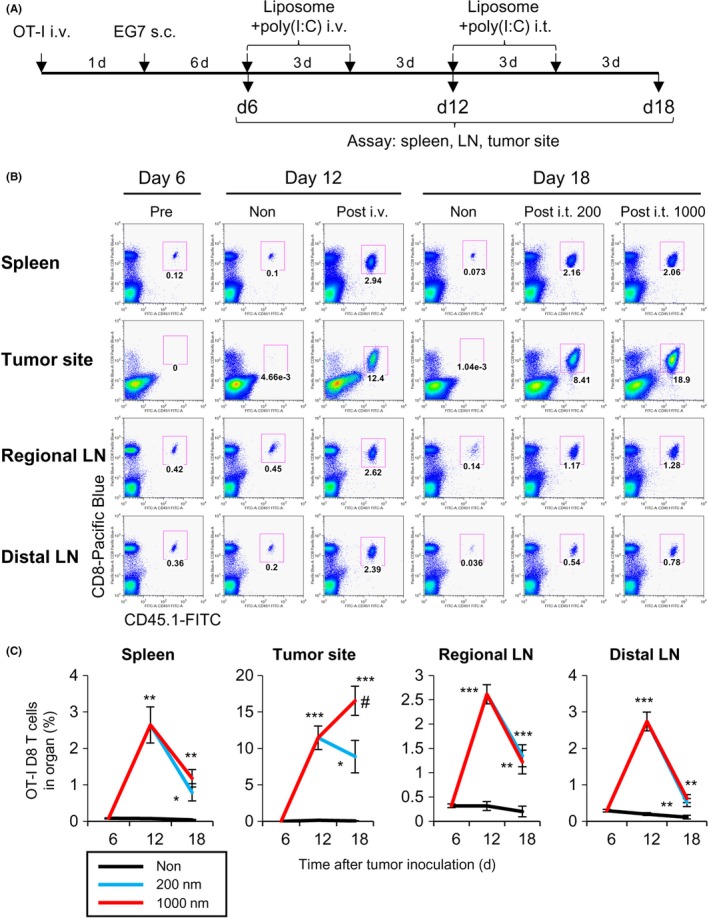
Dynamics of antigen‐specific CD8 T cell response in lymphoid tissues and tumor sites in antigen‐containing liposome‐immunized mice. A, Scheme of the experimental protocol; OT‐I cells were transferred to monitor T cells. CD8+ OT‐I T cells were transferred to mice, and EG7 tumors were inoculated on the following day. The mice were treated i.v. twice with large liposome‐encapsulated ovalbumin (OVA) together 25with polyinosinic‐polycytidylic acid (poly(I:C)) on days 6 and 9. The mice were boosted by liposome‐encapsulated OVA and poly(I:C) intratumorally (i.t.) on days 12 and 15. B, OT‐I CD8+ T cells were analyzed as CD3 and TCR Vα2+ T cells after gating CD8+ CD45.1+ cells. Representative dot plots from 4 independent experiments (n = 6‐7). C, Frequency of OT‐I CD8 T cells at the indicated time points. Data were pooled from 4 independent experiments (n = 6‐7). Significance of difference between vehicle and 200‐nm or 1000‐nm liposomes: *P < .05, **P < .01, ***P < .001. Significance of difference between 200‐nm and 1000‐nm liposomes: # P < .05, Student's t test. LN, lymph node
We also compared PGL‐Ag vaccination with OVA/complete Freund's adjuvant (CFA) immunization in terms of tumor infiltration of antigen‐specific CD8 T cells using OT‐I CD8 T cells. For this experiment, we used the same amount or 20 times more OVA protein in CFA. Immunization with PGL‐Ag elicited higher T cell infiltration in the tumor tissue than OVA/CFA immunization (Figure S6). These results indicated that the PGL‐Ag vaccine is potentially more effective for inducing an anticancer immune response than conventional vaccines.
4. DISCUSSION
Vaccines based on particulate antigens have been explored in terms of inducing efficient antigen‐specific CD8+ T cell response. Recent immunotherapeutic studies reported the importance of immune responses at tumor sites for therapeutic success. To understand the status of immune responses in nanoparticle‐treated tumor‐bearing hosts, we revealed in the current study that APC uptake and presentation of antigen by not only DCs in the spleen but also at the tumor site are crucial. We initially compared the effects of the size of PGL‐Ag and determined the APC types corresponding to large PGL‐Ag uptake. Based on our findings, we established the therapeutic protocol for priming of T cells in the spleen as well as boosting at tumor sites after immunization with liposomes. Our results indicated that large PGL‐Ag can promote not only phagocytosis but also cross‐presentation of encapsulated antigen by DCs at tumor sites, similar to those of splenic DCs. To our knowledge, this is the first report revealing cross‐presentation of large liposome‐encapsulated antigen by primary DCs in tumor sites.
Tumor antigen‐containing nanoparticle vaccines are anticipated to be useful because of their unique advantages—different from those of chemotherapeutic drug‐containing nanoparticles—and are thus proposed as off‐the‐shelf vehicles to deliver antigen directly to APCs in vivo. From this standpoint, our study clearly showed the optimal criteria for nanoparticle vaccines administered with immunostimulatory adjuvants: single or multiple use, form of tumor‐specific antigen, selection of combinatorial adjuvant agents, and route of administration. The resultant immune responses are dependent on the materials and methods of fabrication. Therefore, these nanoparticles must be analyzed individually in preclinical studies.
Although we found that after exposure to PGL‐Ag, DCs produced more IL‐12 than Mϕs but low amounts of IL‐10 (Figure 3A), we emphasized the importance of the role of DCs. Previous reports have shown that when tumor cells are killed by chemotherapy or irradiation or when tumor antigen protein is administered, CD103+ DCs in organs and CD8α+ DCs in lymphoid tissues show cross‐presentation and play a crucial role in CTL induction in tumor‐bearing or infection models.19, 25 It is generally known that DCs—but not Mϕs—are specialized for antigen presentation as well as cross‐presentation. This might be because lysosomal acidification is prevented in DCs, in which the recruitment of NADPH oxidase II to the early phagosomes increases the pH.26 Furthermore, the transition of encapsulated antigens from an early endosome/lysosome to cytosol can enhance the cross‐presentation. Simultaneously, cathepsins in DCs inhibit proteolytic destruction of antigens.27, 28 However, the DC subsets that take up and process liposomes have not been fully determined, especially at tumor sites. We found that CD8α+ DCs in the spleen and CD103+ DCs in tumor sites specifically endocytosed large PGL‐Ag. In addition, we detected vacuoles in DCs that harbored discrete nanoparticles through solution cross‐linking of protein; the PGL‐Ag remained (Figure 3B), and antigen was simultaneously retained and released stably from the particle in both lymphoid organs and tumor sites. These biological findings related to DCs in nanoparticle‐treated mice could help improve anticancer immunotherapy.
Although we used only the PGL‐Ag for vaccination, we assert the importance of a preclinical approach, that is, priming and boosting effects by antigen‐encapsulating nanoparticles are crucial at tumor sites in vivo. Our results suggest that vaccines with nanoparticle delivery systems, depending on their size and composition, could be designed to exclusively target DCs in the spleen, various other organs, and tumor tissues.29 Future clinical studies using antigen‐encapsulating nanoparticles could elucidate the relationship between the nature of nanoparticles and their adjuvant activities in cancer patients and justify the formulation parameters of APCs.
CONFLICT OF INTEREST
The authors have no financial conflicts of interest related to this manuscript.
Supporting information
Iyoda T, Yamasaki S, Kawamura M, et al. Optimal therapeutic strategy using antigen‐containing liposomes selectively delivered to antigen‐presenting cells. Cancer Sci. 2019;110:875–887. 10.1111/cas.13934
REFERENCES
- 1. Arvizo RR, Bhattacharyya S, Kudgus RA, Giri K, Bhattacharya R, Mukherjee P. Intrinsic therapeutic applications of noble metal nanoparticles: past, present and future. Chem Soc Rev. 2012;41:2943‐2970. [DOI] [PMC free article] [PubMed] [Google Scholar]
- 2. Lukianova‐Hleb EY, Kim YS, Belatsarkouski I, Gillenwater AM, O'Neill BE, Lapotko DO. Intraoperative diagnostics and elimination of residual microtumours with plasmonic nanobubbles. Nat Nanotechnol. 2016;11:525‐532. [DOI] [PubMed] [Google Scholar]
- 3. Sawant RR, Torchilin VP. Challenges in development of targeted liposomal therapeutics. AAPS J. 2012;14:303‐315. [DOI] [PMC free article] [PubMed] [Google Scholar]
- 4. Peek LJ, Middaugh CR, Berkland C. Nanotechnology in vaccine delivery. Adv Drug Deliv Rev. 2008;60:915‐928. [DOI] [PMC free article] [PubMed] [Google Scholar]
- 5. Worsham RD, Thomas V, Farid SS. Potential of continuous manufacturing for liposomal drug products. Biotechnol J 2018;13:e1700740. [DOI] [PubMed] [Google Scholar]
- 6. Waite CL, Roth CM. Nanoscale drug delivery systems for enhanced drug penetration into solid tumors: current progress and opportunities. Crit Rev Biomed Eng. 2012;40:21‐41. [DOI] [PMC free article] [PubMed] [Google Scholar]
- 7. Etheridge ML, Campbell SA, Erdman AG, Haynes CL, Wolf SM, McCullough J. The big picture on nanomedicine: the state of investigational and approved nanomedicine products. Nanomedicine. 2013;9:1‐14. [DOI] [PMC free article] [PubMed] [Google Scholar]
- 8. Bulbake U, Doppalapudi S, Kommineni N, Khan W. Liposomal formulations in clinical use: an updated review. Pharmaceutics 2017;9:1‐33. [DOI] [PMC free article] [PubMed] [Google Scholar]
- 9. Grippin AJ, Sayour EJ, Mitchell DA. Translational nanoparticle engineering for cancer vaccines. Oncoimmunology. 2017;6:e1290036. [DOI] [PMC free article] [PubMed] [Google Scholar]
- 10. Jung T, Kamm W, Breitenbach A, Hungerer KD, Hundt E, Kissel T. Tetanus toxoid loaded nanoparticles from sulfobutylated poly(vinyl alcohol)‐graft‐poly(lactide‐co‐glycolide): evaluation of antibody response after oral and nasal application in mice. Pharm Res. 2001;18:352‐360. [DOI] [PubMed] [Google Scholar]
- 11. Vila A, Sanchez A, Evora C, Soriano I, Vila Jato JL, Alonso MJ. PEG‐PLA nanoparticles as carriers for nasal vaccine delivery. J Aerosol Med. 2004;17:174‐185. [DOI] [PubMed] [Google Scholar]
- 12. Fifis T, Gamvrellis A, Crimeen‐Irwin B, et al. Size‐dependent immunogenicity: therapeutic and protective properties of nano‐vaccines against tumors. J Immunol. 2004;173:3148‐3154. [DOI] [PubMed] [Google Scholar]
- 13. Gutierro I, Hernandez RM, Igartua M, Gascon AR, Pedraz JL. Size dependent immune response after subcutaneous, oral and intranasal administration of BSA loaded nanospheres. Vaccine. 2002;21:67‐77. [DOI] [PubMed] [Google Scholar]
- 14. Kanchan V, Panda AK. Interactions of antigen‐loaded polylactide particles with macrophages and their correlation with the immune response. Biomaterials. 2007;28:5344‐5357. [DOI] [PubMed] [Google Scholar]
- 15. Li X, Sloat BR, Yanasarn N, Cui Z. Relationship between the size of nanoparticles and their adjuvant activity: data from a study with an improved experimental design. Eur J Pharm Biopharm. 2011;78:107‐116. [DOI] [PMC free article] [PubMed] [Google Scholar]
- 16. Zhou F, Rouse BT, Huang L. Prolonged survival of thymoma‐bearing mice after vaccination with a soluble protein antigen entrapped in liposomes: a model study. Cancer Res. 1992;52:6287‐6291. [PubMed] [Google Scholar]
- 17. Steinman RM. Decisions about dendritic cells: past, present, and future. Annu Rev Immunol. 2012;30:1‐22. [DOI] [PubMed] [Google Scholar]
- 18. Palucka K, Banchereau J. Dendritic‐cell‐based therapeutic cancer vaccines. Immunity. 2013;39:38‐48. [DOI] [PMC free article] [PubMed] [Google Scholar]
- 19. Merad M, Sathe P, Helft J, Miller J, Mortha A. The dendritic cell lineage: ontogeny and function of dendritic cells and their subsets in the steady state and the inflamed setting. Annu Rev Immunol. 2013;31:563‐604. [DOI] [PMC free article] [PubMed] [Google Scholar]
- 20. Mildner A, Jung S. Development and function of dendritic cell subsets. Immunity. 2014;40:642‐656. [DOI] [PubMed] [Google Scholar]
- 21. Shimizu K, Yamasaki S, Shinga J, et al. Systemic DC activation modulates the tumor microenvironment and shapes the long‐lived tumor‐specific memory mediated by CD8 + T cells. Cancer Res. 2016;76:3756‐3766. [DOI] [PubMed] [Google Scholar]
- 22. Shimizu K, Fujii S. DC therapy induces long‐term NK reactivity to tumors via host DC. Eur J Immunol. 2009;39:457‐468. [DOI] [PubMed] [Google Scholar]
- 23. Tran S, DeGiovanni PJ, Piel B, Rai P. Cancer nanomedicine: a review of recent success in drug delivery. Clin Transl Med. 2017;6:44. [DOI] [PMC free article] [PubMed] [Google Scholar]
- 24. Lu S. Heterologous prime‐boost vaccination. Curr Opin Immunol. 2009;21:346‐351. [DOI] [PMC free article] [PubMed] [Google Scholar]
- 25. Macri C, Pang ES, Patton T, O'Keeffe M. Dendritic cell subsets. Semin Cell Dev Biol. 2018;84:11‐21. [DOI] [PubMed] [Google Scholar]
- 26. Savina A, Jancic C, Hugues S, et al. NOX2 controls phagosomal pH to regulate antigen processing during crosspresentation by dendritic cells. Cell. 2006;126:205‐218. [DOI] [PubMed] [Google Scholar]
- 27. Delamarre L, Pack M, Chang H, Mellman I, Trombetta ES. Differential lysosomal proteolysis in antigen‐presenting cells determines antigen fate. Science. 2005;307:1630‐1634. [DOI] [PubMed] [Google Scholar]
- 28. Lennon‐Dumenil AM, Bakker AH, Maehr R, et al. Analysis of protease activity in live antigen‐presenting cells shows regulation of the phagosomal proteolytic contents during dendritic cell activation. J Exp Med. 2002;196:529‐540. [DOI] [PMC free article] [PubMed] [Google Scholar]
- 29. Nisini R, Poerio N, Mariotti S, De Santis F, Fraziano M. The multirole of liposomes in therapy and prevention of infectious diseases. Front Immunol. 2018;9:155. [DOI] [PMC free article] [PubMed] [Google Scholar]
Associated Data
This section collects any data citations, data availability statements, or supplementary materials included in this article.
Supplementary Materials


